
Python matplotlib繪制雷達圖

一、matplotlib繪制圓形雷達圖
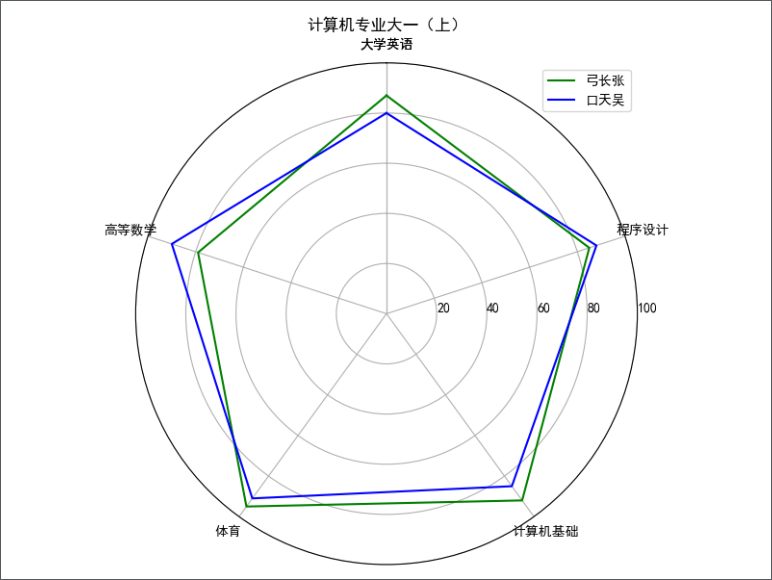
# coding=utf-8import numpy as npimport matplotlib.pyplot as pltresults = [{"大學(xué)英語": 87, "高等數(shù)學(xué)": 79, "體育": 95, "計算機基礎(chǔ)": 92, "程序設(shè)計": 85},{"大學(xué)英語": 80, "高等數(shù)學(xué)": 90, "體育": 91, "計算機基礎(chǔ)": 85, "程序設(shè)計": 88}]data_length = len(results[0])# 將極坐標根據(jù)數(shù)據(jù)長度進行等分angles = np.linspace(0, 2*np.pi, data_length, endpoint=False)labels = [key for key in results[0].keys()]score = [[v for v in result.values()] for result in results]# 使雷達圖數(shù)據(jù)封閉score_a = np.concatenate((score[0], [score[0][0]]))score_b = np.concatenate((score[1], [score[1][0]]))angles = np.concatenate((angles, [angles[0]]))labels = np.concatenate((labels, [labels[0]]))# 設(shè)置圖形的大小fig = plt.figure(figsize=(8, 6), dpi=100)# 新建一個子圖ax = plt.subplot(111, polar=True)# 繪制雷達圖ax.plot(angles, score_a, color='g')ax.plot(angles, score_b, color='b')# 設(shè)置雷達圖中每一項的標簽顯示ax.set_thetagrids(angles*180/np.pi, labels)# 設(shè)置雷達圖的0度起始位置ax.set_theta_zero_location('N')# 設(shè)置雷達圖的坐標刻度范圍ax.set_rlim(0, 100)# 設(shè)置雷達圖的坐標值顯示角度,相對于起始角度的偏移量ax.set_rlabel_position(270)ax.set_title("計算機專業(yè)大一(上)")plt.legend(["弓長張", "口天吳"], loc='best')plt.show()
二、matplotlib繪制多邊形雷達圖
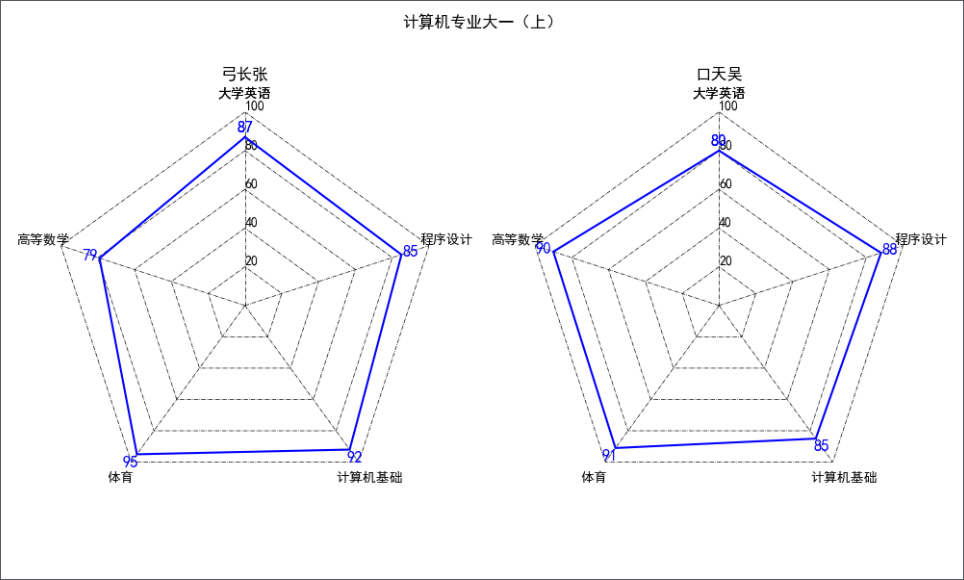
import numpy as npimport matplotlib.pyplot as pltresults = [{"大學(xué)英語": 87, "高等數(shù)學(xué)": 79, "體育": 95, "計算機基礎(chǔ)": 92, "程序設(shè)計": 85},{"大學(xué)英語": 80, "高等數(shù)學(xué)": 90, "體育": 91, "計算機基礎(chǔ)": 85, "程序設(shè)計": 88}]data_length = len(results[0])angles = np.linspace(0, 2*np.pi, data_length, endpoint=False)labels = [key for key in results[0].keys()]score = [[v for v in result.values()] for result in results]score_a = np.concatenate((score[0], [score[0][0]]))score_b = np.concatenate((score[1], [score[1][0]]))angles = np.concatenate((angles, [angles[0]]))labels = np.concatenate((labels, [labels[0]]))fig = plt.figure(figsize=(10, 6), dpi=100)fig.suptitle("計算機專業(yè)大一(上)")ax1 = plt.subplot(121, polar=True)ax2 = plt.subplot(122, polar=True)ax, data, name = [ax1, ax2], [score_a, score_b], ["弓長張", "口天吳"]for i in range(2):for j in np.arange(0, 100+20, 20):ax[i].plot(angles, 6*[j], '-.', lw=0.5, color='black')for j in range(5):ax[i].plot([angles[j], angles[j]], [0, 100], '-.', lw=0.5, color='black')ax[i].plot(angles, data[i], color='b')# 隱藏最外圈的圓ax[i].spines['polar'].set_visible(False)# 隱藏圓形網(wǎng)格線ax[i].grid(False)for a, b in zip(angles, data[i]):ax[i].text(a, b+5, '%.00f' % b, ha='center', va='center', fontsize=12, color='b')ax[i].set_thetagrids(angles*180/np.pi, labels)ax[i].set_theta_zero_location('N')ax[i].set_rlim(0, 100)ax[i].set_rlabel_position(0)ax[i].set_title(name[i])plt.show()
評論
圖片
表情