
基于Prometheus+Grafana打造企業(yè)級(jí)Flink監(jiān)控系統(tǒng)
點(diǎn)擊上方藍(lán)色字體,選擇“設(shè)為星標(biāo)”
回復(fù)”資源“獲取更多資源

Prometheus來龍去脈
靈活的數(shù)據(jù)模型:在Prometheus里,監(jiān)控?cái)?shù)據(jù)是由值、時(shí)間戳和標(biāo)簽表組成的,其中監(jiān)控?cái)?shù)據(jù)的源信息是完全記錄在標(biāo)簽表里的;同時(shí)Prometheus支持在監(jiān)控?cái)?shù)據(jù)采集階段對(duì)監(jiān)控?cái)?shù)據(jù)的標(biāo)簽表進(jìn)行修改,這使其具備強(qiáng)大的擴(kuò)展能力;
強(qiáng)大的查詢能力:Prometheus提供有數(shù)據(jù)查詢語言PromQL。從表現(xiàn)上來看,PromQL提供了大量的數(shù)據(jù)計(jì)算函數(shù),大部分情況下用戶都可以直接通過PromQL從Prometheus里查詢到需要的聚合數(shù)據(jù);
健全的生態(tài): Prometheus能夠直接對(duì)常見操作系統(tǒng)、中間件、數(shù)據(jù)庫、硬件及編程語言進(jìn)行監(jiān)控;同時(shí)社區(qū)提供有Java/Golang/Ruby語言客戶端SDK,用戶能夠快速實(shí)現(xiàn)自定義監(jiān)控項(xiàng)及監(jiān)控邏輯;
良好的性能:在性能方面來看,Prometheus提供了PromBench基準(zhǔn)測試,從最新測試結(jié)果來看,在硬件資源滿足的情況下,Prometheus單實(shí)例在每秒采集10w條監(jiān)控?cái)?shù)據(jù)的情況下,在數(shù)據(jù)處理和查詢方面依然有著不錯(cuò)的性能表現(xiàn);
更契合的架構(gòu):采用推模型的監(jiān)控系統(tǒng),客戶端需要負(fù)責(zé)在服務(wù)端上進(jìn)行注冊及監(jiān)控?cái)?shù)據(jù)推送;而在Prometheus采用的拉模型架構(gòu)里,具體的數(shù)據(jù)拉取行為是完全由服務(wù)端來決定的。服務(wù)端是可以基于某種服務(wù)發(fā)現(xiàn)機(jī)制來自動(dòng)發(fā)現(xiàn)監(jiān)控對(duì)象,多個(gè)服務(wù)端之間能夠通過集群機(jī)制來實(shí)現(xiàn)數(shù)據(jù)分片。推模型想要實(shí)現(xiàn)相同的功能,通常需要客戶端進(jìn)行配合,這在微服務(wù)架構(gòu)里是比較困難的;
成熟的社區(qū):Prometheus是CNCF組織第二個(gè)畢業(yè)的開源項(xiàng)目,擁有活躍的社區(qū);成立至今,社區(qū)已經(jīng)發(fā)布了一百多個(gè)版本,項(xiàng)目在 GitHub 上獲得的star數(shù)超過了3.8萬。

Prometheus架構(gòu)和組件
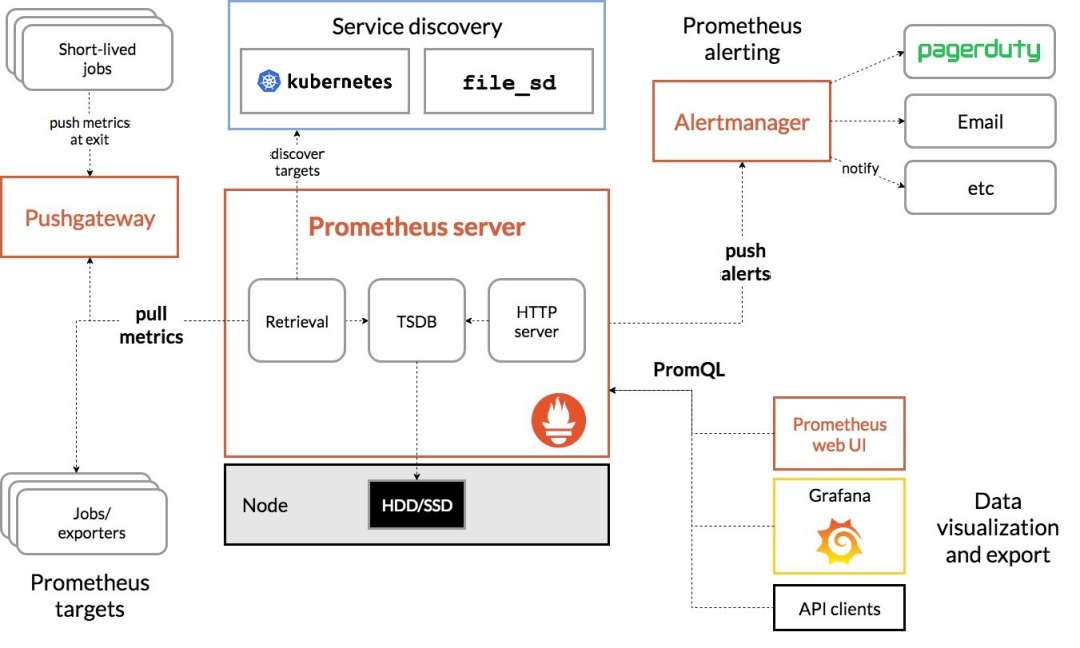
Prometheus Server: 用于收集和存儲(chǔ)時(shí)間序列數(shù)據(jù)。
Client Library: 客戶端庫,為需要監(jiān)控的服務(wù)生成相應(yīng)的 metrics 并暴露給 Prometheus server。當(dāng) Prometheus server 來 pull 時(shí),直接返回實(shí)時(shí)狀態(tài)的 metrics。
Push Gateway: 主要用于短期的 jobs。由于這類 jobs 存在時(shí)間較短,可能在 Prometheus 來 pull 之前就消失了。為此,這次 jobs 可以直接向 Prometheus server 端推送它們的 metrics。這種方式主要用于服務(wù)層面的 metrics,對(duì)于機(jī)器層面的 metrices,需要使用 node exporter。
Exporters: 用于暴露已有的第三方服務(wù)的 metrics 給 Prometheus。
Alertmanager: 從 Prometheus server 端接收到 alerts 后,會(huì)進(jìn)行去除重復(fù)數(shù)據(jù),分組,并路由到對(duì)收的接受方式,發(fā)出報(bào)警。常見的接收方式有:電子郵件,pagerduty,OpsGenie, webhook 等。
一些其他的工具。
Prometheus通過配置文件中指定的服務(wù)發(fā)現(xiàn)方式來確定要拉取監(jiān)控指標(biāo)的目標(biāo)(Target)。
接著從要拉取的目標(biāo)(應(yīng)用容器和Pushgateway),發(fā)起HTTP請求到特定的端點(diǎn)(Metric Path),將指標(biāo)持久化至本身的TSDB中,TSDB最終會(huì)把內(nèi)存中的時(shí)間序列壓縮落到硬盤。
Prometheus會(huì)定期通過PromQL計(jì)算設(shè)置好的告警規(guī)則,決定是否生成告警到Alertmanager,后者接收到告警后會(huì)負(fù)責(zé)把通知發(fā)送到郵件或企業(yè)內(nèi)部群聊中。
Prometheus的數(shù)據(jù)模型和核心概念
指標(biāo)名稱和標(biāo)簽
樣本
指標(biāo)(metric):指標(biāo)名稱和描述當(dāng)前樣本特征的 labelsets;
時(shí)間戳(timestamp):一個(gè)精確到毫秒的時(shí)間戳;
樣本值(value):一個(gè) folat64 的浮點(diǎn)型數(shù)據(jù)表示當(dāng)前樣本的值。
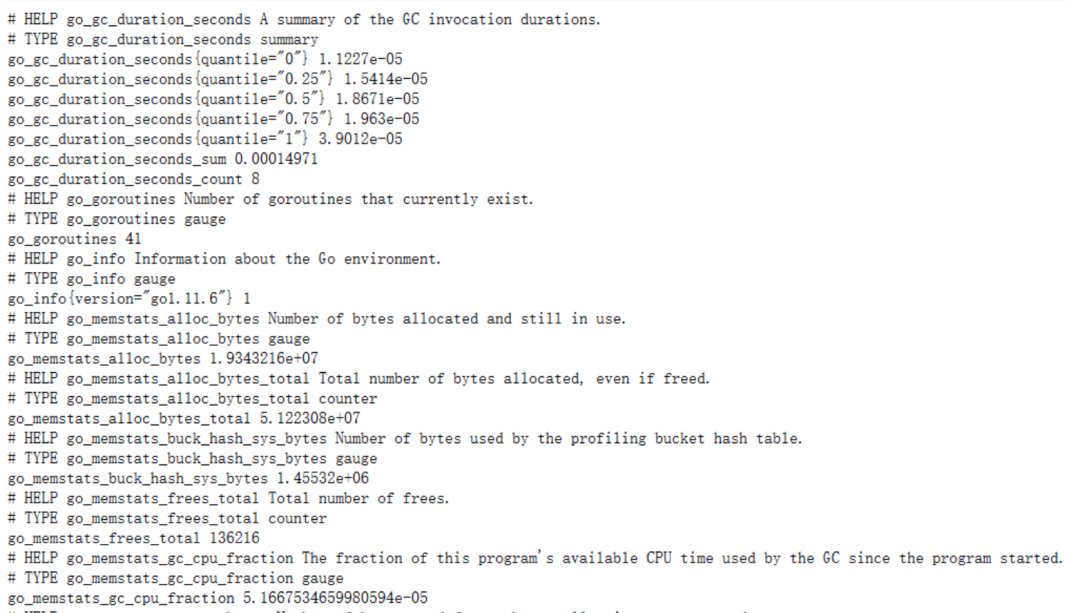
指標(biāo)類型
Counter:代表一種樣本數(shù)據(jù)單調(diào)遞增的指標(biāo),即只增不減,通常用來統(tǒng)計(jì)如服務(wù)的請求數(shù),錯(cuò)誤數(shù)等。
Gauge:代表一種樣本數(shù)據(jù)可以任意變化的指標(biāo),即可增可減,通常用來統(tǒng)計(jì)如服務(wù)的CPU使用值,內(nèi)存占用值等。
Histogram 和 Summary:用于表示一段時(shí)間內(nèi)的數(shù)據(jù)采樣和點(diǎn)分位圖統(tǒng)計(jì)結(jié)果,通常用來統(tǒng)計(jì)請求耗時(shí)或響應(yīng)大小等。
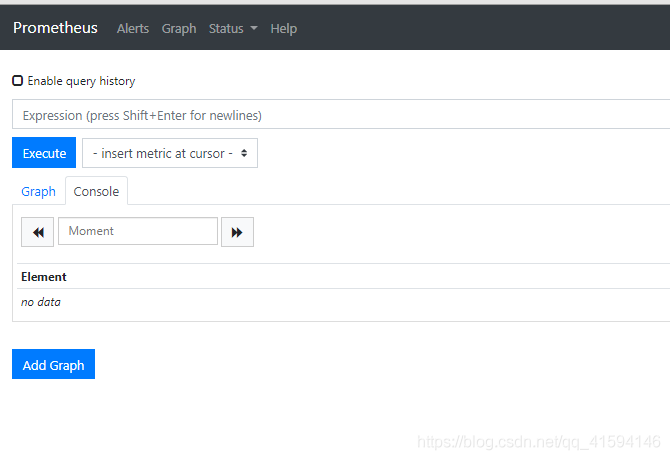
Prometheus的安裝
tar xvfz prometheus-*.tar.gz
cd prometheus-*
$ cd prometheus/
// 查看版本
$ ./prometheus --version
// 運(yùn)行server
$ ./prometheus --config.file=prometheus.yml
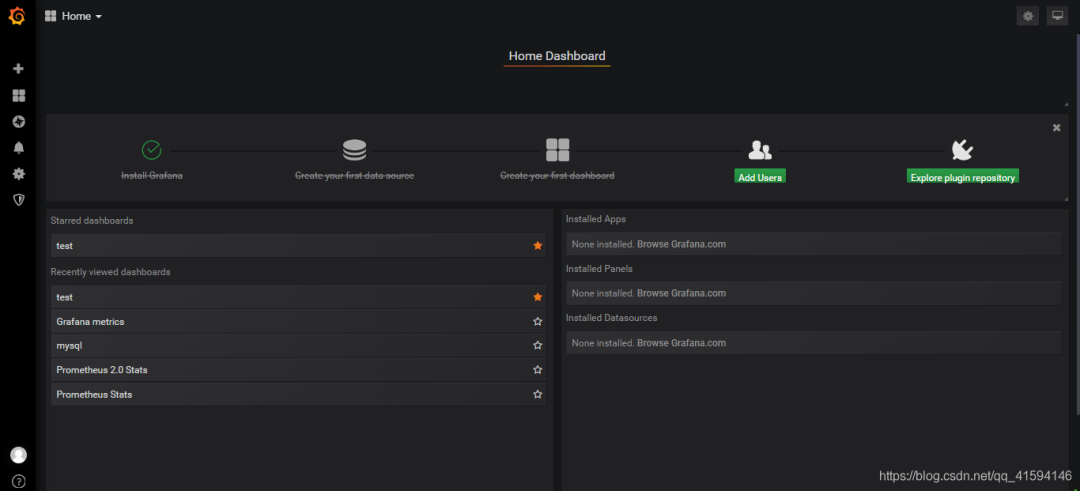
rpm -ivh grafana-6.5.2-1.x86_64.rpm
service grafana-server start
$ tar xvfz node_exporter-xxx.tar.gz
// 進(jìn)入解壓出的目錄
$ cd node_exporter-xxx
// 運(yùn)行監(jiān)控采集服務(wù)
$ ./node_exporter
Prometheus+Grafana+nodeManager+pushgateway打造企業(yè)級(jí)Flink平臺(tái)監(jiān)控系統(tǒng)
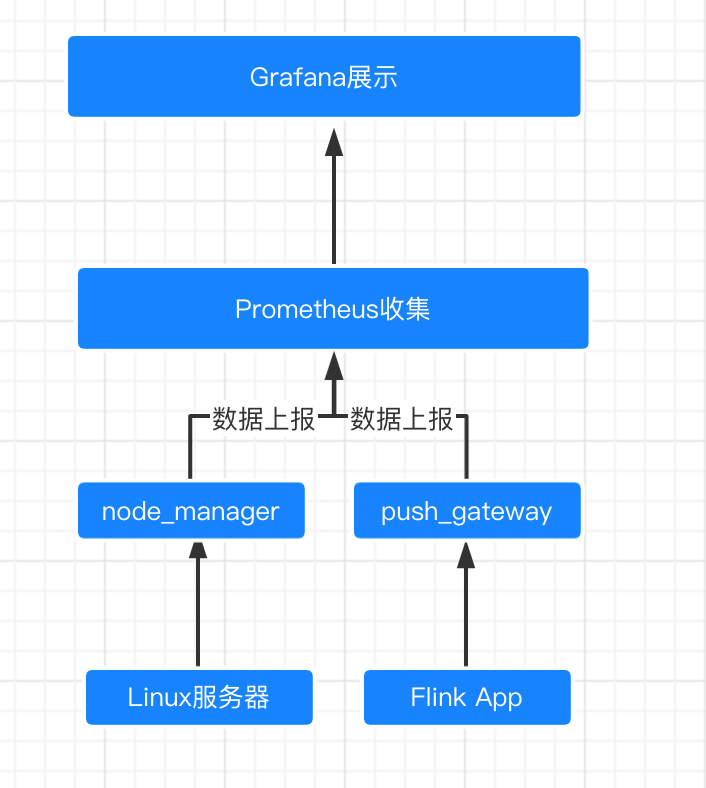
Flink App :這是我們需要監(jiān)控的數(shù)據(jù)來源
Pushgateway+nodeManger : 都是Prometheus 生態(tài)中的組件,pushGateway服務(wù)收集Flink的指標(biāo),nodeMnager負(fù)責(zé)監(jiān)控運(yùn)行機(jī)器的狀態(tài)
Prometheus : 我們監(jiān)控系統(tǒng)的主角
Grafana:可視化展示
metrics.reporter.promgateway.class: org.apache.flink.metrics.prometheus.PrometheusPushGatewayReporter
metrics.reporter.promgateway.host: node1
metrics.reporter.promgateway.port: 9091
metrics.reporter.promgateway.jobName: flinkjobs
metrics.reporter.promgateway.randomJobNameSuffix: false
metrics.reporter.promgateway.deleteOnShutdown: true
scrape_configs:
  - job_name: 'prometheus'
    static_configs:
      - targets: ['localhost:9090']
        labels:
          instance: 'prometheus'
  - job_name: 'linux'
    static_configs:
      - targets: ['localhost:9100']
        labels:
          instance: 'localhost'
  - job_name: 'pushgateway'
    static_configs:
      - targets: ['localhost:9091']
        labels:
          instance: 'pushgateway'
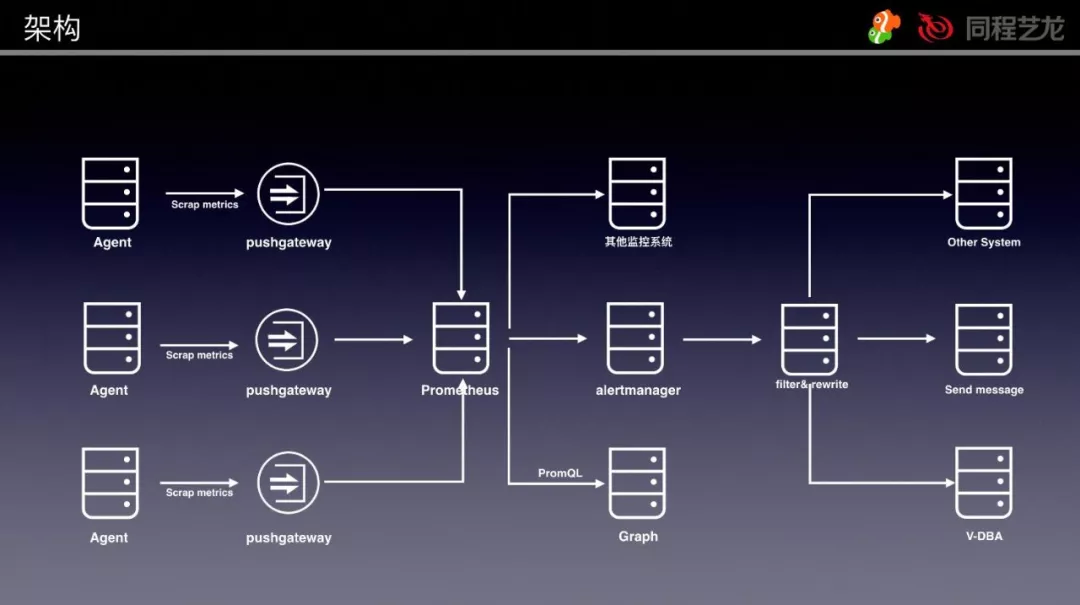
業(yè)界典型應(yīng)用

利用InfluxDB+Grafana搭建Flink on YARN作業(yè)監(jiān)控大屏
干掉ELK | 使用Prometheus+Grafana搭建監(jiān)控平臺(tái)