
利用Python繪制漂亮的專業(yè)插圖
作者|馮昱堯
https://www.zhihu.com/question/21664179/answer/18928725
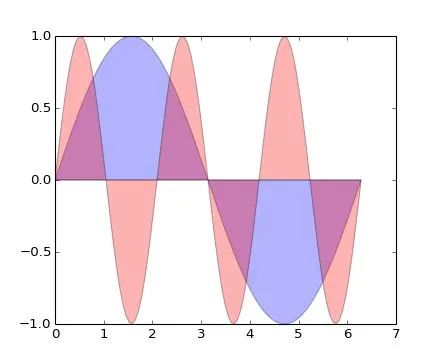
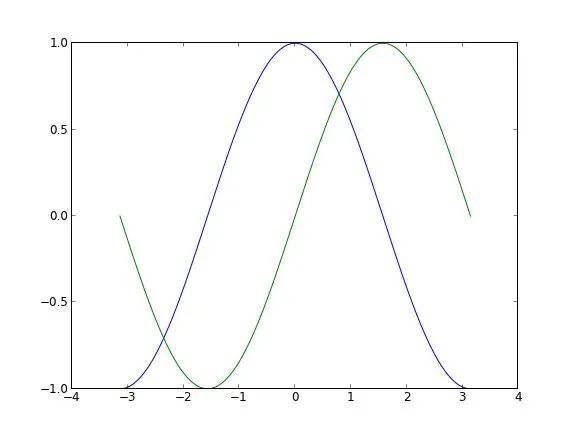
plt.fill(x, y1, 'b', x, y2, 'r', alpha=0.3)以及這種 Scatter 圖(中文不知道該怎么說…):
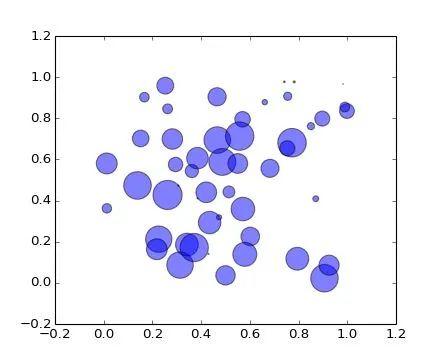
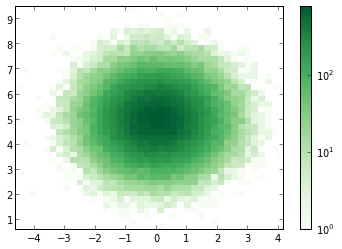
plt.scatter(x, y, s=area, alpha=0.5)
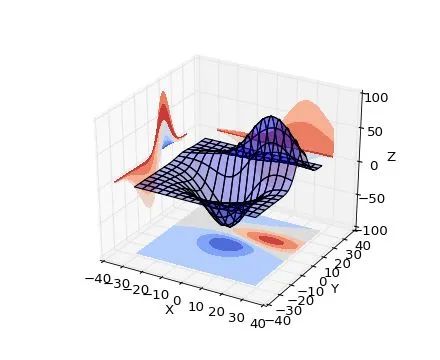
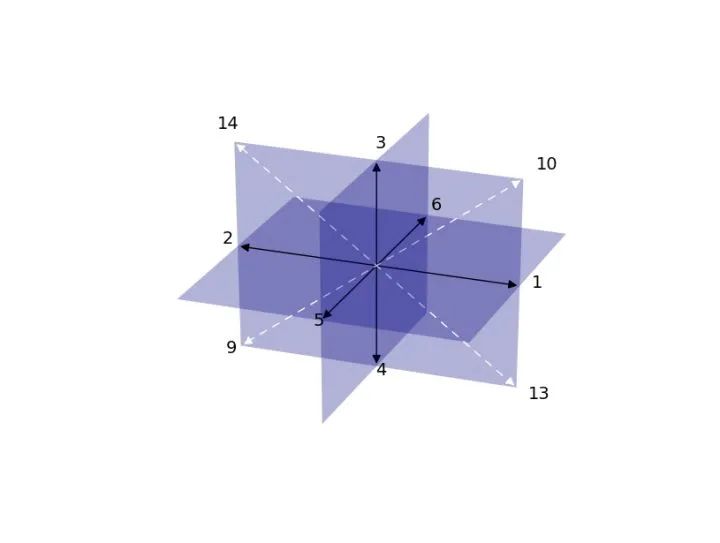
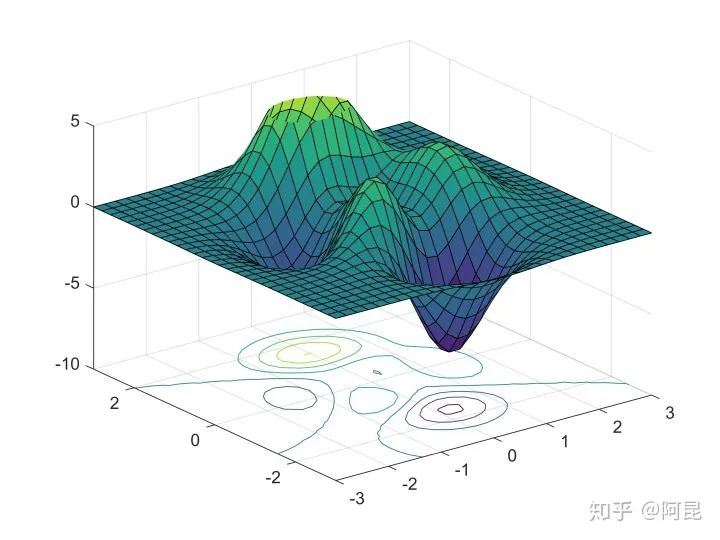
ax.plot_surface(X, Y, Z, rstride=8, cstride=8, alpha=0.3)cset = ax.contourf(X, Y, Z, zdir='z', offset=-100, cmap=cm.coolwarm)cset = ax.contourf(X, Y, Z, zdir='x', offset=-40, cmap=cm.coolwarm)cset = ax.contourf(X, Y, Z, zdir='y', offset=40, cmap=cm.coolwarm)
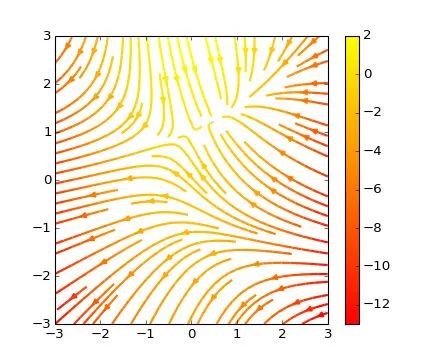
plt.streamplot(X, Y, U, V, color=U, linewidth=2, cmap=plt.cm.autumn)plt.colorbar()
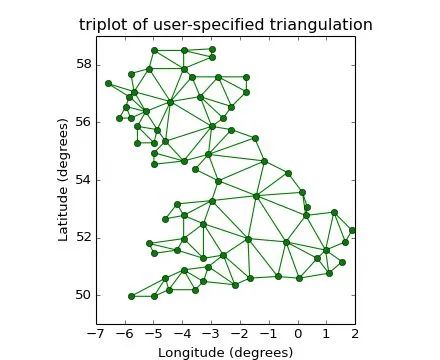
plt.triplot(x, y, triangles, 'go-')plt.title('triplot of user-specified triangulation')plt.xlabel('Longitude (degrees)')plt.ylabel('Latitude (degrees)')
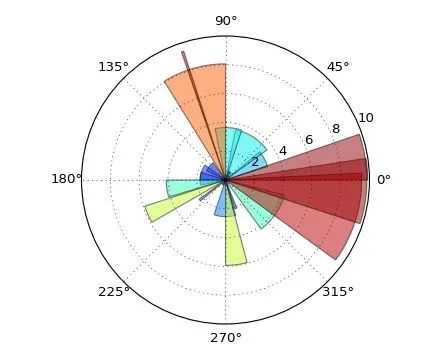
ax = plt.subplot(111, polar=True)bars = ax.bar(theta, radii, width=width, bottom=0.0)
簡直就是神器啊,有木有!

此外還有一些致力于美化繪圖的庫,用起來也都非常方便,比如olgabot/prettyplotlib 。
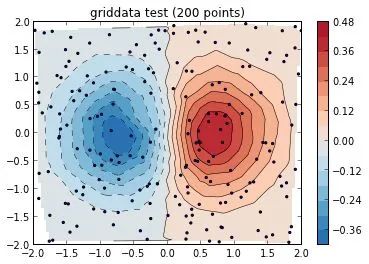
有人可能會說需要復(fù)雜的設(shè)置,其實(shí)也不用。比如上邊這幅圖,只需要多加一個(gè)參數(shù)就好:
cmap=brewer2mpl.get_map('RdBu', 'diverging', 8, reverse=True).mpl_colormap,
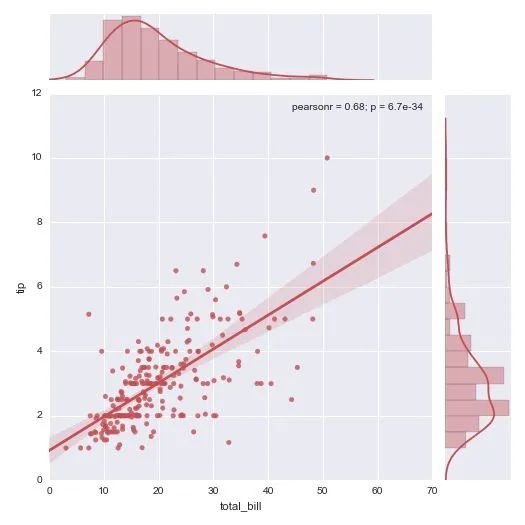
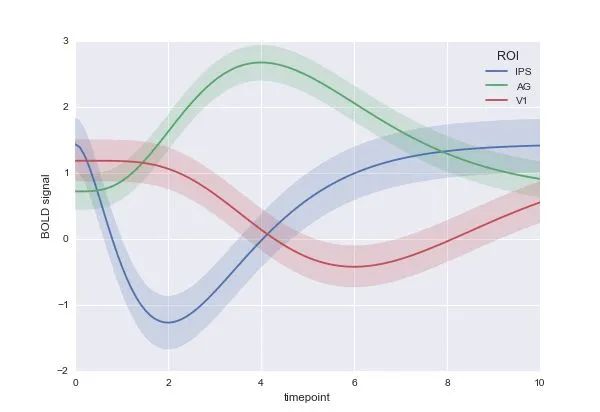
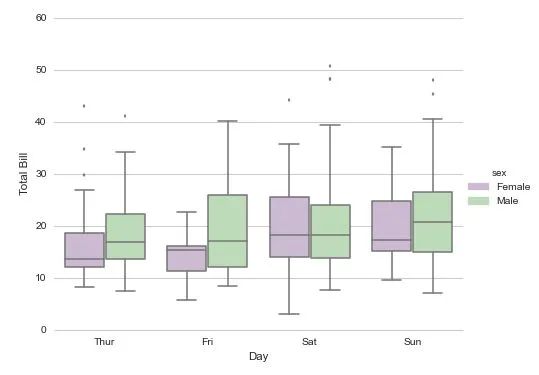
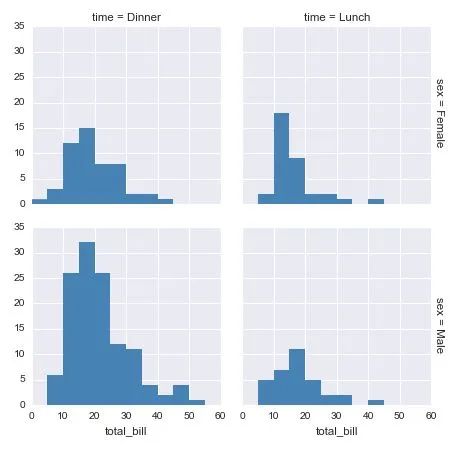
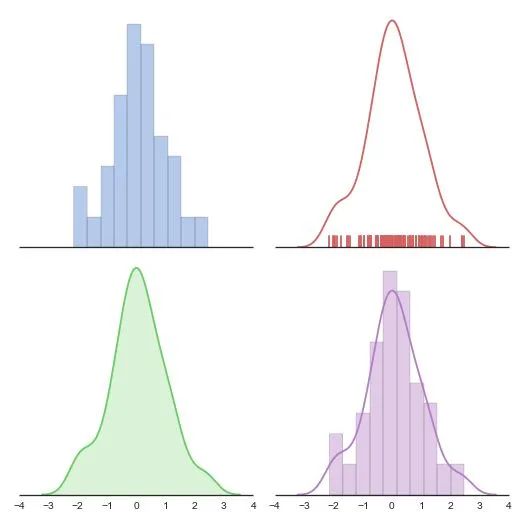
樓下說到統(tǒng)計(jì)繪圖。嘛seaborn 是一個(gè)調(diào)用 matplotlib 的統(tǒng)計(jì)繪圖庫,上圖:
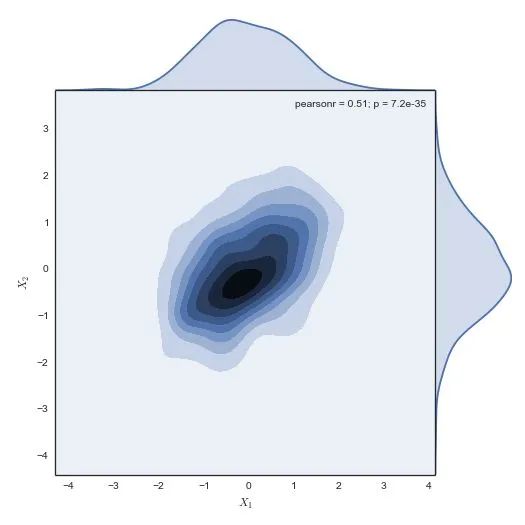
g = sns.jointplot(x1, x2, kind="kde", size=7, space=0)
方法二
作者|阿昆
https://www.zhihu.com/question/21664179/answer/1182984311


Pierre Morel [1] 結(jié)合ggplot2,開發(fā)了gramm工具,用于繪制復(fù)雜圖形。
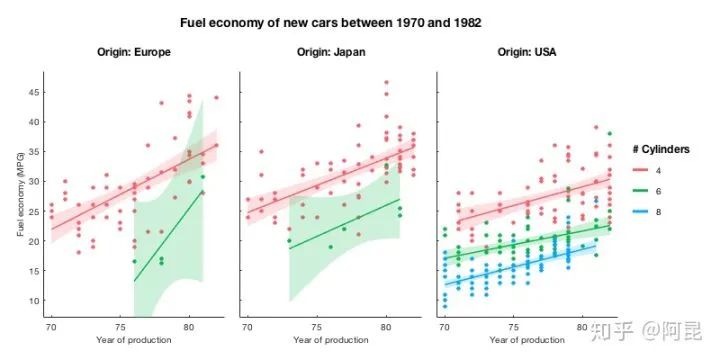
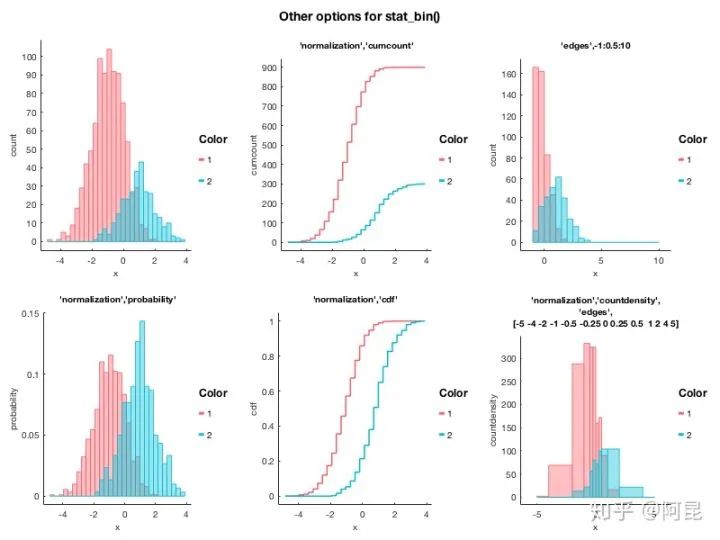
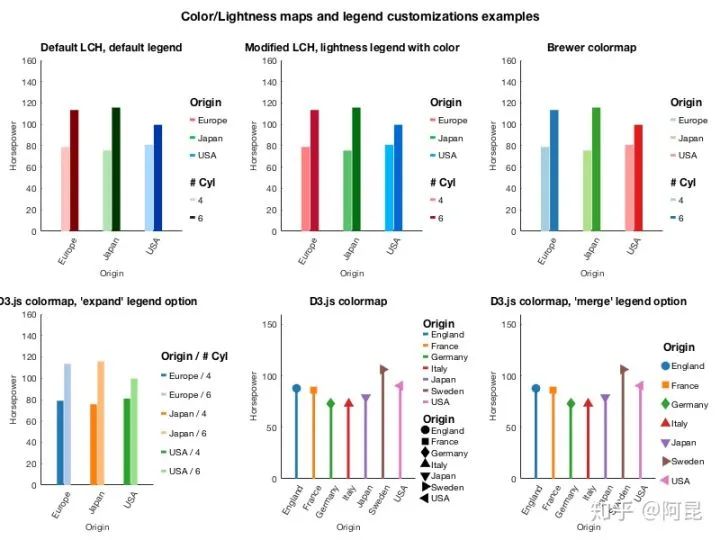
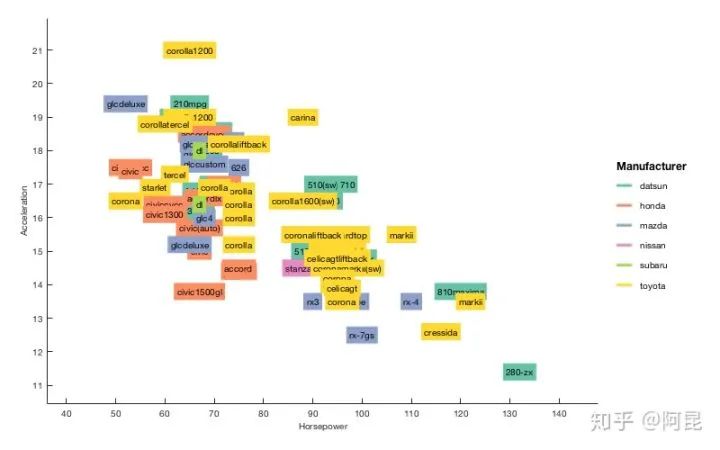
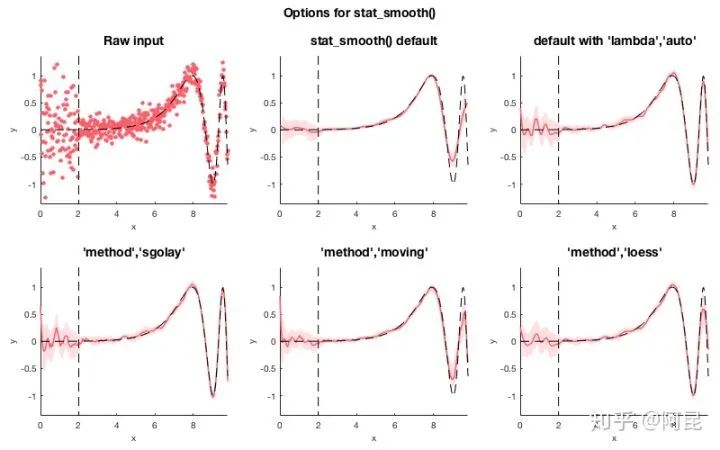
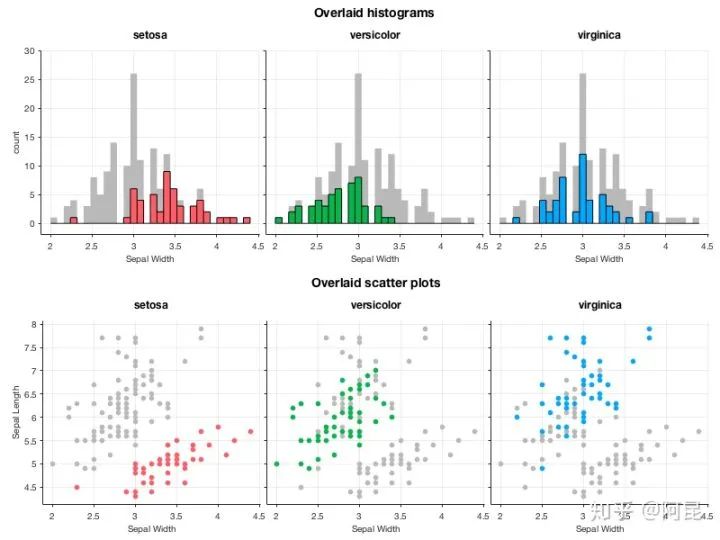
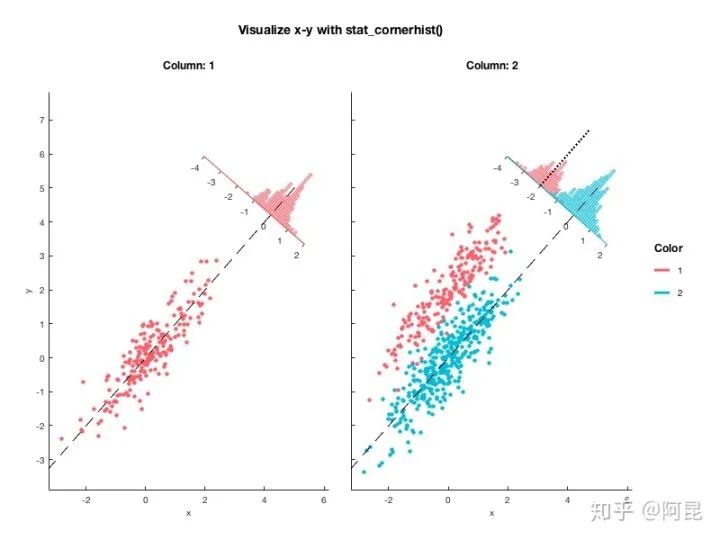
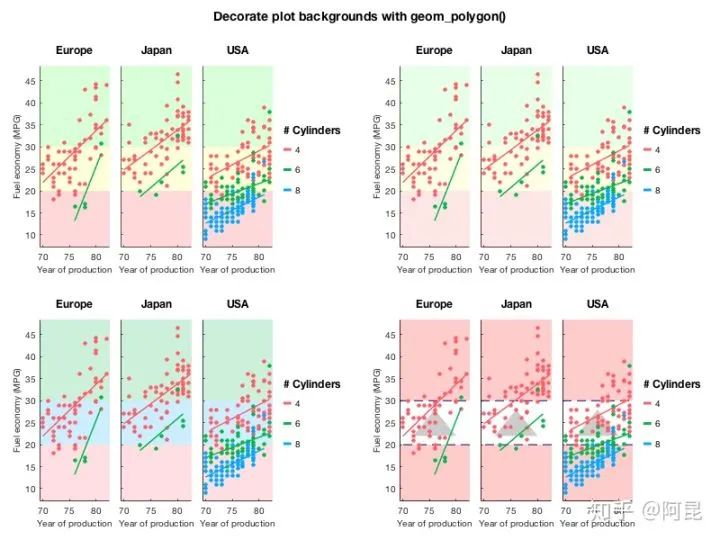
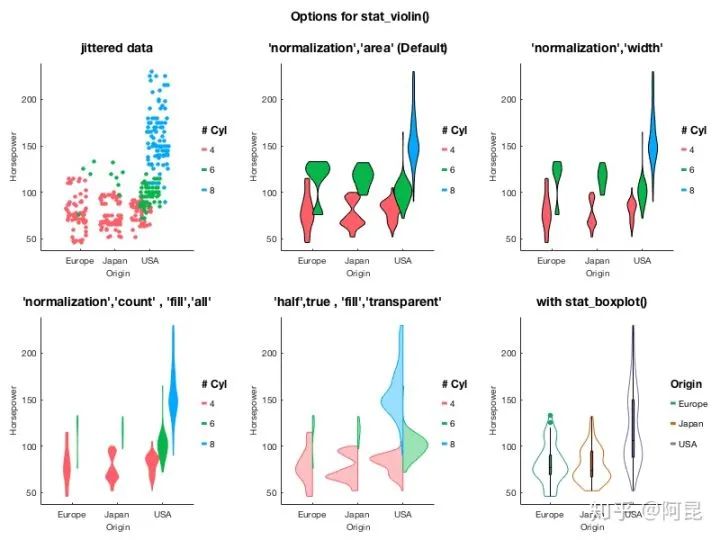
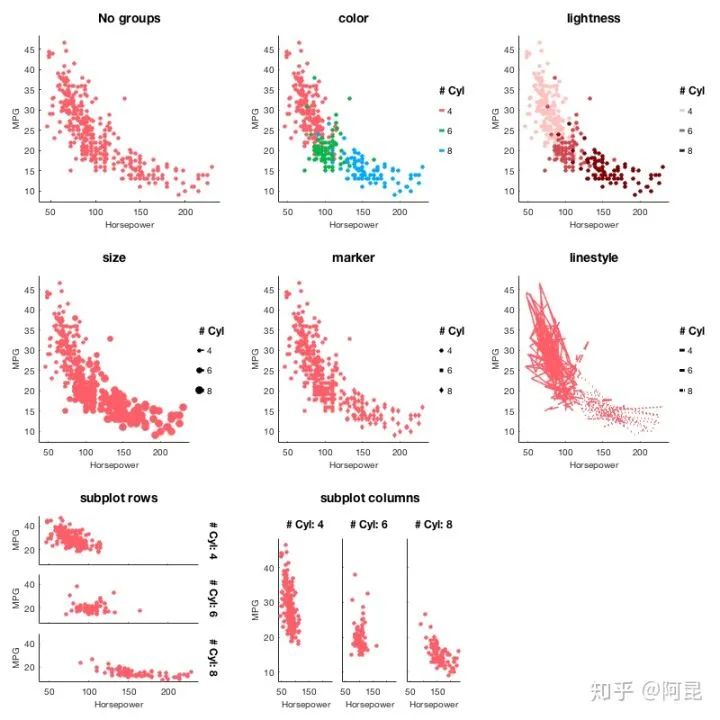
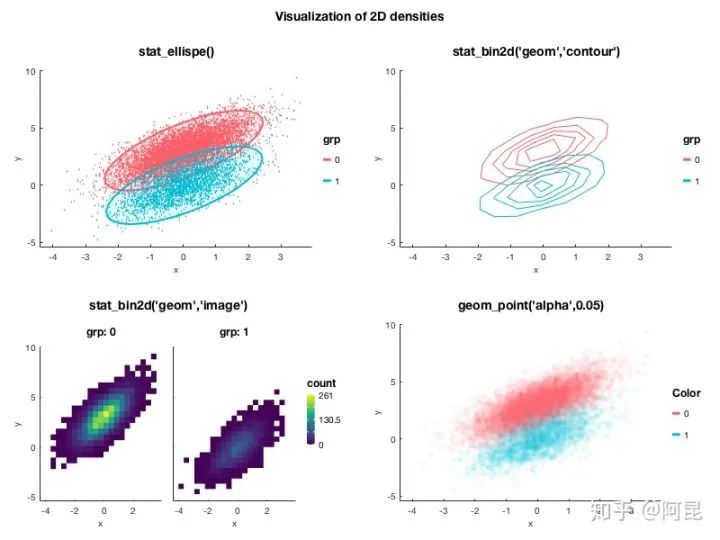
Morel P . Gramm: grammar of graphics plotting in Matlab.
Cobeldick S . MatPlotLib Perceptually Uniform Colormaps.


評論
圖片
表情