JVM性能調(diào)優(yōu)命令之jstack
點(diǎn)擊上方藍(lán)色字體,選擇“標(biāo)星公眾號(hào)”
優(yōu)質(zhì)文章,第一時(shí)間送達(dá)
作者 | 塵世風(fēng)
來源 | urlify.cn/3MN3Qn
jstack是java虛擬機(jī)自帶的一種線程堆棧跟蹤工具。
/opt/java8/bin/jstack

Usage:
    jstack [-l] <pid>
        (to connect to running process)   #連接活動(dòng)線程
    jstack -F [-m] [-l] <pid>
        (to connect to a hung process)    #連接阻塞線程
    jstack [-m] [-l] <executable> <core>
        (to connect to a core file)       #連接dump的文件
    jstack [-m] [-l] [server_id@]<remote server IP or hostname>
        (to connect to a remote debug server)     #連接遠(yuǎn)程服務(wù)器

Options:
    -F  to force a thread dump. Use when jstack <pid> does not respond (process is hung)
    -m  to print both java and native frames (mixed mode)
    -l  long listing. Prints additional information about locks
    -h or -help to print this help message
$ jstack 5611
2021-06-06 22:05:43
Full thread dump Java HotSpot(TM) Client VM (25.271-b09 mixed mode):

"RemoteInvocationHandler [#2]" #63304 daemon prio=5 os_prio=0 tid=0xe3f4bc00 nid=0x240 in Object.wait() [0xe3b3e000]
   java.lang.Thread.State: TIMED_WAITING (on object monitor)
 at java.lang.Object.wait(Native Method)
 at java.lang.ref.ReferenceQueue.remove(ReferenceQueue.java:144)
 - locked <0xea7480c8> (a java.lang.ref.ReferenceQueue$Lock)
 at hudson.remoting.RemoteInvocationHandler$Unexporter.run(RemoteInvocationHandler.java:603)
 at java.util.concurrent.Executors$RunnableAdapter.call(Executors.java:511)
 at java.util.concurrent.FutureTask.run(FutureTask.java:266)
 at hudson.remoting.AtmostOneThreadExecutor$Worker.run(AtmostOneThreadExecutor.java:118)
 at java.lang.Thread.run(Thread.java:748)

"Attach Listener" #63199 daemon prio=9 os_prio=0 tid=0xe2a52800 nid=0x7938 waiting on condition [0x00000000]
   java.lang.Thread.State: RUNNABLE

"Ping thread for channel hudson.remoting.Channel@4afd8d:channel" #24 daemon prio=5 os_prio=0 tid=0xe4637000 nid=0x1617 waiting on condition [0xe34b9000]
   java.lang.Thread.State: TIMED_WAITING (sleeping)
 at java.lang.Thread.sleep(Native Method)
 at hudson.remoting.PingThread.run(PingThread.java:95)

"Channel reader thread: channel" #9 prio=5 os_prio=0 tid=0xe3f50800 nid=0x15fa runnable [0xe3aed000]
   java.lang.Thread.State: RUNNABLE
 at java.io.FileInputStream.readBytes(Native Method)
 at java.io.FileInputStream.read(FileInputStream.java:255)
 at java.io.BufferedInputStream.fill(BufferedInputStream.java:246)
 at java.io.BufferedInputStream.read(BufferedInputStream.java:265)
 - locked <0xea4b13b0> (a java.io.BufferedInputStream)
 at hudson.remoting.FlightRecorderInputStream.read(FlightRecorderInputStream.java:92)
 at hudson.remoting.ChunkedInputStream.readHeader(ChunkedInputStream.java:72)
 at hudson.remoting.ChunkedInputStream.readUntilBreak(ChunkedInputStream.java:103)
 at hudson.remoting.ChunkedCommandTransport.readBlock(ChunkedCommandTransport.java:39)
 at hudson.remoting.AbstractSynchronousByteArrayCommandTransport.read(AbstractSynchronousByteArrayCommandTransport.java:34)
 at hudson.remoting.SynchronousCommandTransport$ReaderThread.run(SynchronousCommandTransport.java:63)

"Service Thread" #6 daemon prio=9 os_prio=0 tid=0xf7085400 nid=0x15f2 runnable [0x00000000]
   java.lang.Thread.State: RUNNABLE

"C1 CompilerThread0" #5 daemon prio=9 os_prio=0 tid=0xf7082000 nid=0x15f1 waiting on condition [0x00000000]
   java.lang.Thread.State: RUNNABLE

"Signal Dispatcher" #4 daemon prio=9 os_prio=0 tid=0xf7080800 nid=0x15f0 runnable [0x00000000]
   java.lang.Thread.State: RUNNABLE

"Finalizer" #3 daemon prio=8 os_prio=0 tid=0xf7066400 nid=0x15ef in Object.wait() [0xe45ad000]
   java.lang.Thread.State: WAITING (on object monitor)
 at java.lang.Object.wait(Native Method)
 at java.lang.ref.ReferenceQueue.remove(ReferenceQueue.java:144)
 - locked <0xea486e40> (a java.lang.ref.ReferenceQueue$Lock)
 at java.lang.ref.ReferenceQueue.remove(ReferenceQueue.java:165)
 at java.lang.ref.Finalizer$FinalizerThread.run(Finalizer.java:216)

"Reference Handler" #2 daemon prio=10 os_prio=0 tid=0xf7063800 nid=0x15ee in Object.wait() [0xe45fe000]
   java.lang.Thread.State: WAITING (on object monitor)
 at java.lang.Object.wait(Native Method)
 at java.lang.Object.wait(Object.java:502)
 at java.lang.ref.Reference.tryHandlePending(Reference.java:191)
 - locked <0xea486fe0> (a java.lang.ref.Reference$Lock)
 at java.lang.ref.Reference$ReferenceHandler.run(Reference.java:153)

"main" #1 prio=5 os_prio=0 tid=0xf7007400 nid=0x15ec in Object.wait() [0xf717d000]
   java.lang.Thread.State: TIMED_WAITING (on object monitor)
 at java.lang.Object.wait(Native Method)
 at hudson.remoting.Channel.join(Channel.java:1187)
 - locked <0xea747e30> (a hudson.remoting.Channel)
 at hudson.remoting.Launcher.main(Launcher.java:796)
 at hudson.remoting.Launcher.runWithStdinStdout(Launcher.java:718)
 at hudson.remoting.Launcher.run(Launcher.java:398)
 at hudson.remoting.Launcher.main(Launcher.java:298)

"VM Thread" os_prio=0 tid=0xf705e000 nid=0x15ed runnable

"VM Periodic Task Thread" os_prio=0 tid=0xf7087800 nid=0x15f3 waiting on condition

JNI global references: 268
線程狀態(tài)圖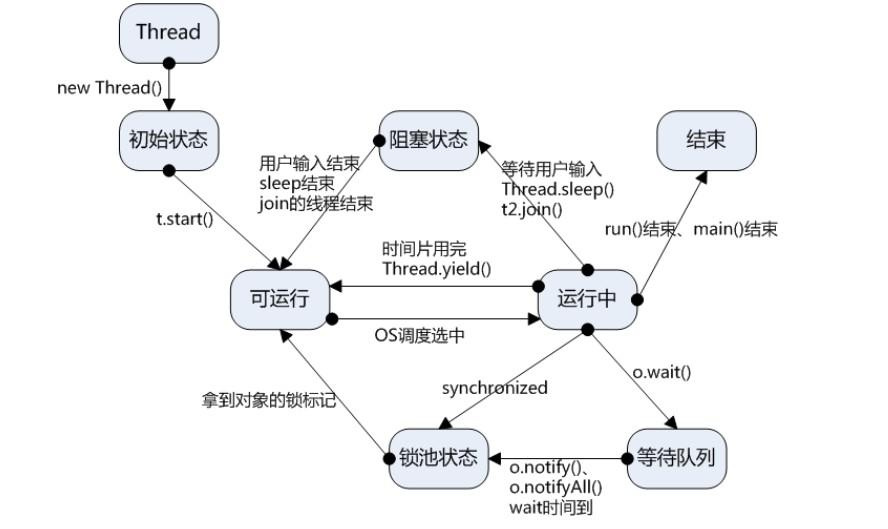
jstack統(tǒng)計(jì)線程數(shù):
jstack 5611 | grep 'java.lang.Thread.State' | wc -l
舉例說明CPU高獲取其線程ID然后分析
以我們最近出現(xiàn)的一個(gè)實(shí)際故障為例,介紹怎么定位和解決這類問題。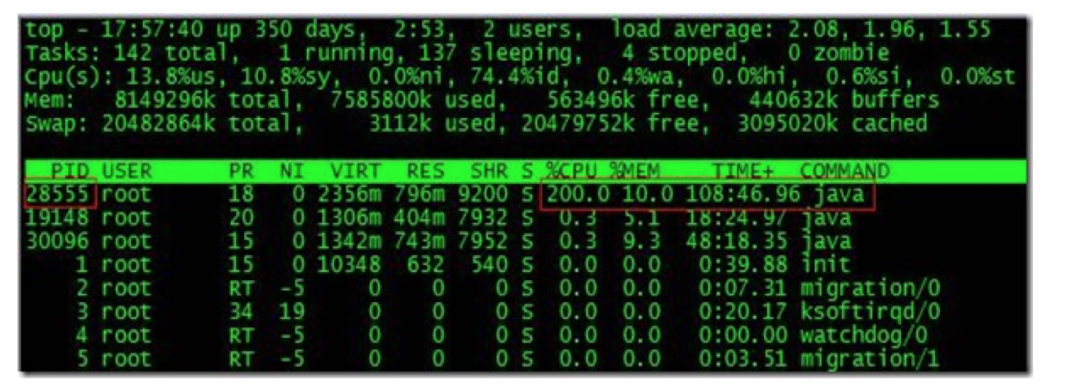
根據(jù)top命令,發(fā)現(xiàn)PID為28555的Java進(jìn)程占用CPU高達(dá)200%,出現(xiàn)故障。
通過ps aux | grep PID命令,可以進(jìn)一步確定是tomcat進(jìn)程出現(xiàn)了問題。但是,怎么定位到具體線程或者代碼呢?
首先顯示線程列表:
ps -mp pid -o THREAD,tid,time
找到了耗時(shí)最高的線程28802,占用CPU時(shí)間快兩個(gè)小時(shí)了!
其次將需要的線程ID轉(zhuǎn)換為16進(jìn)制格式:

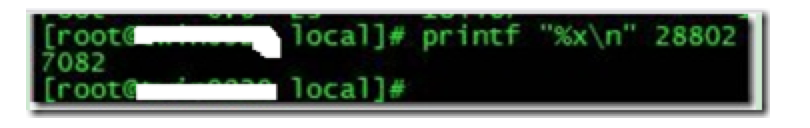
最后打印線程的堆棧信息:
jstack pid |grep tid -A 30
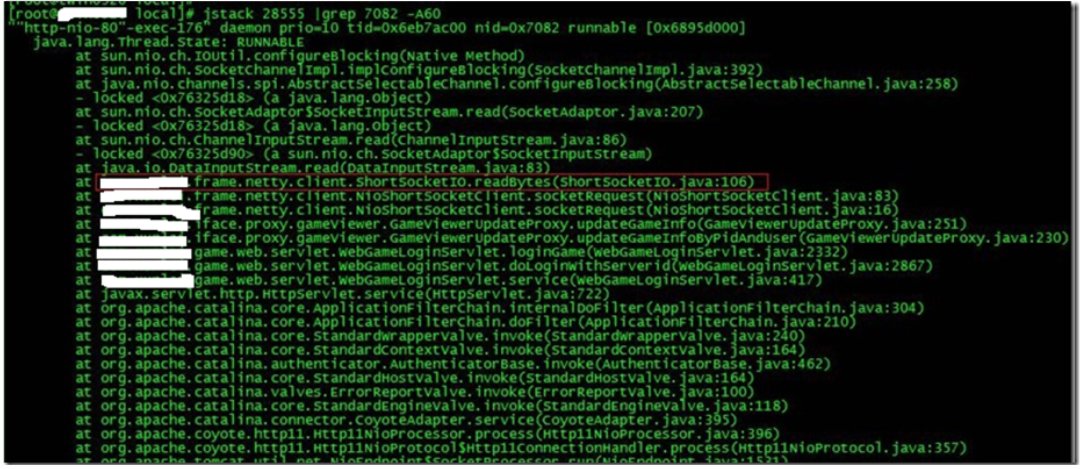
找到出現(xiàn)問題的代碼了!
現(xiàn)在來分析下具體的代碼:ShortSocketIO.readBytes(ShortSocketIO.java:106)
ShortSocketIO是應(yīng)用封裝的一個(gè)用短連接Socket通信的工具類。readBytes函數(shù)的代碼如下:
public byte[] readBytes(int length) throws IOException {
    if ((this.socket == null) || (!this.socket.isConnected())) {
        throw new IOException("++++ attempting to read from closed socket");
    }
    byte[] result = null;
    ByteArrayOutputStream bos = new ByteArrayOutputStream();
    if (this.recIndex >= length) {
           bos.write(this.recBuf, 0, length);
           byte[] newBuf = new byte[this.recBufSize];
           if (this.recIndex > length) {
               System.arraycopy(this.recBuf, length, newBuf, 0, this.recIndex - length);
           }
           this.recBuf = newBuf;
           this.recIndex -= length;
    } else {
           int totalread = length;
           if (this.recIndex > 0) {
                totalread -= this.recIndex;
                bos.write(this.recBuf, 0, this.recIndex);
                this.recBuf = new byte[this.recBufSize];
                this.recIndex = 0;
    }
    int readCount = 0;
  **  while (totalread > 0) {
         if ((readCount = this.in.read(this.recBuf)) > 0) **{
                if (totalread > readCount) {
                      bos.write(this.recBuf, 0, readCount);
                      this.recBuf = new byte[this.recBufSize];
                      this.recIndex = 0;
               } else {
                     bos.write(this.recBuf, 0, totalread);
                     byte[] newBuf = new byte[this.recBufSize];
                     System.arraycopy(this.recBuf, totalread, newBuf, 0, readCount - totalread);
                     this.recBuf = newBuf;
                     this.recIndex = (readCount - totalread);
             }
             totalread -= readCount;
        }
   }
}
問題就出在加粗的代碼部分。如果this.in.read()返回的數(shù)據(jù)小于等于0時(shí),循環(huán)就一直進(jìn)行下去了。而這種情況在網(wǎng)絡(luò)擁塞的時(shí)候是可能發(fā)生的。
至于具體怎么修改就看業(yè)務(wù)邏輯應(yīng)該怎么對(duì)待這種特殊情況了。
最后,總結(jié)下排查CPU故障的方法和技巧有哪些:
1、top命令:Linux命令。可以查看實(shí)時(shí)的CPU使用情況。也可以查看最近一段時(shí)間的CPU使用情況。
2、PS命令:Linux命令。強(qiáng)大的進(jìn)程狀態(tài)監(jiān)控命令。可以查看進(jìn)程以及進(jìn)程中線程的當(dāng)前CPU使用情況。屬于當(dāng)前狀態(tài)的采樣數(shù)據(jù)。
3、jstack:Java提供的命令。可以查看某個(gè)進(jìn)程的當(dāng)前線程棧運(yùn)行情況。根據(jù)這個(gè)命令的輸出可以定位某個(gè)進(jìn)程的所有線程的當(dāng)前運(yùn)行狀態(tài)、運(yùn)行代碼,以及是否死鎖等等。
4、pstack:Linux命令。可以查看某個(gè)進(jìn)程的當(dāng)前線程棧運(yùn)行情況。
Java 系統(tǒng)性能分析 命令
cpu分析
top , pidstat(sysstat)
pid -p PID -t 1 10
vmstat 1 CPU上下文切換、運(yùn)行隊(duì)列、利用率
ps Hh -eo tid
pcpu 查看具體線程的CPU消耗
sar 來查看一定世界范圍內(nèi)以及歷史的cpu消耗情況信息
查看java線程信息
jstack pid | grep 'nid=0x9999'
cs sy消耗比較高
上下文切換性能偏高, jstack -l pid, 查看on object monitorio消耗
pidstat -d -t -p pid 1 100
iostat網(wǎng)絡(luò)io消耗
cat /proc/interruptes
sar -n FULL 1 2