
怎么給pandas.DataFrame錦上添花?
更新一下好久沒動的Python數(shù)據(jù)分析基礎(chǔ)專輯。
平日看到的pandas.DataFrame數(shù)據(jù)是這個樣子的~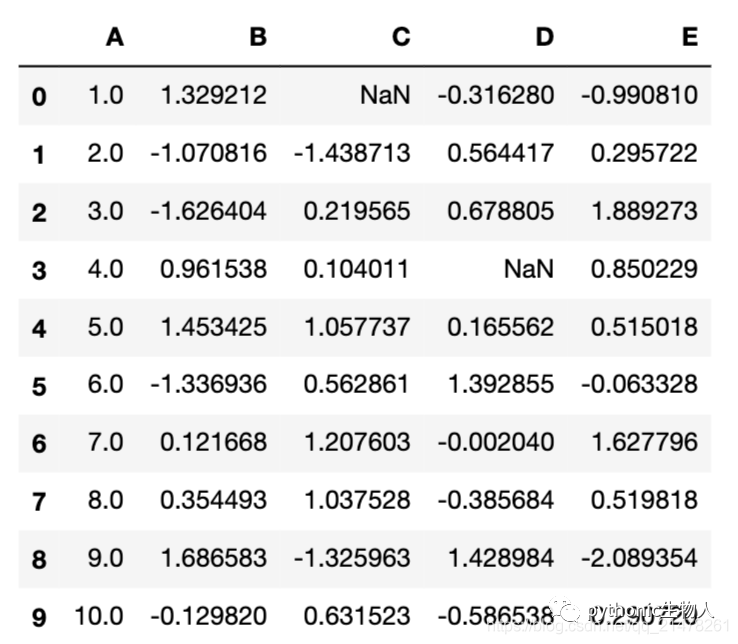 平淡無奇,索然無味,讀了本文后,可以「這樣子」了~
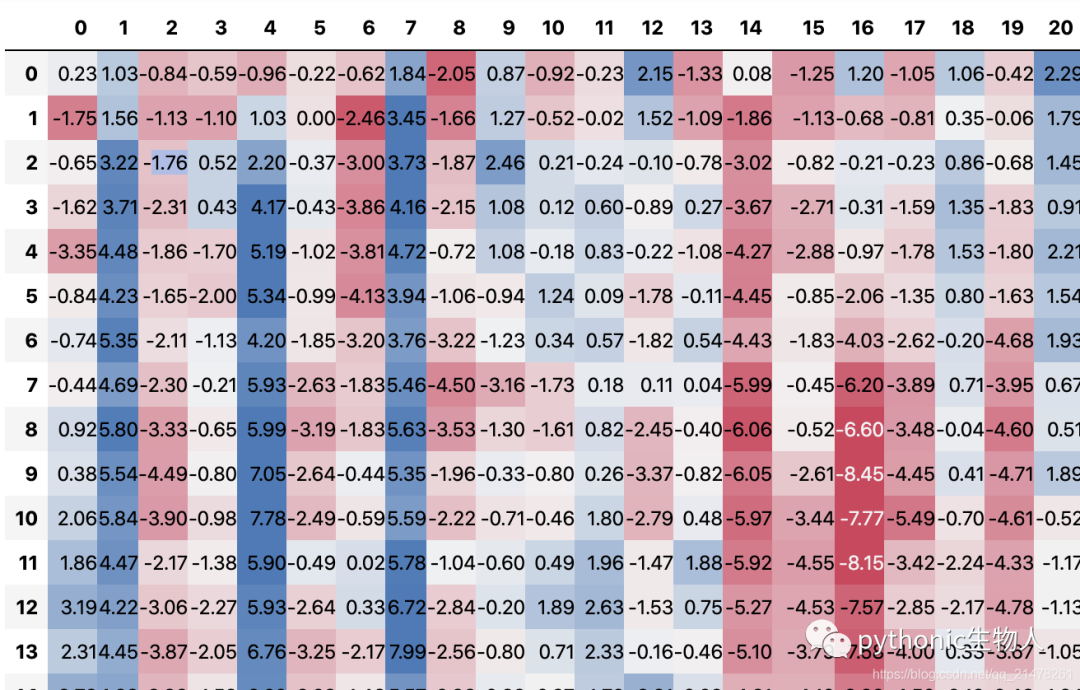 「這樣子」~
 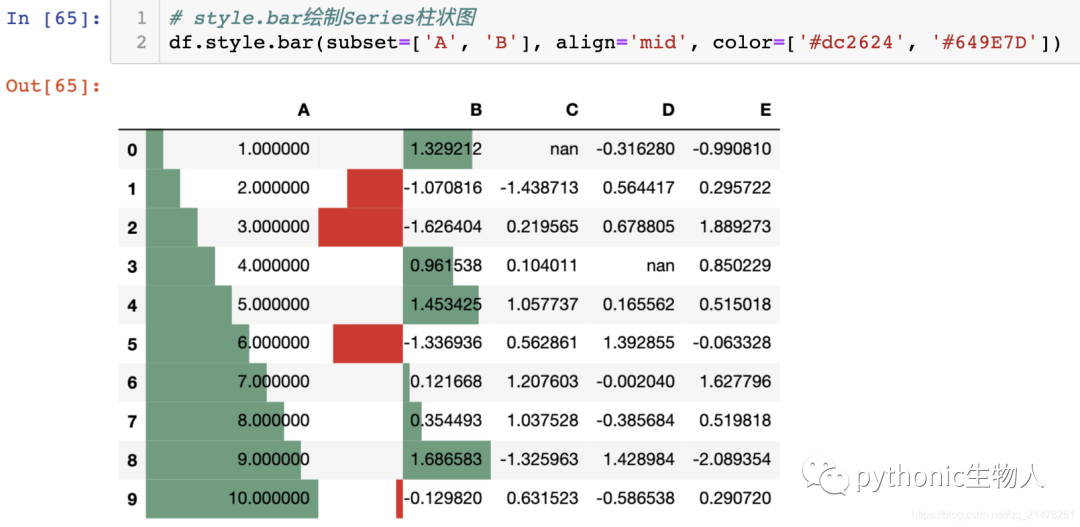 或者「這樣子」~
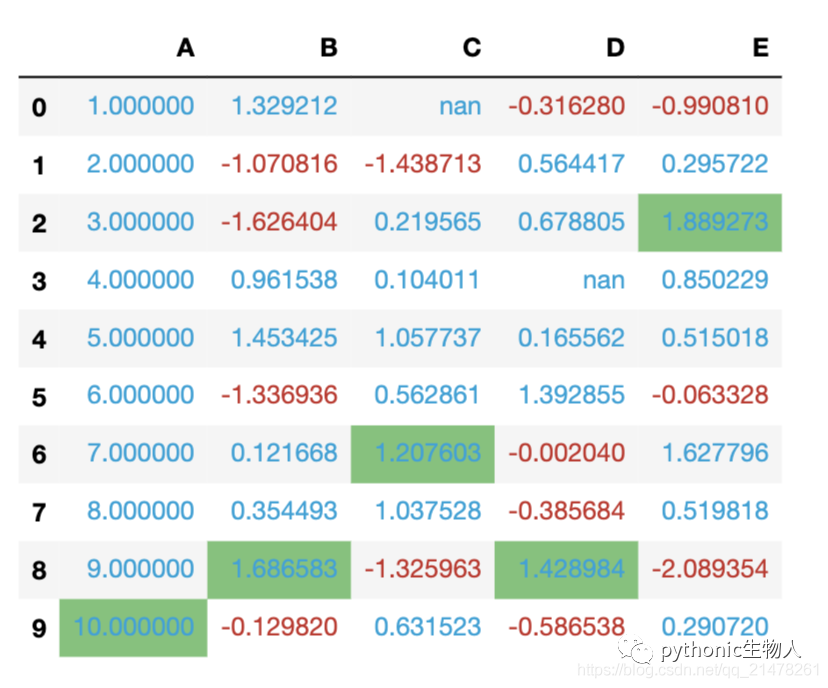
目錄
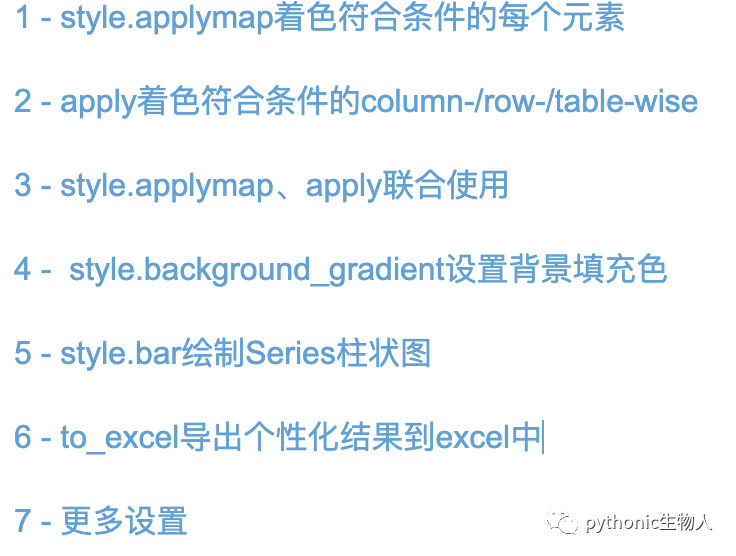
以上個性化的設(shè)置主要用到pd.DataFrame.style的如下屬性:
['apply', 'applymap', 'background_gradient', 'bar', 'caption', 'cell_ids', 'clear', 'columns', 'ctx', 'data', 'env', 'export', 'format', 'from_custom_template', 'hidden_columns', 'hidden_index', 'hide_columns', 'hide_index', 'highlight_max', 'highlight_min', 'highlight_null', 'index', 'loader', 'na_rep', 'pipe', 'precision', 'render', 'set_caption', 'set_na_rep', 'set_precision', 'set_properties', 'set_table_attributes', 'set_table_styles', 'set_uuid', 'table_attributes', 'table_styles', 'template', 'to_excel', 'use', 'uuid', 'where']
本文介紹部分~
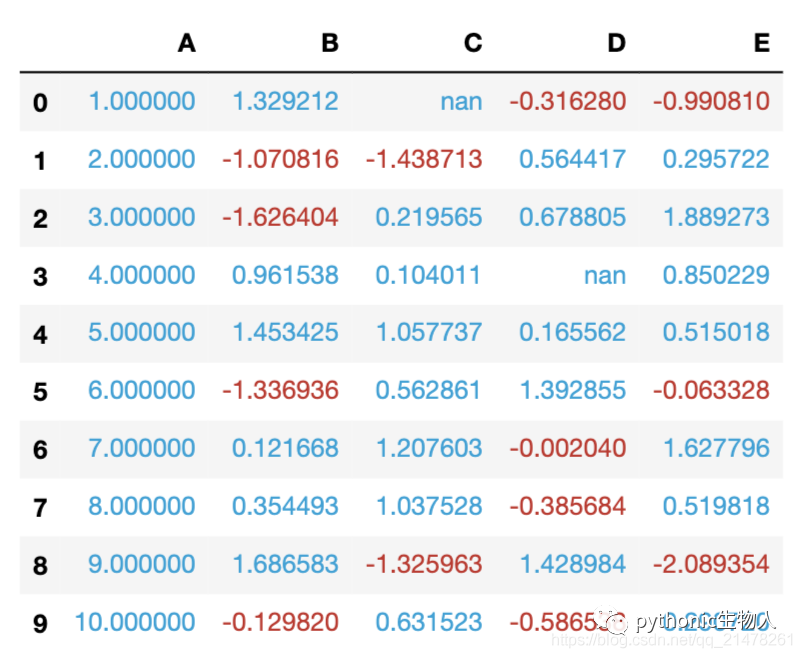
1 - style.applymap著色符合條件的每個元素
import pandas as pd
import numpy as np
np.random.seed(24)
df = pd.DataFrame({'A': np.linspace(1, 10, 10)})
df = pd.concat(
[df, pd.DataFrame(np.random.randn(10, 4), columns=list('BCDE'))], axis=1)
# 添加缺省值
df.iloc[3, 3] = np.nan
df.iloc[0, 2] = np.nan
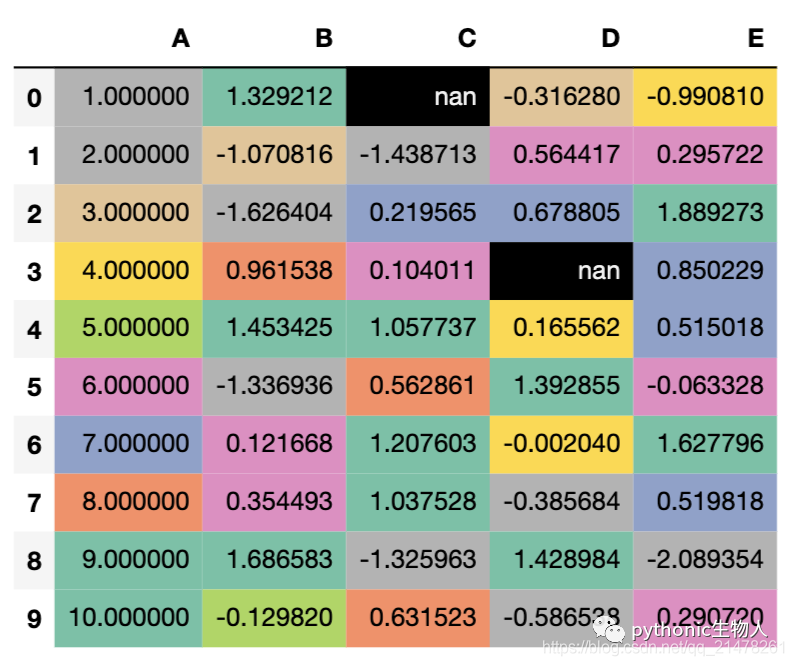
# style.applymap著色符合條件的每個元素
def color_negative_red(val):
"""
小于0的元素上紅色、反之上藍色
"""
color = '#c72e29' if val < 0 else '#01a2d9'
return 'color: %s' % color
s = df.style.applymap(color_negative_red)
s
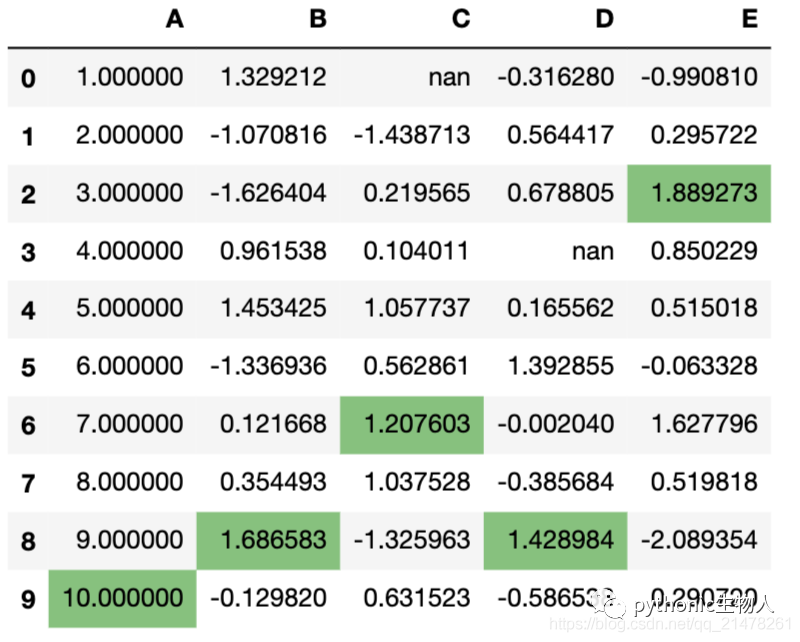
2 - apply著色符合條件的column-/row-/table-wise
def highlight_max(s):
    '''
    對DataFrame的Seris中最大值上綠色
    '''
    is_max = s == s.max()
    return ['background-color: #74C476' if v else '' for v in is_max]

df.style.apply(highlight_max)
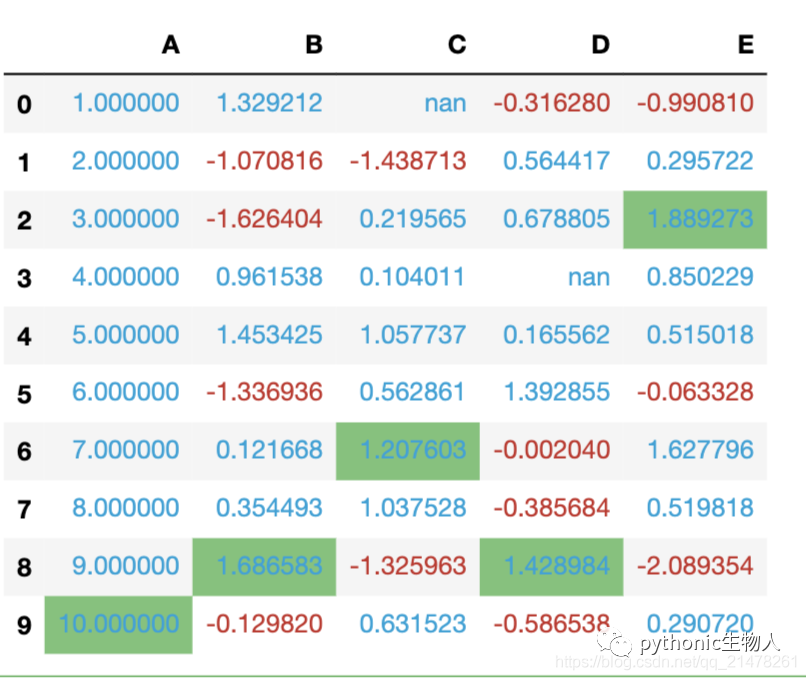
3 - style.applymap、apply聯(lián)合使用
#.號連接即可
df.style.\
    applymap(color_negative_red).\
    apply(highlight_max)
4 - style.background_gradient設(shè)置背景填充色
import seaborn as sns

s = df.style.background_gradient(cmap='Set2_r')
s
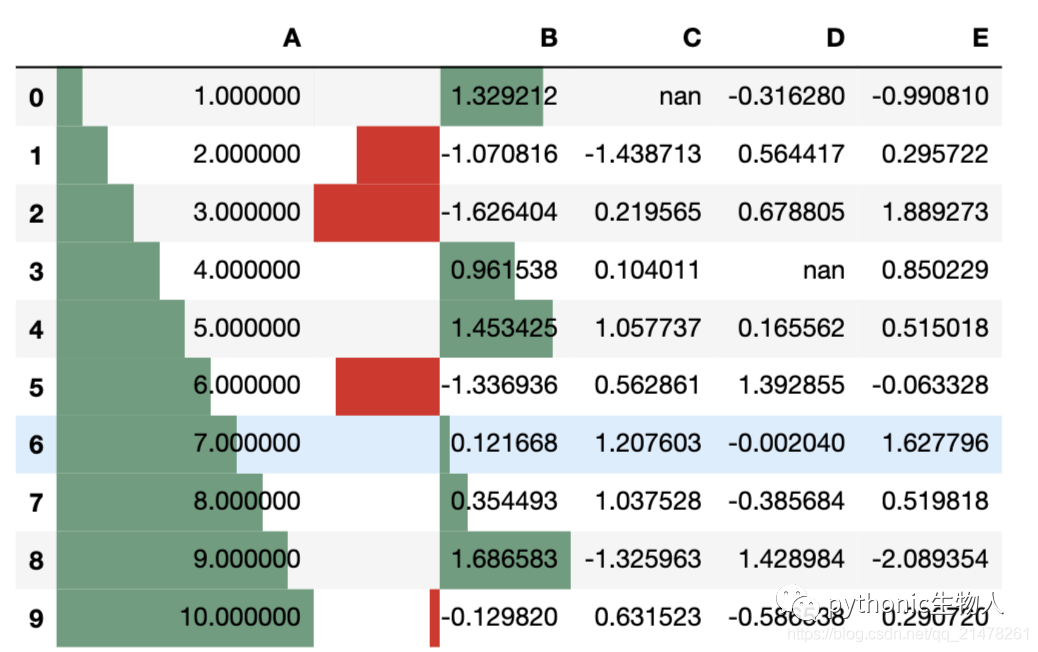
5 - style.bar繪制Series柱狀圖
df.style.bar(subset=['A', 'B'], align='mid', color=['#dc2624', '#649E7D'])
import pandas as pd
from IPython.display import HTML
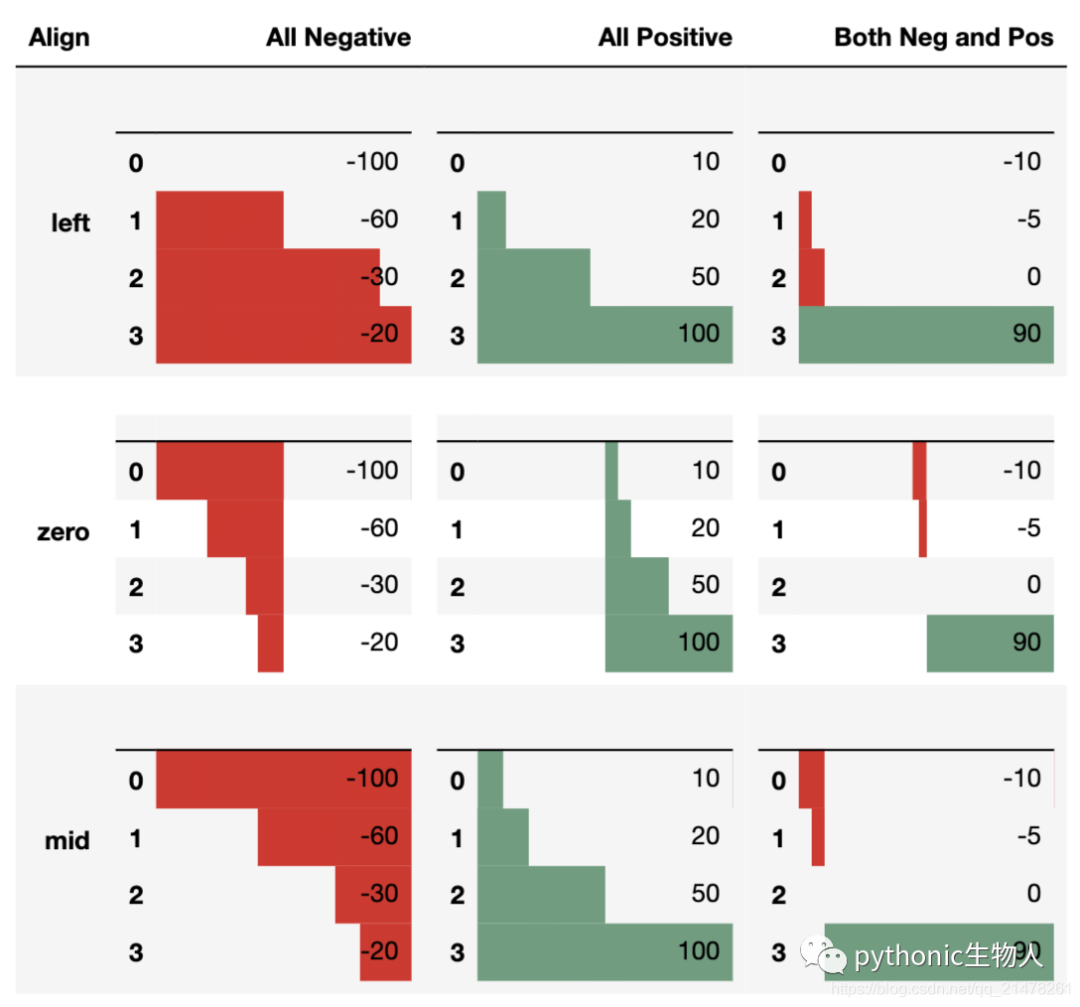
# Test series
test1 = pd.Series([-100, -60, -30, -20], name='All Negative')
test2 = pd.Series([10, 20, 50, 100], name='All Positive')
test3 = pd.Series([-10, -5, 0, 90], name='Both Pos and Neg')
head = """
<table>
<thead>
<th>Align</th>
<th>All Negative</th>
<th>All Positive</th>
<th>Both Neg and Pos</th>
</thead>
</tbody>
"""
aligns = ['left', 'zero', 'mid']
for align in aligns:
row = "<tr><th>{}</th>".format(align)
for series in [test1, test2, test3]:
s = series.copy()
s.name = ''
row += "<td>{}</td>".format(
s.to_frame().style.bar(align=align,
color=['#dc2624', '#649E7D'],
width=100).render()) #testn['width']
row += '</tr>'
head += row
head += """
</tbody>
</table>"""
HTML(head)
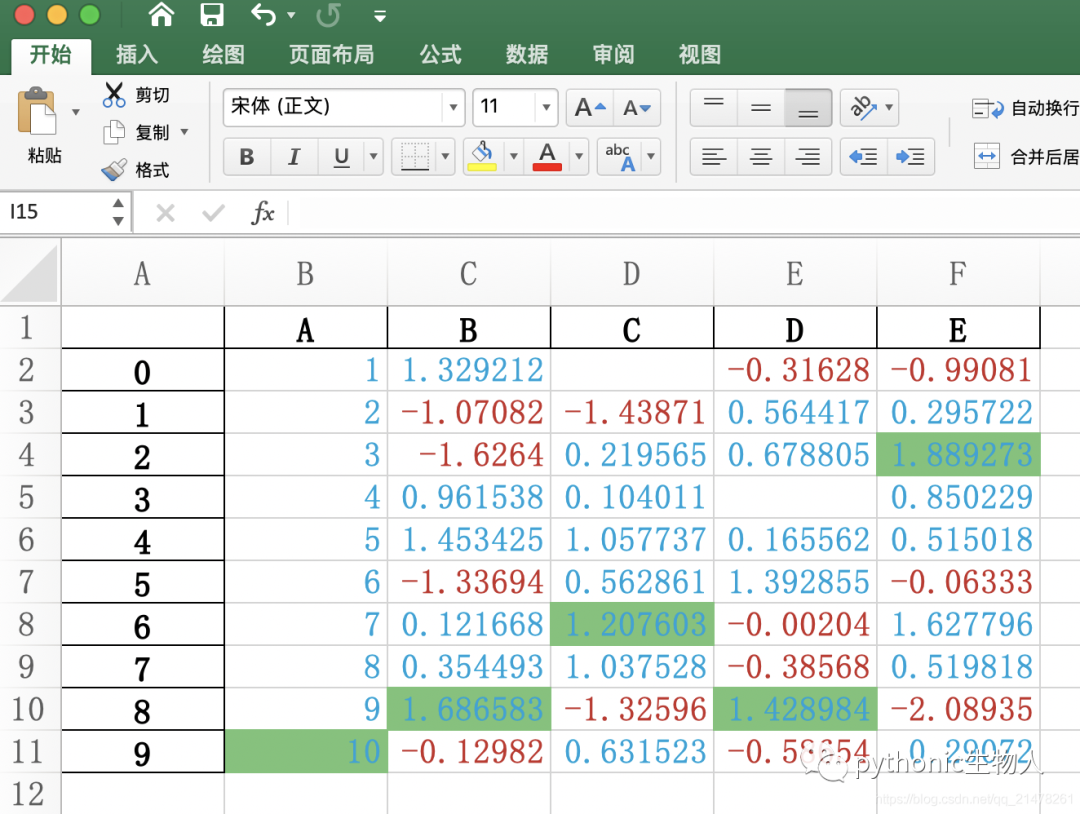
6 - to_excel導(dǎo)出個性化結(jié)果到excel中
df.style.\
    applymap(color_negative_red).\
    apply(highlight_max).\
    to_excel('styled.xlsx', engine='openpyxl')
7 - 更多設(shè)置
https://pandas.pydata.org/pandas-docs/stable/user_guide/style.html

相關(guān)閱讀: