
SkyWalking鏈路追蹤系統(tǒng)-告警篇
目錄
1、概述
2、告警規(guī)則
2.1 默認(rèn)告警規(guī)則
2.2 告警規(guī)則詳解
3、自定義告警規(guī)則
4、測試告警
1、概述
Skywalking發(fā)送告警的基本原理是每隔一段時(shí)間輪詢skywalking-oap收集到的鏈路追蹤的數(shù)據(jù),再根據(jù)所配置的告警規(guī)則(如服務(wù)響應(yīng)時(shí)間、服務(wù)響應(yīng)時(shí)間百分比)等,如果達(dá)到閾值則發(fā)送響應(yīng)的告警信息。發(fā)送告警信息是以線程池異步的方式調(diào)用webhook接口完成的,具體的webhook接口可以由使用者自行定義,從而可以在指定的webhook接口中自行編寫各種告警方式,比如釘釘告警、郵件告警等等。告警的信息也可以在RocketBot即ui中查看到。
目前對應(yīng)我前面文章中部署的8.4.0版本支持的告警接口如下:
普通 webhook gRPCHook Slack Chat Hook WeChat Hook(微信告警) Dingtalk Hook(釘釘告警) Feishu Hook(飛書告警)
2、告警規(guī)則
2.1 默認(rèn)告警規(guī)則
在Skywalking中,告警規(guī)則稱為rule,默認(rèn)安裝的Skywalking oap server組件中包含了告警規(guī)則的配置文件,位于安裝目錄下con?g文件夾下alarm-settings.yml文件中,在容器中運(yùn)行的也是一樣的
# kubectl -n monitoring exec -it skywalking-oap-57d7f454f5-w4k4j -- bash
bash-5.0# pwd
/skywalking
bash-5.0# cat config/alarm-settings.yml
以下是默認(rèn)的告警規(guī)則配置文件內(nèi)容
rules:
  # Rule unique name, must be ended with `_rule`.
  service_resp_time_rule:
    metrics-name: service_resp_time
    op: ">"
    threshold: 1000
    period: 10
    count: 3
    silence-period: 5
    message: Response time of service {name} is more than 1000ms in 3 minutes of last 10 minutes.
  service_sla_rule:
    # Metrics value need to be long, double or int
    metrics-name: service_sla
    op: "<"
    threshold: 8000
    # The length of time to evaluate the metrics
    period: 10
    # How many times after the metrics match the condition, will trigger alarm
    count: 2
    # How many times of checks, the alarm keeps silence after alarm triggered, default as same as period.
    silence-period: 3
    message: Successful rate of service {name} is lower than 80% in 2 minutes of last 10 minutes
  service_resp_time_percentile_rule:
    # Metrics value need to be long, double or int
    metrics-name: service_percentile
    op: ">"
    threshold: 1000,1000,1000,1000,1000
    period: 10
    count: 3
    silence-period: 5
    message: Percentile response time of service {name} alarm in 3 minutes of last 10 minutes, due to more than one condition of p50 > 1000, p75 > 1000, p90 > 1000, p95 > 1000, p99 > 1000
  service_instance_resp_time_rule:
    metrics-name: service_instance_resp_time
    op: ">"
    threshold: 1000
    period: 10
    count: 2
    silence-period: 5
    message: Response time of service instance {name} is more than 1000ms in 2 minutes of last 10 minutes
  database_access_resp_time_rule:
    metrics-name: database_access_resp_time
    threshold: 1000
    op: ">"
    period: 10
    count: 2
    message: Response time of database access {name} is more than 1000ms in 2 minutes of last 10 minutes
  endpoint_relation_resp_time_rule:
    metrics-name: endpoint_relation_resp_time
    threshold: 1000
    op: ">"
    period: 10
    count: 2
    message: Response time of endpoint relation {name} is more than 1000ms in 2 minutes of last 10 minutes
#  Active endpoint related metrics alarm will cost more memory than service and service instance metrics alarm.
#  Because the number of endpoint is much more than service and instance.
#
#  endpoint_avg_rule:
#    metrics-name: endpoint_avg
#    op: ">"
#    threshold: 1000
#    period: 10
#    count: 2
#    silence-period: 5
#    message: Response time of endpoint {name} is more than 1000ms in 2 minutes of last 10 minutes

webhooks:
#  - http://127.0.0.1/notify/
#  - http://127.0.0.1/go-wechat/
2.2 告警規(guī)則詳解
下面取默認(rèn)的告警規(guī)則中的一條進(jìn)行分析
rules:
  # Rule unique name, must be ended with `_rule`.
  service_resp_time_rule:
    metrics-name: service_resp_time
    op: ">"
    threshold: 1000
    period: 10
    count: 3
    silence-period: 5
    message: Response time of service {name} is more than 1000ms in 3 minutes of last 10 minutes.
首先提示聲明了告警規(guī)則名稱應(yīng)該具有唯一性,且必須以 _rule 結(jié)尾,這里是service_resp_time_rule(服務(wù)響應(yīng)時(shí)間)
metrics-name:告警指標(biāo),指標(biāo)度量值為
long、double或int類型op:度量值和閾值的比較方式,這里是大于
threshold:閾值,這里是
1000,毫秒為單位period:評估度量標(biāo)準(zhǔn)的時(shí)間長度,也就是告警檢查周期,分鐘為單位
count:累計(jì)達(dá)到多少次告警值后觸發(fā)告警
silence-period:忽略相同告警信息的周期,默認(rèn)與告警檢查周期一致。簡單來說,就是在觸發(fā)告警時(shí)開始計(jì)時(shí)
N,在N+period時(shí)間內(nèi)保持沉默silence不會再次觸發(fā)告警,這和alertmanager的告警抑制類似message:告警消息主體,通過變量在發(fā)送消息時(shí)進(jìn)行自動替換
除此之外,還有以下可選(高級)規(guī)則配置:
排除或包含服務(wù)配置,默認(rèn)匹配此指標(biāo)中的所有服務(wù)
...
  service_percent_rule:
    metrics-name: service_percent
    include-names:
      - service_a
      - service_b
    exclude-names:
      - service_c
...
多種值情況的指標(biāo)閾值,例如 P50、P75、P90、P95、P99 的閾值,主要表示樣本的分布及其數(shù)量,例如
P50表示取值周期內(nèi)有50%的響應(yīng)都大于1000ms,這和 prometheus 聚合指標(biāo) quantile [1]是一樣的,如果同時(shí)寫表示都滿足時(shí)觸發(fā)例如下面的規(guī)則表示在過去
10分鐘內(nèi),由于 p50 > 1000、p75 > 1000、p90 > 1000、p95 > 1000、p99 > 1000 多個(gè)條件,服務(wù)累計(jì)3次的響應(yīng)時(shí)間百分比都大于1000ms,觸發(fā)告警...
service_resp_time_percentile_rule:
# Metrics value need to be long, double or int
metrics-name: service_percentile
op: ">"
threshold: 1000,1000,1000,1000,1000
period: 10
count: 3
silence-period: 5
message: Percentile response time of service {name} alarm in 3 minutes of last 10 minutes, due to more than one condition of p50 > 1000, p75 > 1000, p90 > 1000, p95 > 1000, p99 > 1000復(fù)合規(guī)則 composite-rules [2],針對相同實(shí)體級別而言的規(guī)則,例如服務(wù)級別的警報(bào)規(guī)則,同時(shí)滿足指定的多個(gè)規(guī)則時(shí)觸發(fā)
rules:
  endpoint_percent_rule:
    # Metrics value need to be long, double or int
    metrics-name: endpoint_percent
...
    # Specify if the rule can send notification or just as an condition of composite rule 僅作為復(fù)合規(guī)則的條件
    only-as-condition: false
  service_percent_rule:
    metrics-name: service_percent
...
    only-as-condition: false
  service_resp_time_percentile_rule:
    # Metrics value need to be long, double or int
    metrics-name: service_percentile
...
    only-as-condition: false
  meter_service_status_code_rule:
    metrics-name: meter_status_code
...
    only-as-condition: false
composite-rules:
  comp_rule:
    # Must satisfied percent rule and resp time rule
    expression: service_percent_rule && service_resp_time_percentile_rule
    message: Service {name} successful rate is less than 80% and P50 of response time is over 1000ms # 服務(wù)成功率小于80%,響應(yīng)時(shí)間大于1000ms
到這里,就能分析出上面列出的所有默認(rèn)告警規(guī)則的含義,依次為:
1 最近3分鐘內(nèi)服務(wù)平均響應(yīng)時(shí)間超過1秒
2 最近2分鐘內(nèi)服務(wù)成功率低于80%
3 最近3分鐘的服務(wù)響應(yīng)時(shí)間百分比超過1秒
4 最近2分鐘內(nèi)服務(wù)實(shí)例的平均響應(yīng)時(shí)間超過1秒
5 最近2分鐘內(nèi)數(shù)據(jù)庫訪問的平均響應(yīng)時(shí)間超過1秒
6 最近2分鐘內(nèi)端點(diǎn)平均響應(yīng)時(shí)間超過1秒
7 過去2分鐘內(nèi)端點(diǎn)關(guān)系的平均響應(yīng)時(shí)間超過1秒
  這條規(guī)則默認(rèn)沒有打開,并且提示:由于端點(diǎn)的數(shù)量遠(yuǎn)遠(yuǎn)多于服務(wù)和實(shí)例,活動端點(diǎn)相關(guān)度量告警將比服務(wù)和服務(wù)實(shí)例度量告警消耗更多內(nèi)存
3、自定義告警規(guī)則
Skywalking的配置大部分內(nèi)容是通過應(yīng)用的application.yml及系統(tǒng)的環(huán)境變量設(shè)置的,同時(shí)也支持下面系統(tǒng)的動態(tài)配置來源
gRPC 服務(wù) Zookeeper Etcd Consul Apollo Nacos k8s configmap
參考 Skywalking 動態(tài)配置說明[3],如果開啟了動態(tài)配置,可以通過鍵alarm.default.alarm-settings覆蓋掉默認(rèn)配置文件alarm-settings.yml
本文記錄的是基于k8s和helm部署的Skywalking,因此可以通過k8s-configmap進(jìn)行自定義配置的注入,最終在Skywalking配置文件中的實(shí)現(xiàn)如下,此文件中有很多變量,通過分析chart,發(fā)現(xiàn)已經(jīng)寫好邏輯會根據(jù)是否啟用動態(tài)配置來自動注入所有變量,所以就無需在value.yaml中聲明了
cluster:
  selector: ${SW_CLUSTER:standalone}
...
  kubernetes:
    namespace: ${SW_CLUSTER_K8S_NAMESPACE:default}
    labelSelector: ${SW_CLUSTER_K8S_LABEL:app=collector,release=skywalking}
    uidEnvName: ${SW_CLUSTER_K8S_UID:SKYWALKING_COLLECTOR_UID}
...
configuration:
  selector: ${SW_CONFIGURATION:k8s-configmap}
...
  k8s-configmap:
      # Sync period in seconds. Defaults to 60 seconds.
      period: ${SW_CONFIG_CONFIGMAP_PERIOD:60}
      # Which namespace is confiigmap deployed in.
      namespace: ${SW_CLUSTER_K8S_NAMESPACE:default}
      # Labelselector is used to locate specific configmap
      labelSelector: ${SW_CLUSTER_K8S_LABEL:app=collector,release=skywalking}
在自定義配置告警規(guī)則的同時(shí)加入 webhook 后端報(bào)警[4]相關(guān)配置,configmap文件寫法可以參考官方helm configmap 示例[5]
我這里只把默認(rèn)的報(bào)警規(guī)則提示信息改成了中文報(bào)警信息,具體每條規(guī)則的參數(shù)沒有變化,同時(shí)還加入了釘釘webhook配置,具體流程如下
修改chart包的value.yaml,開啟動態(tài)配置
...
oap:
  name: oap
  dynamicConfigEnabled: true # 開啟動態(tài)配置功能
...
修改chart包中template的oap-configmap.yaml,配置自定義的rule和釘釘webhook
{{- if .Values.oap.dynamicConfigEnabled }}
apiVersion: v1
kind: ConfigMap
metadata:
  name: skywalking-dynamic-config
  labels:
    app: {{ template "skywalking.name" . }}
    release: {{ .Release.Name }}
    component: {{ .Values.oap.name }}
data:
  alarm.default.alarm-settings: |-
    rules:
      # Rule unique name, must be ended with `_rule`.
      service_resp_time_rule:
        metrics-name: service_resp_time
        op: ">"
        threshold: 1000
        period: 10
        count: 3
        silence-period: 5
        message: 最近3分鐘內(nèi)服務(wù) {name} 的平均響應(yīng)時(shí)間超過1秒
      service_sla_rule:
        # Metrics value need to be long, double or int
        metrics-name: service_sla
        op: "<"
        threshold: 8000
        # The length of time to evaluate the metrics
        period: 10
        # How many times after the metrics match the condition, will trigger alarm
        count: 2
        # How many times of checks, the alarm keeps silence after alarm triggered, default as same as period.
        silence-period: 3
        message: 最近2分鐘內(nèi)服務(wù) {name} 的成功率低于80%
      service_resp_time_percentile_rule:
        # Metrics value need to be long, double or int
        metrics-name: service_percentile
        op: ">"
        threshold: 1000,1000,1000,1000,1000
        period: 10
        count: 3
        silence-period: 5
        message: 最近3分鐘的服務(wù) {name} 的響應(yīng)時(shí)間百分比超過1秒
      service_instance_resp_time_rule:
        metrics-name: service_instance_resp_time
        op: ">"
        threshold: 1000
        period: 10
        count: 2
        silence-period: 5
        message: 最近2分鐘內(nèi)服務(wù)實(shí)例 {name} 的平均響應(yīng)時(shí)間超過1秒
      database_access_resp_time_rule:
        metrics-name: database_access_resp_time
        threshold: 1000
        op: ">"
        period: 10
        count: 2
        # message: Response time of database access {name} is more than 1000ms in 2 minutes of last 10 minutes
        message: 最近2分鐘內(nèi)數(shù)據(jù)庫訪問 {name} 的平均響應(yīng)時(shí)間超過1秒
      endpoint_relation_resp_time_rule:
        metrics-name: endpoint_relation_resp_time
        threshold: 1000
        op: ">"
        period: 10
        count: 2
        message: 最近2分鐘內(nèi)端點(diǎn) {name} 的平均響應(yīng)時(shí)間超過1秒
    dingtalkHooks:
      textTemplate: |-
        {
          "msgtype": "text",
          "text": {
            "content": "SkyWalking 鏈路追蹤告警: \n %s."
          }
        }
      webhooks:
        - url: https://oapi.dingtalk.com/robot/send?access_token=<釘釘機(jī)器人token>
          secret: <釘釘機(jī)器人加簽>
{{- end }}
修改完成后,執(zhí)行helm進(jìn)行更新
# ls
skywalking
# helm -n monitoring upgrade skywalking skywalking --values ./skywalking/values.yaml
# helm -n monitoring list
NAME            NAMESPACE       REVISION        UPDATED                                 STATUS          CHART                   APP VERSION
skywalking      monitoring      3               2021-03-22 13:35:36.779541 +0800 CST    deployed        skywalking-4.0.0
# helm -n monitoring history skywalking
REVISION        UPDATED                         STATUS          CHART                   APP VERSION     DESCRIPTION
1               Sun Mar 21 17:45:34 2021        superseded      skywalking-4.0.0                        Install complete
2               Mon Mar 22 13:35:36 2021        deployed        skywalking-4.0.0                        Upgrade complete
觀察 pod 狀態(tài),直到正常
# kubectl -n monitoring get pods
NAME                              READY   STATUS      RESTARTS   AGE
elasticsearch-logging-0           1/1     Running     0          19h
elasticsearch-logging-1           1/1     Running     0          19h
elasticsearch-logging-2           1/1     Running     0          19h
skywalking-es-init-ktdcn          0/1     Completed   0          19h
skywalking-oap-7bbb775965-49895   1/1     Running     0          15s
skywalking-oap-7bbb775965-s89dz   1/1     Running     0          43s
skywalking-ui-698cdb4dbc-mjl2m    1/1     Running     0          19h
4、測試告警
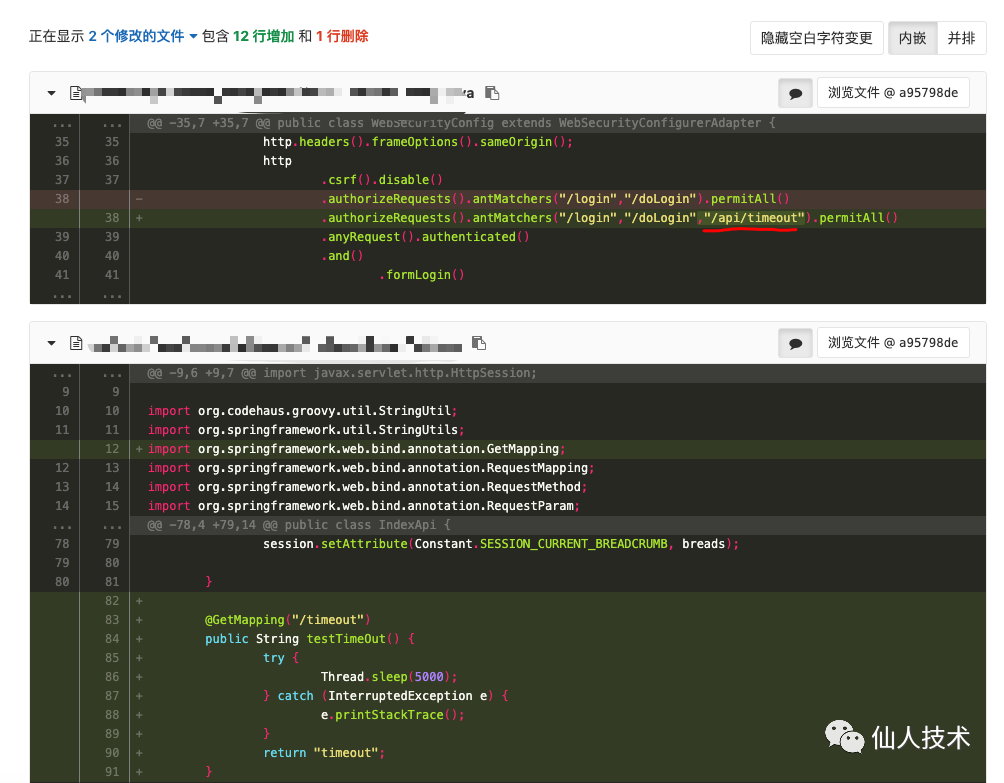
為了測試告警功能,拉上業(yè)務(wù)研發(fā)在項(xiàng)目中簡單寫了個(gè)url地址,請求時(shí)會超時(shí)5s返回
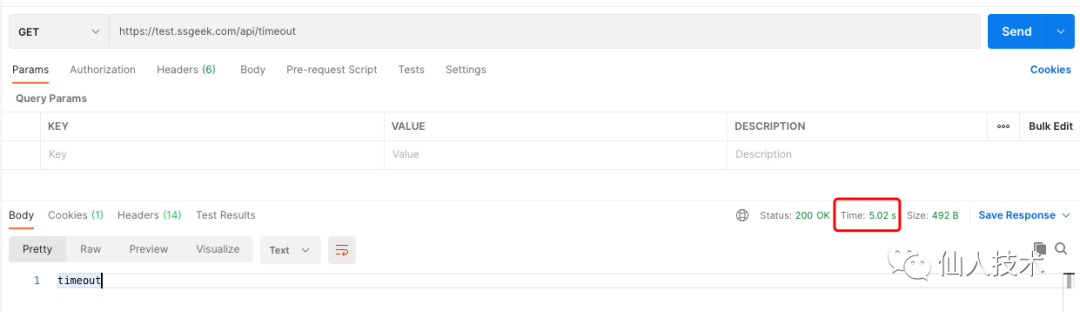
然后利用瀏覽器或postman請求應(yīng)用的/api/timeout進(jìn)行測試
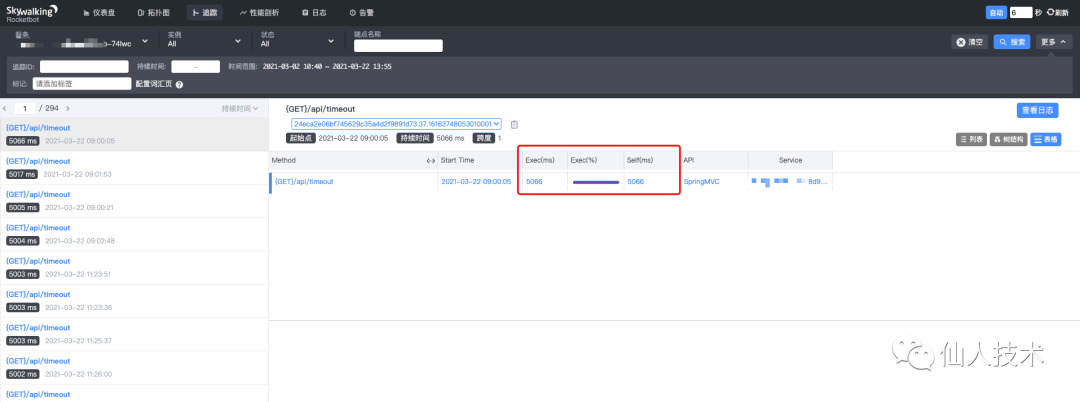
查看Skywalking的ui界面,鏈路追蹤
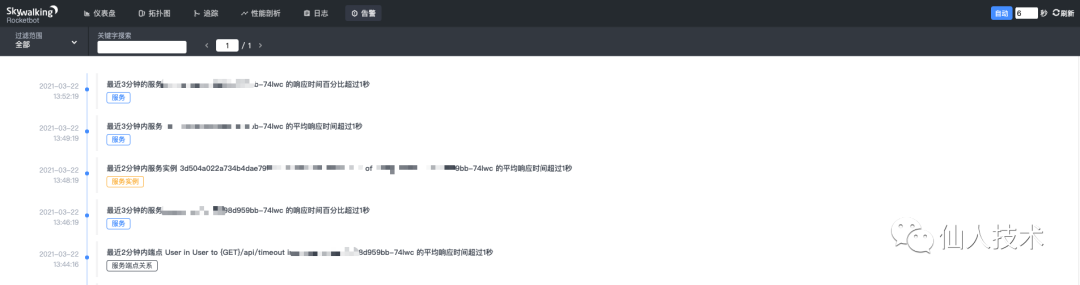
告警界面
到釘釘中查看報(bào)警消息

到這里,在Skywalking中配置報(bào)警就完成了 ~
附:在一次Skywalking線上分享會上記錄的關(guān)于使用Skywalking定位問題的思路:
縱覽全局, Skywalking拓?fù)鋱D監(jiān)控告警, metric/tracing確定問題存在故障(根據(jù)metric做告警,根據(jù)tracing統(tǒng)計(jì)作比較)確定故障在哪, tracing調(diào)用關(guān)系,確定故障出現(xiàn)在哪個(gè)service或者endpointprofile手段(skywalking新能力)或者常見傳統(tǒng)性能定位方法,定位單節(jié)點(diǎn)問題所在(比如CPU、內(nèi)存、io、網(wǎng)絡(luò) ——> 動態(tài)追蹤采樣 ——> 火焰圖)基本可以解決 99.9%的問題
參考資料
prometheus聚合指標(biāo)quantile: https://prometheus.io/docs/practices/histograms/#quantiles
composite-rules: https://github.com/apache/skywalking/blob/master/docs/en/setup/backend/backend-alarm.md#composite-rules
[3]Skywalking動態(tài)配置說明: https://github.com/apache/skywalking/blob/master/docs/en/setup/backend/dynamic-config.md
webhook后端報(bào)警: https://github.com/apache/skywalking/blob/master/docs/en/setup/backend/backend-alarm.md
helm configmap 示例: https://github.com/apache/skywalking/blob/master/oap-server/server-configuration/configuration-k8s-configmap/src/test/resources/skywalking-dynamic-configmap.example.yaml