
geopandas輕松繪制交互式在線地圖

導(dǎo)讀:今天的文章我就將為大家詳細介紹新版geopandas中,利用explore()制作在線地圖可視化的方法。

explore()方法類似我們熟悉的plot()方法,是GeoSeries與GeoDataFrame對象皆有的方法,下面我們遞進式地介紹:GeoSeries.explore()的主要參數(shù)如下:color:str或數(shù)組,用于設(shè)置所繪制矢量的顏色,當傳入數(shù)組時可一一對應(yīng)按順序設(shè)置每個矢量的顏色
m:類似 plot()方法中的ax參數(shù),用于傳入已存在的地圖對象,從而實現(xiàn)多圖層疊加
tiles:str型,用于設(shè)置底圖來源,默認為 'OpenStreetMap',其他可用的有'Stamen Terrain'、'Stamen Toner'、'Stamen Watercolor'、'CartoDB positron'及'CartoDB dark_matter',亦可傳入格式類似http://{s}.yourtiles.com/{z}/{x}/{y}.png的自定義地圖服務(wù),注意,當自定義tiles時,必須設(shè)置attr參數(shù)
attr:str型,用于設(shè)置底圖對應(yīng)的attribution信息
highlight:bool型,用于設(shè)置是否在鼠標懸浮于矢量上時展示高亮效果,默認為 True
width:int或str型,int型時用于設(shè)置地圖像素寬度,字符型時用于設(shè)置地圖相對于容器的百分比寬度,此參數(shù)在參數(shù)m設(shè)置時會失效
height:int或str型,int型時用于設(shè)置地圖像素高度,字符型時用于設(shè)置地圖相對于容器的百分比高度,此參數(shù)在參數(shù)m設(shè)置時會失效
control_scale:bool型,用于設(shè)置是否展示比例尺,默認為 True
zoom_control:bool型,用于設(shè)置是否展示縮放組件,默認為 True
marker_type:str型,用于設(shè)置點要素的樣式類型,可選的有 'marker'、'circle'和'circle_marker'
marker_kwds:dict型,用于設(shè)置點要素的更多細節(jié)參數(shù),常用的有:
radius:float型,用于設(shè)置點要素的半徑,當 marker_type='circle'時單位為米,當marker_type='circle_marker'時單位為像素icon:folium.map.Icon型,當 marker_type='marker'時,用于自定義點圖標,詳細用法參考:https://python-visualization.github.io/folium/modules.html#folium.map.Icon draggable:bool型,用于設(shè)置點圖標是否可自由拖拽,默認為 False
style_kwds:dict型,用于設(shè)置矢量的樣式細節(jié)參數(shù),常用的參數(shù)有:
stroke:bool型,設(shè)置是否繪制矢量輪廓,默認為 Truecolor:str型,用于設(shè)置輪廓顏色 weight:int型,用于設(shè)置輪廓像素寬度 opacity:float型,取值0~1之間,用于設(shè)置輪廓透明度,默認為1.0 fill:bool型,用于設(shè)置是否繪制矢量填充,默認為 TruefillColor:str型,用于設(shè)置矢量填充色 fillOpacity:float型,用于設(shè)置填充色透明度,默認為0.5
highlight_kwds:dict型,參數(shù)結(jié)構(gòu)同style_kwds,用于設(shè)置鼠標懸浮高亮狀態(tài)下的各樣式參數(shù)
min_zoom、max_zoom、zoom_start:int型,分別用于設(shè)置地圖的最小、最大及初始化縮放層級,默認值分別為0、18、10
location:元組或列表,用于設(shè)置地圖初始化時的中心坐標,格式為 [緯度, 經(jīng)度]
m?=?shp.geometry.explore(
????color='#40a9ff',
????tiles='https://server.arcgisonline.com/ArcGIS/rest/services/World_Imagery/MapServer/tile/{z}/{y}/{x}',
????attr='?',
????width='80%',
????tooltip=False,?#?關(guān)閉鼠標懸浮時的空白tooltip
????style_kwds={
????????'color':?'white',
????????'fillOpacity':?0.4
????},
????highlight_kwds={
????????'fillColor':?'white',
????????'fillOpacity':?0.6
????}
)
m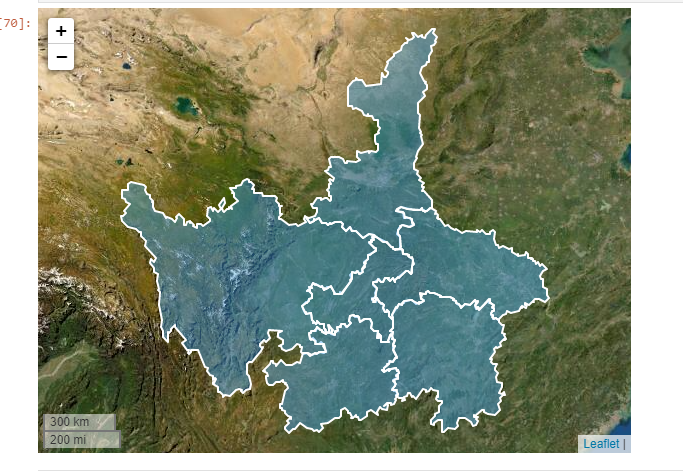
import?folium
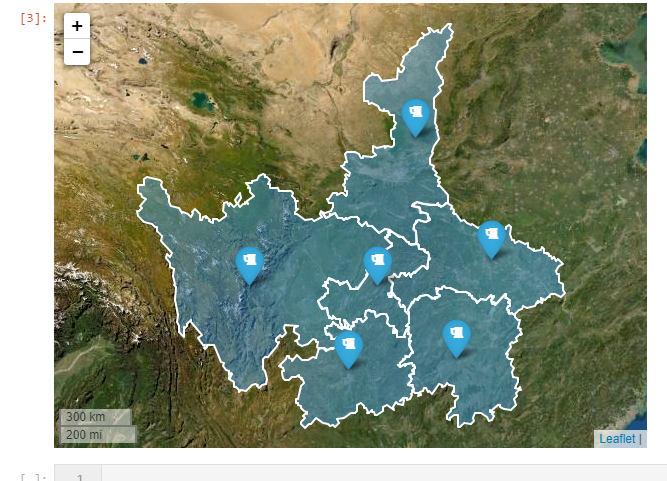
m?=?shp.geometry.explore(
????color='#40a9ff',
????tiles='https://server.arcgisonline.com/ArcGIS/rest/services/World_Imagery/MapServer/tile/{z}/{y}/{x}',
????attr='?',
????width='80%',
????tooltip=False,?#?關(guān)閉鼠標懸浮時的空白tooltip
????style_kwds={
????????'color':?'white',
????????'fillOpacity':?0.4
????},
????highlight_kwds={
????????'fillColor':?'white',
????????'fillOpacity':?0.6
????}
)
shp.representative_point().explore(
????color='red',
????tooltip=False,?#?關(guān)閉鼠標懸浮時的空白tooltip
????m=m,?#?疊加已有地圖
????marker_type='marker',
????marker_kwds={
????????'icon':?folium.map.Icon(icon='beer',?prefix='fa')
????}
)
GeoSeries.explore()相比,GeoDataFrame除了矢量字段之外,還可以快捷地利用數(shù)據(jù)框中其他字段的信息,來輔助視覺元素的映射,因此在GeoSeries.explore()的參數(shù)體系基礎(chǔ)上,GeoDataFrame.explore()新增了如下參數(shù),與plot()方法非常相似:column:str型或數(shù)組,用于指定繪圖映射基于的字段名,亦或是額外傳入的與矢量一一對應(yīng)的數(shù)組
cmap:str型或matplotlib中的colormap對象,用于設(shè)置色彩映射方案
tooltip:bool、str或list型,用于自定義鼠標懸浮時提示框內(nèi)顯示的字段信息, True表示展示全部字段,F(xiàn)alse表示關(guān)閉提示框,str型時可指定單個要展示的字段名,list型時指定多個要展示的字段
popup:用于設(shè)置鼠標點擊觸發(fā)展示的信息框內(nèi)容,格式同tooltip
categorical:bool型,用于設(shè)置是否開啟類別映射模式,默認為 False
legend:bool型,設(shè)置是否顯示圖例,默認為True
scheme:字符型,同 plot()中的同名參數(shù),用于設(shè)定分層設(shè)色規(guī)則,參考我的過往文章:https://www.cnblogs.com/feffery/p/12381322.html
k:int型,用于設(shè)置分層設(shè)色分段數(shù)量,默認為5
vmin:float型,用于手動設(shè)置色彩映射最小值
vmax:float型,用于手動設(shè)置色彩映射最大值
categories:list型,用于傳入順序類別列表
tooltip_kwds:dict型,用于自定義設(shè)置tooltip樣式,詳細參考: https://python-visualization.github.io/folium/modules.html#folium.features.GeoJsonTooltip
popup_kwds:dict型,用于自定義設(shè)置popup樣式,詳細參考: https://python-visualization.github.io/folium/modules.html#folium.features.GeoJsonPopup
legend_kwds:dict型,用于自定義設(shè)置圖例,主要的參數(shù)有:
caption:str型,自定義圖例標題,默認為映射字段名 colorbar:bool型,用于設(shè)置是否開啟colorbar模式,設(shè)置為 False時會開啟分段模式fmt:str型,用于自定義圖例項數(shù)值格式,默認為 '{:.2f}'labels:list型,自定義圖例項標簽文字,來覆蓋原始自動生成內(nèi)容 max_labels:int型,設(shè)置colorbar圖例中刻度數(shù)量 scale:bool型,設(shè)置是否以真實尺度來渲染每段分層設(shè)色區(qū)間, False時每段色階長度會強制相同
m?=?shp.explore(
????column='area',
????cmap='Blues',
????tiles='https://server.arcgisonline.com/ArcGIS/rest/services/World_Imagery/MapServer/tile/{z}/{y}/{x}',
????attr='?',
????scheme='NaturalBreaks',
????k=3,
????vmin=0,
????legend_kwds={
????????'caption':?'面積(平方千米)',
????????'scale':?False,
????????'colorbar':?False
????},
????style_kwds={
????????'color':?'white',
????????'weight':?1,
????????'fillOpacity':?0.8
????}
)
m
m?=?shp.explore(
????column='area',
????cmap='Reds',
????tiles='https://server.arcgisonline.com/ArcGIS/rest/services/World_Topo_Map/MapServer/tile/{z}/{y}/{x}',
????attr='?',
????scheme='NaturalBreaks',
????k=3,
????vmin=0,
????legend_kwds={
????????'caption':?'面積(平方千米)',
????????'scale':?False
????},
????style_kwds={
????????'color':?'white',
????????'weight':?1,
????????'fillOpacity':?0.7
????}
)
msave()方法,將其保存為離線html文件:m.save('demo.html')

干貨直達??
評論
圖片
表情