
Vue3 Table 性能優(yōu)化,減少 85% 渲染耗時
大廠技術(shù) 高級前端 Node進階
點擊上方 程序員成長指北,關(guān)注公眾號
回復(fù)1,加入高級Node交流群
原文鏈接: https://juejin.cn/post/7194516447932973112
作者:dev_zuo
前段時間公司有一個比較重要的模塊從 vue2 升級到 vue3,升級后發(fā)現(xiàn) element-plus table 的性能相比 vue2 版本下降非常嚴重。
自定義列全部勾選的場景下(20 行 x 180 列),列表中的開關(guān)切換,耗時從原先的 400-500 毫秒下降到 7-8 秒,嚴重影響用戶體驗,經(jīng)過較長時間的性能測試、debug,找到了幾處比較核心的優(yōu)化點。
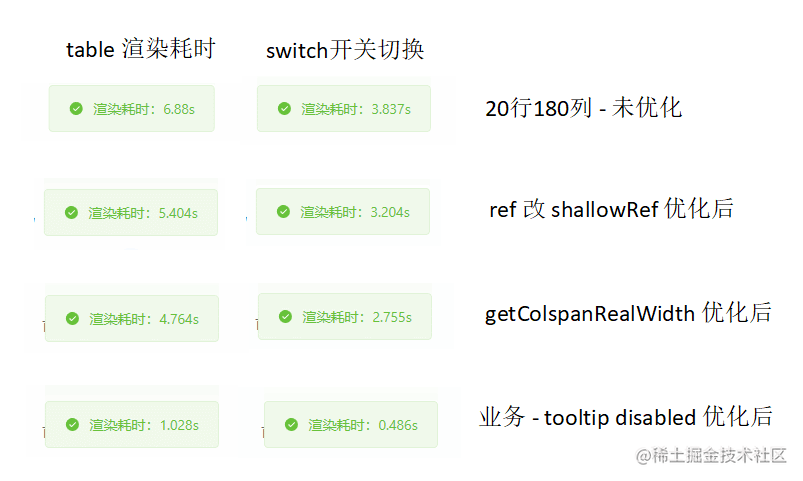
先來看一下 20 行 x 180 列場景下各個優(yōu)化點的性能測試數(shù)據(jù),為排除偶然性,每個場景都會測 3 次。
| 優(yōu)化類型 | table 整體渲染耗時 | switch 切換耗時 |
|---|---|---|
| 未優(yōu)化前 | 6.59s(6.71s、6.49s、6.577s) | 3.982s(3.966s、3.947s、4.033s) |
| data 與 columns 從 ref 改 shallowRef 后(耗時減少 17-20%) | 5.18s(5.063s、5.104s、5.363s) | 3.3s(3.175s、3.029s、3.122s) |
| getColspanRealWidth 優(yōu)化后(耗時減少 7-20%) | 4.843(4.728s、4.703s 、5.098s) | 2.65s(2.636s、2.645s、2.671s) |
| 業(yè)務(wù)優(yōu)化 去除tooltip disabled屬性后(耗時減少 80%) | 1.008s(1.032s、0.997s、0.994s) | 0.514s(0.517s、0.53s、0.495s) |
大致優(yōu)化內(nèi)容如下
修改 table 源碼,將 data 與 columns 從 ref 改為 shallowRef。 修改 table 源碼,getColspanRealWidth 函數(shù)中響應(yīng)式數(shù)據(jù)優(yōu)化。 業(yè)務(wù)優(yōu)化:去掉 el-tooltip disabled 屬性,改為 if。
準備工作
首先初始化一個 vue3 項目,引入 element-plus,并使用 el-table 實現(xiàn)一個 20 行 * 180 列表格。
20 行 + 180 列:2 個固定列(一個文本、一個 switch),178 個通過 for 循環(huán)創(chuàng)建的自定義列 一個顯示/隱藏 table 的 switch 開關(guān),用于測試 table 從隱藏到顯示,渲染耗時 自定義列中有一個 el-tooltip + disabled 邏輯

最小化業(yè)務(wù) demo 創(chuàng)建
核心 table 代碼代碼如下,完整代碼參見:table-base | table-performance-demo[1]
<el-table
  v-if="showTable"
  :data="tableData"
  style="width: 100%; height: 500px; overflow: scroll"
>
  <el-table-column prop="info" label="信息" width="80" fixed />
  <el-table-column prop="status" label="狀態(tài)" width="80" fixed>
    <template #default="scope">
      <el-switch v-model="scope.row.status" @change="statusChange" />
    </template>
  </el-table-column>
  <el-table-column
    v-for="item in customColumns"
    :key="item.prop"
    :prop="item.prop"
    :label="item.label"
  >
    <template #default="scope">
      <el-tooltip
        placement="top-start"
        :disabled="!(item.prop === 'column1' && scope.row[item.prop])"
      >
        <template #content>
          <span>{{ "tooltip顯示" + scope.row[item.prop] }}</span>
        </template>
        <span>{{ scope.row[item.prop] }}</span>
      </el-tooltip>
    </template>
  </el-table-column>
</el-table>

<script lang="ts" setup>
// 假數(shù)據(jù)邏輯
const customColCount = 178; // 自定義列數(shù)
const rowCount = 20; // 行數(shù)
onBeforeMount(() => {
  // 初始化自定義列數(shù)據(jù)
  let temp = [];
  for (let i = 0; i < customColCount; i++) {
    temp.push({ prop: `column${i + 1}`, label: `第${i + 1}列` });
  }
  customColumns.value = temp;

  // 初始化表格數(shù)據(jù)
  let dataTemp = [];
  for (let i = 0; i < rowCount; i++) {
    let row: any = { info: `第${i + 1}行`, status: true };
    i === 0 && (row.status = false);
    for (let j = 0; j < customColCount + 2; j++) {
      row[`column${j + 1}`] = `第${i + 1}行${j + 1}列`;
    }
    dataTemp.push(row);
  }
  tableData.value = dataTemp;
});
</script>
渲染耗時計算邏輯
渲染耗時計算邏輯如下,利用 script 阻塞,來計算渲染耗時
/*
<div v-loading="showLoading" element-loading-text="數(shù)據(jù)加載中...">
  <p>
    當前顯示:{{ `${rowCount}行${customColCount + 2}列` }}, 顯示/隱藏 table:
    <el-switch :model-value="showTable" @click="switchTableShow"></el-switch>
  </p>
  <el-table v-if="showTable"> .... </el-table>
</div>
*/

// 顯示/隱藏 table,計算 table 渲染耗時
const switchTableShow = () => {
  // 先展示 loading
  showLoading.value = true;

  // 200ms 后再修改 table 是否顯示,防止和 loading 合并到一個渲染周期,導(dǎo)致 loading 不顯示
  setTimeout(() => {
    let startTime = +new Date();
    showTable.value = !showTable.value; // 修改 table 顯示,會形成 script 阻塞
    showLoading.value = false; // 這里的 loading 關(guān)閉,會在 table 阻塞完成后渲染關(guān)閉 dom
    // 創(chuàng)建一個宏任務(wù),等上面阻塞的微任務(wù)執(zhí)行完成后,再顯示計算耗時
    setTimeout(() => {
      let endTime = +new Date();
      ElMessage.success(`渲染耗時:${(endTime - startTime) / 1000}s`);
    }, 0);
  }, 200);
};
性能數(shù)據(jù),與 performance 耗時對比
table 渲染、switch 切換測試耗時如下

table 隱藏到顯示 gif 圖

switch 從關(guān)到開 gif 圖
為了驗證我們自己寫的耗時測試數(shù)據(jù)的準確性,這里在 switch 開關(guān)時,打開了 performance 錄制,具體如下圖
頁面顯示渲染耗時:4.524s,performance 中兩個 Long Task:2.29s + 2.17,加上非 Long Task 部分,數(shù)據(jù)基本一致,因此我們自己寫的耗時計算邏輯是基本準確的
 table-base-switch-performance.gif
另外,開啟 performance 錄制時,比不錄制時要稍微慢點。下面來開始優(yōu)化吧!
ref 改 shallowRef
理論依據(jù)與可行性分析
列表中的開關(guān)切換時,table 雖然只是一個節(jié)點發(fā)生了變化,但依舊觸發(fā)了完整的 vue patch 比對更新邏輯,耗時較久。
來看一個官方的解釋:渲染機制 | Vue.js[2]

理論上,減少響應(yīng)式數(shù)據(jù)依賴,就可以提升性能。
shallowRef() 是 ref() 的淺層作用形式。僅當 xx.value 發(fā)生變更時,才觸發(fā)響應(yīng)更新,減少深層次的響應(yīng)依賴,可以提升 patch 比對性能。參考 指南 - 減少大型不可變結(jié)構(gòu)的響應(yīng)性開銷[3]
const state = shallowRef({ count: 1 })

// shallowRef 不會觸發(fā)更改,如果 state 為 ref 時,是可以觸發(fā)更新的。
state.value.count = 2

// shallowRef 會觸發(fā)更改
state.value = { count: 2 }
這里主要修改兩種數(shù)據(jù)從 ref 到 shallowRef
// src/table/src/store/watcher.ts
function useWatcher<T>() {
  const data: Ref<T[]> = shallowRef([]); // table data 數(shù)據(jù)
  const columns: Ref<TableColumnCtx<T>[]> = shallowRef([]); // 列數(shù)據(jù)
  // ...
}
這里有個問題,把 data、columns 改為 shallowRef 對功能會不會有影響?
首選,每次列表數(shù)據(jù)更新,我們業(yè)務(wù)邏輯都會去請求列表,設(shè)置 list.value = xxx 可以觸發(fā) shallowRef 更新。 經(jīng)過測試,就算是 switch 開關(guān) v-model 綁定的 scope.row.status 變更也可以正常更新。 手動點擊測試選中、排序、分頁等均未發(fā)現(xiàn)異常。
基于以上三點,在我們業(yè)務(wù)中,這個修改是可行的。提醒:如果想在你自己的項目中使用該優(yōu)化,需要先做好測試。
下面來看具體修改細節(jié)
拷貝 element-plus table 源碼到當前項目
當前最新的版本是 2.2.8,打開 element-plus/releases[4],下載最新版本代碼,將 table 目錄(element-plus-2.2.28/packages/components/table) copy 到項目中的 src/table 下,刪除目中無用的 __test__ 測試目錄
新開一個路由,/new 指定到一個新增的 table 組件內(nèi),相比原先 table 組件,只增加一行代碼,當前組件內(nèi)使用我們自定義修改的 table。完整代碼參見:2-table-use-source | table-performance-demo[5]
import ElTable from "@/table/src/table.vue";
引入后報錯 [plugin:vite:import-analysis] Failed to resolve import "@element-plus/directives" from "src\table\src\table.vue". Does the file exist?
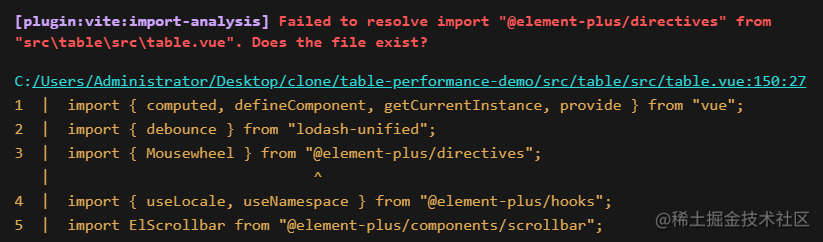
做一些修改,讓代碼可以在我們自己的項目中跑起來,方便修改、調(diào)試源碼
在 table 目錄中搜索 @element-plus 相關(guān)關(guān)鍵字,并進行批量替換
// @element-plus/directives => element-plus/es/directives/index
// @element-plus/hooks => element-plus/es/hooks/index
// @element-plus/utils => element-plus/es/utils/index
搜索 @element-plus/components改為直接從 'element-plus' 引入
// 比如:
import ElCheckbox from '@element-plus/components/checkbox'
// 改為
import { ElCheckbox } from 'element-plus'

// 注意:資源類的可以不用改,比如 import "@element-plus/components/base/style/css";
修改源碼 - ref 改 shallowRef
在 src/table/src/store/watcher.ts 中,將 data 和 columns 數(shù)據(jù)從 ref 改為 shallowRef,具體代碼參:table-ref-shallowRef | table-performance-demo[6]
// src/table/src/store/watcher.ts
function useWatcher<T>() {
  const data: Ref<T[]> = shallowRef([]);
  const _data: Ref<T[]> = shallowRef([]);
  const _columns: Ref<TableColumnCtx<T>[]> = shallowRef([]);
  const columns: Ref<TableColumnCtx<T>[]> = shallowRef([]);
  // ...
}
另外在 中 表格前面增加下面一行,標記調(diào)用的是我們修改的 table 組件
<!-- src/table/src/table.vue 表格頂部增加下面一行 --->
<p style="color: red">來自 table 源碼</p>
<!-- 內(nèi)部邏輯 -->
<div :class="ns.e('inner-wrapper')" :style="tableInnerStyle">
    <!-- ... -->
</div>
性能數(shù)據(jù)(耗時減少17-20%)
table 渲染、switch 切換測試耗時如下

table 隱藏到顯示 gif 圖

switch 從關(guān)到開 gif 圖
getColspanRealWidth 優(yōu)化
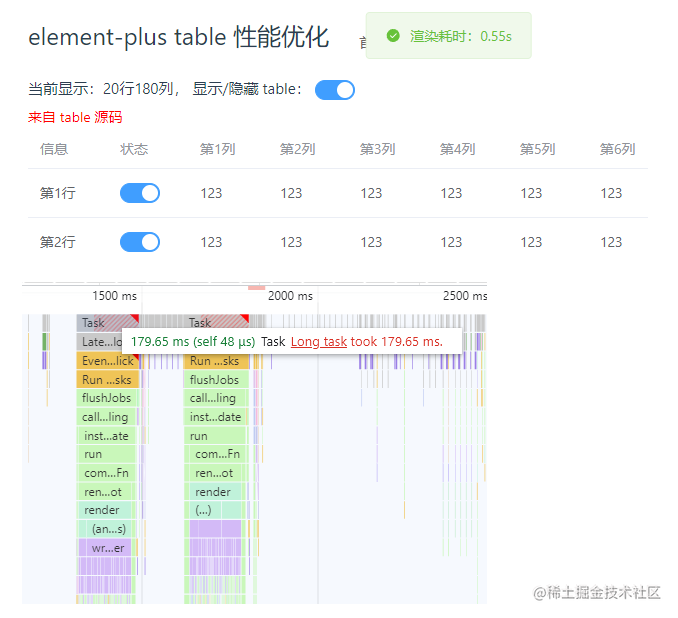
當頁面卡頓時,可以通過 performance 測試性能。下圖是點擊 switch 開關(guān)后的性能數(shù)據(jù)。可以看到
有兩個 Scripting 阻塞 longTask,1.89s + 1.73s,整體耗時 3.62s (performance開啟時,會變慢一點) 主要有兩種耗時任務(wù):紫色小塊是 render 渲染耗時、綠色小塊是 patch 比對耗時,一般 patch 是 vue 內(nèi)部邏輯,比較難優(yōu)化 通過查看 render 相關(guān)耗時,找到 getColspanRealWidth 耗時 212.2ms,這里有優(yōu)化的空間
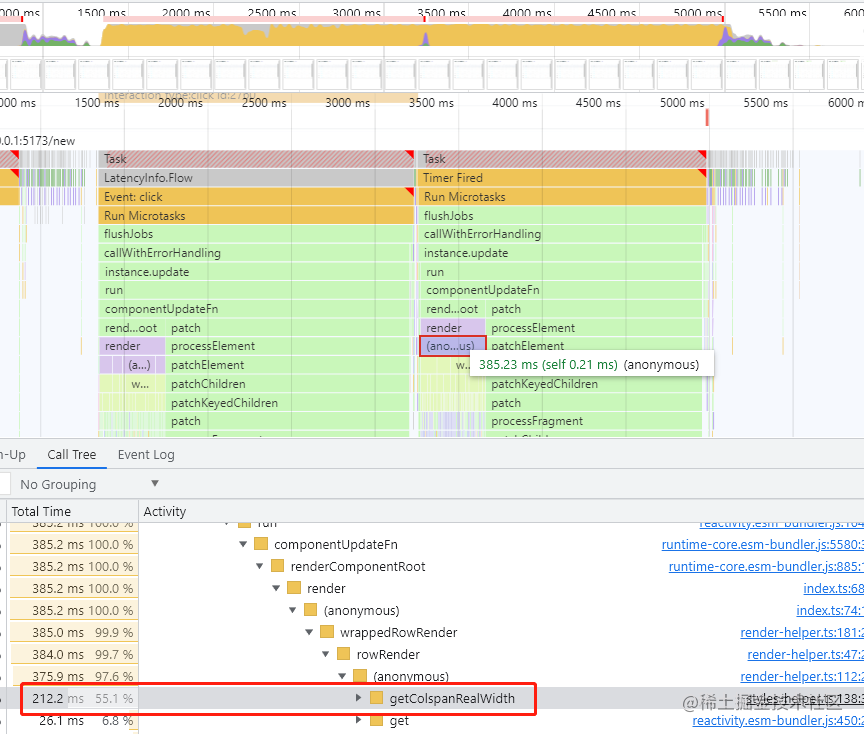
我們來查看這個函數(shù)耗時的原因,主要是在 tr 渲染時調(diào)用該函數(shù),計算每列的寬度
// src\table\src\table-body\render-helper.ts
columns.value.map((column, cellIndex) => {
  // ...
  columnData.realWidth = getColspanRealWidth(
    columns.value,
    colspan,
    cellIndex
  );
  // ...
})
具體實現(xiàn)如下,只用到了 realWidth, width 屬性,且 columns.value 是響應(yīng)式依賴,可以修改為非響應(yīng)式數(shù)據(jù),看是否能減少耗時。
// src\table\src\table-body\styles-helper.ts
const getColspanRealWidth = (
  columns: TableColumnCtx<T>[],
  colspan: number,
  index: number
): number => {
  if (colspan < 1) {
    return columns[index].realWidth
  }
  const widthArr = columns
    .map(({ realWidth, width }) => realWidth || width)
    .slice(index, index + colspan)
  return Number(
    widthArr.reduce((acc, width) => Number(acc) + Number(width), -1)
  )
}
這里我們新建 optimizeColumns 變量,存儲函數(shù)中使用的 realWidth 和 width,將這個非響應(yīng)式數(shù)據(jù)傳入到 getColspanRealWidth 函數(shù)內(nèi)部使用,完整代碼參見 getColspanRealWidth-optimize | table-performance-demo[7]
// src\table\src\table-body\render-helper.ts
const optimizeColumns = columns.value.map((item) => {
  return { realWidth: item.realWidth, width: item.width };
});
columns.value.map((column, cellIndex) => {
  // ...
  columnData.realWidth = getColspanRealWidth(
    optimizeColumns, // 傳入函數(shù)內(nèi)部時,使用非響應(yīng)式數(shù)據(jù)
    colspan,
    cellIndex
  );
  // ...
})
耗時從 200ms 下降到 0.7ms
修改好后再次測試性能,驚喜的發(fā)現(xiàn),這個函數(shù)的耗時從 200ms+ 下降到 1ms 內(nèi),render 性能明顯提升。1.54s + 1.45s = 2.99s

性能數(shù)據(jù)(耗時減少7-20%)
table 渲染、switch 切換測試耗時如下

table 隱藏到顯示 gif 圖

switch 從關(guān)到開 gif 圖
業(yè)務(wù)優(yōu)化 tooltip disabled 改 if
經(jīng)過上面的優(yōu)化后,我們意識到,即使是很細微的響應(yīng)式數(shù)據(jù)優(yōu)化,也會對性能帶來較大影響。那業(yè)務(wù)邏輯中是否也存在這樣的數(shù)據(jù)呢?
于是采用注釋 + 將 el-table-column 插槽換成靜態(tài)節(jié)點 <span>123</span> 的方法,測試具體是哪里耗時較長,然后針對性優(yōu)化。
經(jīng)過測試,發(fā)現(xiàn)將自定義列中的 el-tooltip 換成靜態(tài)節(jié)點后,性能有極大提升。
<el-table-column
  v-for="item in customColumns"
  :key="item.prop"
  :prop="item.prop"
  :label="item.label"
>
  <template #default="scope">
    <!-- <el-tooltip
      placement="top-start"
      :disabled="!(item.prop === 'column1' && scope.row[item.prop])"
    >
      <template #content>
        <span>{{ "tooltip顯示" + scope.row[item.prop] }}</span>
      </template>
      <span>{{ scope.row[item.prop] }}</span>
    </el-tooltip> -->
    <span>123</span>
  </template>
</el-table-column>
如下圖,switch 開關(guān)切換耗時從 2.7s 左右減少到 0.5s 左右。performance 面板可以看到 patch 基本沒有了,應(yīng)該是模板編譯時靜態(tài)節(jié)點標記后,更新時就不用比對了。
基于這個思路,el-tooltip 組件會成倍的增加 patch 比對耗時,減少這個節(jié)點數(shù)量即可增強性能。
為了少些一些代碼,el-tooltip 使用 disabled 屬性,用于在特定場景下隱藏 tooltip,這一部分數(shù)據(jù)可以不使用 el-tooltip 節(jié)點,改動如下,使用 v-if 替換 disabled 屬性功能,這樣雖然會有重復(fù)代碼,但可以減少節(jié)點數(shù)。
<template #default="scope">
  <!--
    <el-tooltip
      placement="top-start"
      :disabled="!(item.prop === 'column1' && scope.row[item.prop])"
    >
      <template #content>
        <span>{{ "tooltip顯示" + scope.row[item.prop] }}</span>
      </template>
      <span>{{ scope.row[item.prop] }}</span>
    </el-tooltip>
  -->
  <span v-if="!(item.prop === 'column1' && scope.row[item.prop])">
    {{ scope.row[item.prop] }}
  </span>
  <el-tooltip v-else placement="top-start">
    <template #content>
      <span>{{ "tooltip顯示" + scope.row[item.prop] }}</span>
    </template>
    <span>{{ scope.row[item.prop] }}</span>
  </el-tooltip>
</template>
再次測試性能,可以看到性能并沒有下降多少,switch 開關(guān)切換可以做到 0.5s 左右刷新

性能數(shù)據(jù)(耗時減少80%)
table 渲染、switch 切換測試耗時如下

table 隱藏到顯示 gif 圖
switch 從關(guān)到開 gif 圖
總結(jié)
如下圖,通過 3 個小的細節(jié)改動,將 table 渲染耗時從 6.88s 減少到 1s 左右,平均減少 85% 渲染耗時,用戶體驗基本達到預(yù)期。完整 demo github 地址:github.com/zuoxiaobai/…[8]
在 vue3 項目中,響應(yīng)式數(shù)據(jù)這塊要特別注意。當遇到比較慢的場景時,建議采用如下方法進行性能優(yōu)化
使用 performance 分析性能瓶頸,或者自己寫一個性能耗時邏輯,這樣在做性能優(yōu)化時有數(shù)據(jù)參考。 針對業(yè)務(wù)代碼較多場景,采用注釋 + 替換成靜態(tài)節(jié)點方法排查耗時較長的邏輯,針對性優(yōu)化。 另外,可以使用 Vue devtools 調(diào)試工具,查看組件更新渲染耗時,排查響應(yīng)式數(shù)據(jù)問題。
Node 社群

我組建了一個氛圍特別好的 Node.js 社群,里面有很多 Node.js小伙伴,如果你對Node.js學(xué)習(xí)感興趣的話(后續(xù)有計劃也可以),我們可以一起進行Node.js相關(guān)的交流、學(xué)習(xí)、共建。下方加 考拉 好友回復(fù)「Node」即可。   “分享、點贊、在看” 支持一波??
參考
一頓操作,我把 Table 組件性能提升了十倍[9]
參考資料
https://github.com/zuoxiaobai/table-performance-demo/tree/table-base: https://github.com/zuoxiaobai/table-performance-demo/tree/table-base
[2]https://cn.vuejs.org/guide/extras/rendering-mechanism.html#compiler-informed-virtual-dom: https://cn.vuejs.org/guide/extras/rendering-mechanism.html#compiler-informed-virtual-dom
[3]https://cn.vuejs.org/guide/best-practices/performance.html#reduce-reactivity-overhead-for-large-immutable-structures: https://cn.vuejs.org/guide/best-practices/performance.html#reduce-reactivity-overhead-for-large-immutable-structures
[4]https://github.com/element-plus/element-plus/releases: https://github.com/element-plus/element-plus/releases
[5]https://github.com/zuoxiaobai/table-performance-demo/tree/2-table-use-source: https://github.com/zuoxiaobai/table-performance-demo/tree/2-table-use-source
[6]https://github.com/zuoxiaobai/table-performance-demo/tree/table-ref-shallowRef: https://github.com/zuoxiaobai/table-performance-demo/tree/table-ref-shallowRef
[7]https://github.com/zuoxiaobai/table-performance-demo/tree/getColspanRealWidth-optimize: https://github.com/zuoxiaobai/table-performance-demo/tree/getColspanRealWidth-optimize
[8]https://github.com/zuoxiaobai/table-performance-demo: https://github.com/zuoxiaobai/table-performance-demo
[9]https://mp.weixin.qq.com/s/Zj6h6szd4JTvYb5noYwxgQ#: https://mp.weixin.qq.com/s/Zj6h6szd4JTvYb5noYwxgQ#