
介紹幾款Python性能優(yōu)化工具
大家好,歡迎來到Crossin的編程教室!
雖然很多人都認為Python是一個“慢”語言,但其實很多時候,導致程序慢的原因并不是語言的鍋,而是代碼寫得不夠好。所以在程序運行過程中,如果發(fā)現(xiàn)運行時間太長或者內存占用過大,就需要對程序的執(zhí)行過程進行一些監(jiān)測,找到有問題的地方,進行優(yōu)化。今天我們就來分享一些平時能用上的Python性能分析工具。
memory_profiler
memory_profiler是監(jiān)控python進程的神器,只需要在函數(shù)加一個裝飾器就可以輸出每行代碼的內存使用情況
安裝:
pip install memory_profiler
使用:
import timedef my_func():a = [1] * (10 ** 6)b = [2] * (2 * 10 ** 7)time.sleep(10)del bdel aprint "+++++++++"if __name__ == '__main__':my_func()
輸出:
$ python -m memory_profiler del3.py+++++++++Filename: del3.pyLine # Mem usage Increment Line Contents================================================10.293 MiB 0.000 MiB @profiledef my_func():17.934 MiB 7.641 MiB a = [1] * (10 ** 6)170.523 MiB 152.590 MiB b = [2] * (2 * 10 ** 7)170.527 MiB 0.004 MiB time.sleep(10)17.938 MiB -152.590 MiB del b10.305 MiB -7.633 MiB del a10.309 MiB 0.004 MiB print "+++++++++"
import timeitimport timedef my_func():time.sleep(1)return sum([1,2,3])result = timeit.timeit(my_func, number=5)print(result)
Jupyter Notebook Magic 命令
在Jupyter Notebook中,可以通過%%timeit魔法命令測試cell中代碼的運行時間
%%timeitimport timedef my_func():time.sleep(1)return sum([1,2,3])result = timeit.timeit(my_func, number=5)print(result)
計時裝飾器
Python 中的裝飾器可以在其他函數(shù)不需要改動任何代碼的情況下增加額外功能,經常用在,插入日志、性能測試、權限校驗等場景中。我們可以將計時功能封裝成一個裝飾器,方便復用。
from functools import wrapsimport timedef timeit(func):def deco():start = time.time()res = func()end = time.time()delta = end - startprint("Wall time ", delta)return resreturn deco
使用:
def my_func():# do somethingtime.sleep(3)pass
輸出:
Wall time: 3
如果我們除了想知道代碼整體的運行時間之外,還要精確分析每行代碼的運行時間,那python的 line_profiler 模塊就可以幫到你啦!line_profiler 可以用來測試函數(shù)每行代碼的響應時間等情況。為了使用方便,可以將line_profiler 相關函數(shù)封裝在裝飾器中進行使用,這樣在接口請求時,則會執(zhí)行此裝飾器并打印出結果。
安裝:
pip install line_profiler使用:
from flask import Flask, jsonifyimport timefrom functools import wrapsfrom line_profiler import LineProfiler# 查詢接口中每行代碼執(zhí)行的時間def func_line_time(f):def decorator(*args, **kwargs):func_return = f(*args, **kwargs)lp = LineProfiler()lp_wrap = lp(f)lp_wrap(*args, **kwargs)lp.print_stats()return func_returnreturn decoratorapp = Flask(__name__)def line_test():for item in range(5):time.sleep(1)for item in xrange(5):time.sleep(0.5)return jsonify({'code':200})if __name__=='__main__':app.run()
輸出:
* Running on http://127.0.0.1:5000/Timer unit: 1e-06 sTotal time: 7.50827 sFile: /home/rgc/baidu_eye/carrier/test/flask_line_profiler_test.pyFunction: line_test at line 22Line # Hits Time Per Hit % Time Line Contents==============================================================@app.route('/line_test')@func_line_timedef line_test():6 33.0 5.5 0.0 for item in range(5):5 5005225.0 1001045.0 66.7 time.sleep(1)6 31.0 5.2 0.0 for item in xrange(5):5 2502696.0 500539.2 33.3 time.sleep(0.5)1 282.0 282.0 0.0 return jsonify({'code':200})127.0.0.1 - - [05/Mar/2018 15:58:21] "GET /line_test HTTP/1.1" 200 -
pyheat
相較于上面的代碼運行時間測試工具,pyheat 通過matplotlib 的繪制熱力圖來展現(xiàn)代碼的運行時間,顯得更為直觀
 安裝:
安裝:
pip install py-heat使用方法:
pyheat --out image_file.png heartrate
heartrate 也是一個可視化的監(jiān)測工具,可以像監(jiān)測心率一樣追蹤程序運行,通過web頁面可視化Python程序的執(zhí)行過程。
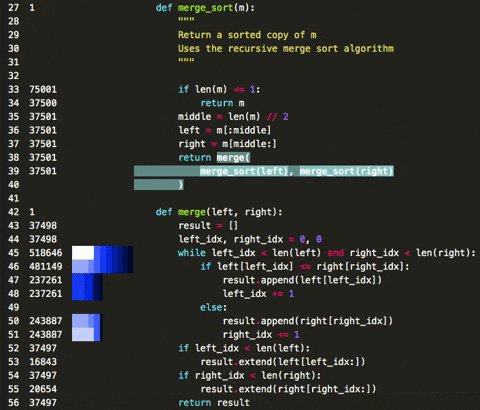
左側數(shù)字表示每行代碼被觸發(fā)的次數(shù)。長方框表示最近被觸發(fā)的代碼行——方框越長表示觸發(fā)次數(shù)越多,顏色越淺表示最近被觸發(fā)次數(shù)越多。該工具記錄的是每行代碼執(zhí)行的次數(shù),
而不是具體執(zhí)行時間,在性能調試的時候有些雞肋
安裝:
pip install --user heartrate使用:
import heartratefrom heartrate import trace, filesheartrate.trace(browser=True)trace(files=files.path_contains('my_app', 'my_library'))
以上就是幾款常用的Python性能優(yōu)化工具。但工具只是輔助,核心還是需要寫代碼的人要有代碼優(yōu)化的意識以及對語言和代碼的深入理解。這是一個長期積累的過程。堅持讀代碼、寫代碼,你的代碼性能自然也會隨著你的能力不斷提高!
作者:Alpha 3
來源:數(shù)據(jù)科學雜談
_往期文章推薦_