日志收集神器 Logstash,閃亮登場~

Java技術(shù)棧
www.javastack.cn
關(guān)注閱讀更多優(yōu)質(zhì)文章
作者:廢物大師兄
來源:www.cnblogs.com/cjsblog/p/9445792.html
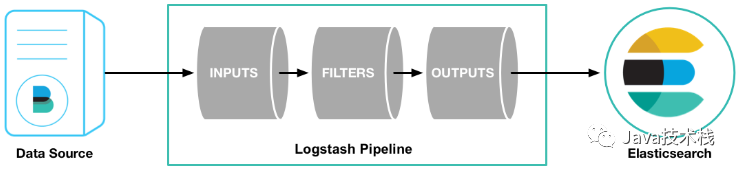
Logstash是一個開源數(shù)據(jù)收集引擎,具有實時管道功能。
Logstash可以動態(tài)地將來自不同數(shù)據(jù)源的數(shù)據(jù)統(tǒng)一起來,并將數(shù)據(jù)標準化到你所選擇的目的地。
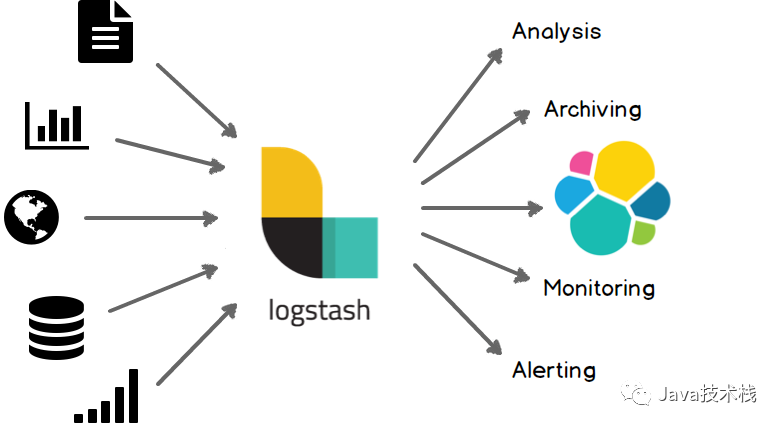
集中、轉(zhuǎn)換和存儲你的數(shù)據(jù)
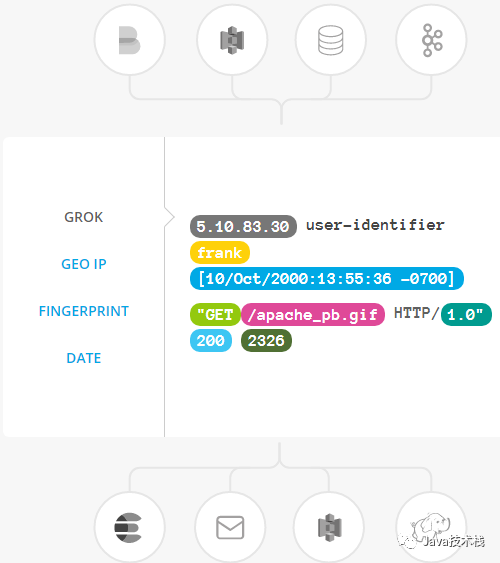
過濾器:實時解析和轉(zhuǎn)換數(shù)據(jù)
數(shù)據(jù)從源傳輸?shù)酱鎯斓倪^程中,Logstash 過濾器能夠解析各個事件,識別已命名的字段以構(gòu)建結(jié)構(gòu),并將它們轉(zhuǎn)換成通用格式,以便更輕松、更快速地分析和實現(xiàn)商業(yè)價值。
Logstash 能夠動態(tài)地轉(zhuǎn)換和解析數(shù)據(jù),不受格式或復雜度的影響:
利用 Grok 從非結(jié)構(gòu)化數(shù)據(jù)中派生出結(jié)構(gòu) 從 IP 地址破譯出地理坐標 將 PII 數(shù)據(jù)匿名化,完全排除敏感字段 整體處理不受數(shù)據(jù)源、格式或架構(gòu)的影響
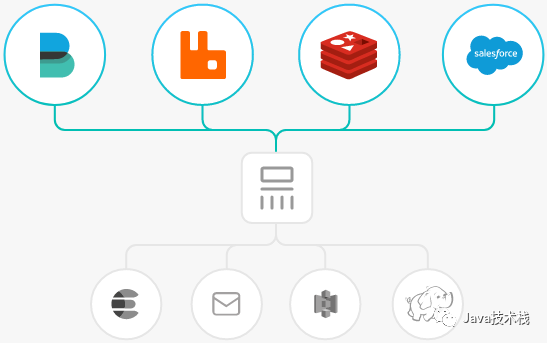
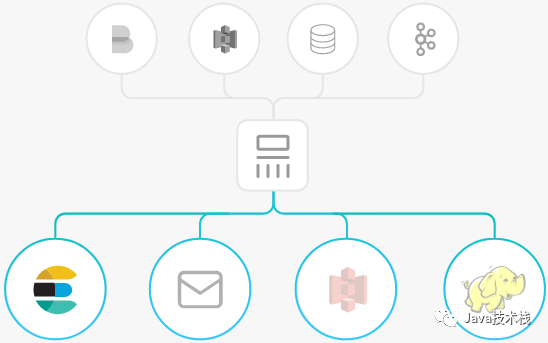
輸出:選擇你的存儲,導出你的數(shù)據(jù)
盡管 Elasticsearch 是我們的首選輸出方向,能夠為我們的搜索和分析帶來無限可能,但它并非唯一選擇。
Logstash 提供眾多輸出選擇,您可以將數(shù)據(jù)發(fā)送到您要指定的地方,并且能夠靈活地解鎖眾多下游用例。
安裝Logstash

首先,讓我們通過最基本的Logstash管道來測試一下剛才安裝的Logstash
Logstash管道有兩個必需的元素,輸入和輸出,以及一個可選元素過濾器。輸入插件從數(shù)據(jù)源那里消費數(shù)據(jù),過濾器插件根據(jù)你的期望修改數(shù)據(jù),輸出插件將數(shù)據(jù)寫入目的地。
接下來,允許Logstash最基本的管道,例如:
bin/logstash?-e?'input?{?stdin?{}?}?output?{?stdout?{}?}'
(畫外音:選項 -e 的意思是允許你從命令行指定配置)
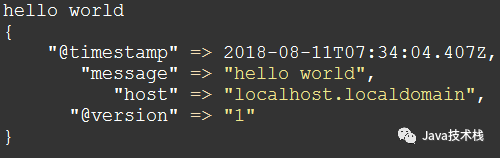
啟動以后,下面我們在命令行下輸入"hello world"
用Logstash解析日志
在上一小節(jié)中,你已經(jīng)創(chuàng)建了一個基本的Logstash管道來測試你的Logstash設(shè)置。在現(xiàn)實世界中,一個Logstash管理會稍微復雜一些:它通常有一個或多個input, filter 和 output 插件。
在這一小節(jié)中,你將創(chuàng)建一個Logstash管道,并且使用Filebeat將Apache Web日志作為input,解析這些日志,然后將解析的數(shù)據(jù)寫到一個Elasticsearch集群中。你將在配置文件中定義管道,而不是在命令行中定義管道配置。
推薦閱讀:京東把 Elasticsearch 用的真牛逼。
配置Filebeat來發(fā)送日志行到Logstash
在你創(chuàng)建Logstash管道之前,你需要先配置Filebeat來發(fā)送日志行到Logstash。Filebeat客戶端是一個輕量級的、資源友好的工具,它從服務器上的文件中收集日志,并將這些日志轉(zhuǎn)發(fā)到你的Logstash實例以進行處理。Filebeat設(shè)計就是為了可靠性和低延遲。Filebeat在主機上占用的資源很少,而且Beats input插件將對Logstash實例的資源需求降到最低。
(畫外音:注意,在一個典型的用例中,F(xiàn)ilebeat和Logstash實例是分開的,它們分別運行在不同的機器上。在本教程中,Logstash和Filebeat在同一臺機器上運行。)
第1步:配置filebeat.yml
filebeat.inputs:
-?type:?log
??paths:
????-?/usr/local/programs/logstash/logstash-tutorial.log

output.logstash:
??hosts:?["localhost:5044"]
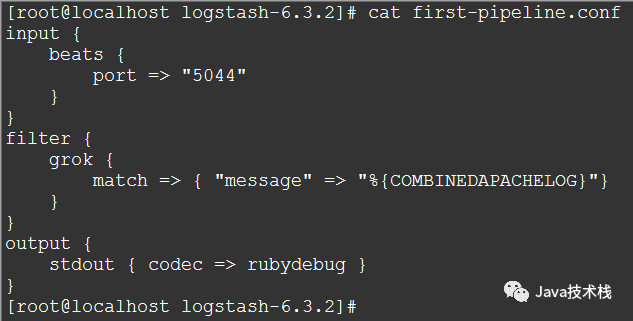
第2步:在logstash安裝目錄下新建一個文件first-pipeline.conf
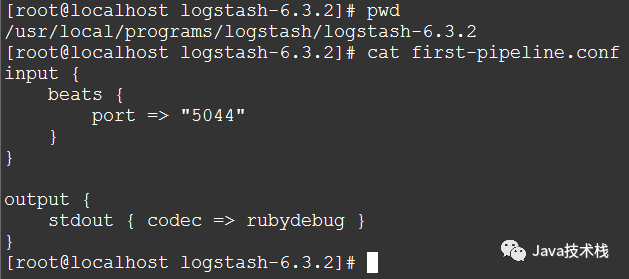
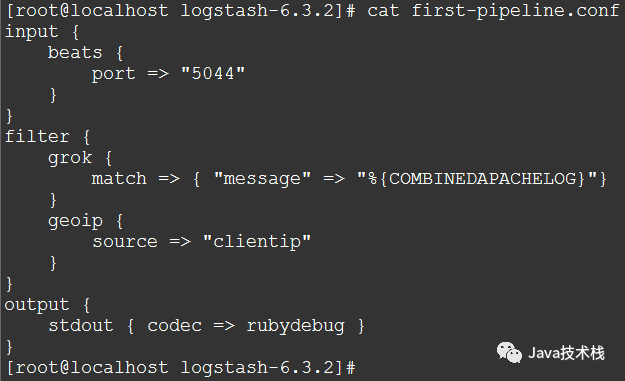
(畫外音:剛才說過了通常Logstash管理有三部分(輸入、過濾器、輸出),這里input下面beats { port => "5044" }的意思是用Beats輸入插件,而stdout { codec => rubydebug }的意思是輸出到控制臺)
第3步:檢查配置并啟動Logstash
bin/logstash?-f?first-pipeline.conf?--config.test_and_exit
(畫外音:--config.test_and_exit選項的意思是解析配置文件并報告任何錯誤)
bin/logstash?-f?first-pipeline.conf?--config.reload.automatic
(畫外音:--config.reload.automatic選項的意思是啟用自動配置加載,以至于每次你修改完配置文件以后無需停止然后重啟Logstash)
第4步:啟動filebeat
./filebeat?-e?-c?filebeat.yml?-d?"publish"
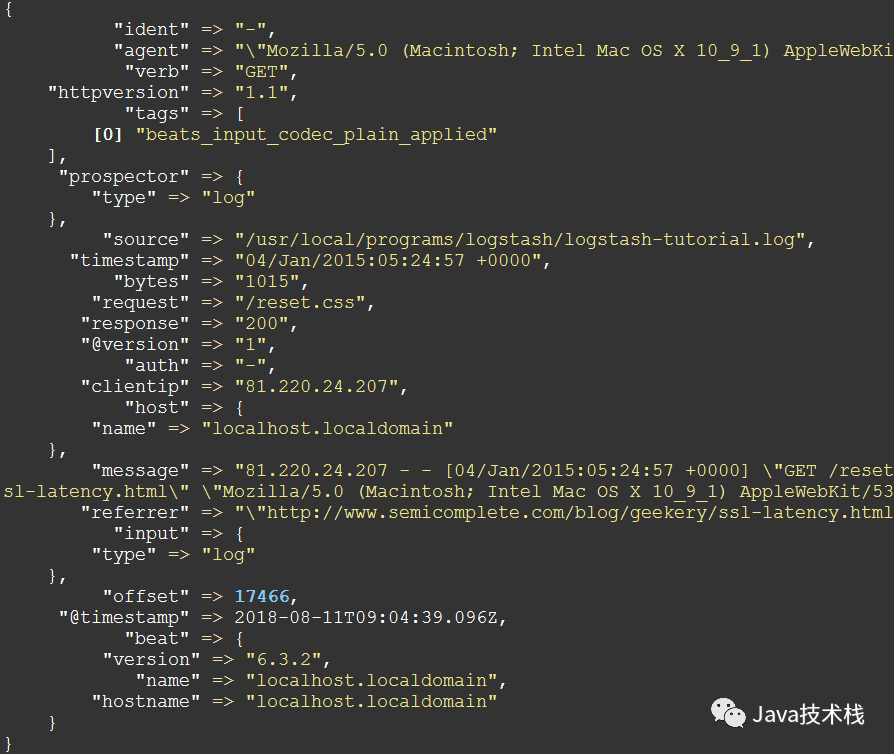
如果一切正常,你將會在Logstash控制臺下看到類似這樣的輸出:
用Grok過濾器插件解析日志
現(xiàn)在你有了一個工作管道,可以從Filebeat讀取日志行。但是你可能已經(jīng)注意到日志消息的格式并不理想。你想要解析日志消息,以便從日志中創(chuàng)建特定的、命名的字段。為此,您將使用grok filter插件。
grok 過濾器插件是Logstash中默認可用的幾個插件之一。
grok 過濾器插件允許你將非結(jié)構(gòu)化日志數(shù)據(jù)解析為結(jié)構(gòu)化和可查詢的數(shù)據(jù)。
因為 grok 過濾器插件在傳入的日志數(shù)據(jù)中查找模式
為了解析數(shù)據(jù),你可以用 %{COMBINEDAPACHELOG} grok pattern ,這種模式(或者說格式)的schema如下:
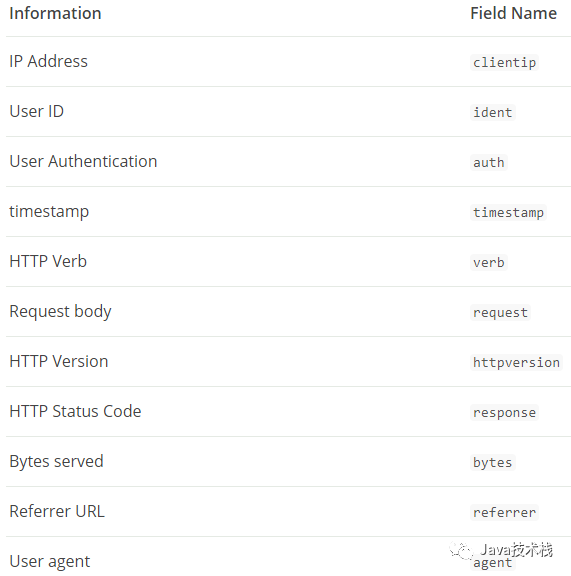
接下來,編輯first-pipeline.conf文件,加入grok filter,在你修改完以后這個文件看起來應該是這樣的:
在你保存完以后,因為你已經(jīng)啟動了自動加載配置,所以你不需要重啟Logstash來應用你的修改。但是,你確實需要強制Filebeat從頭讀取日志文件。為了這樣做,你需要在終端先按下Ctrl+C停掉Filebeat,然后刪除Filebeat注冊文件。例如:
rm?data/registr
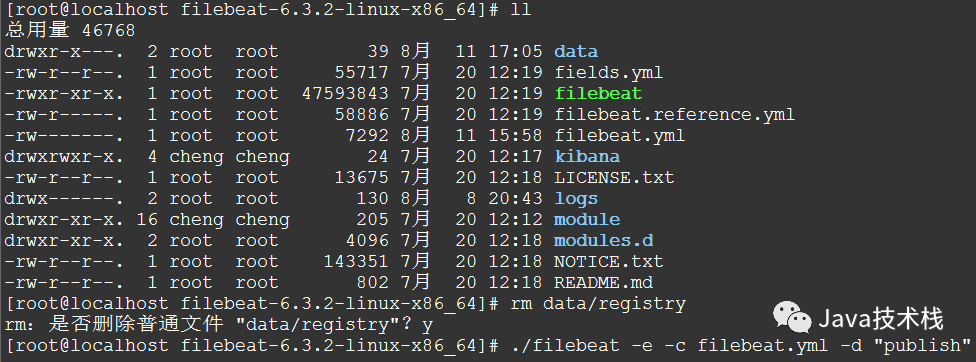
然后重啟Filebeat
./filebeat?-e?-c?filebeat.yml?-d?"publish"
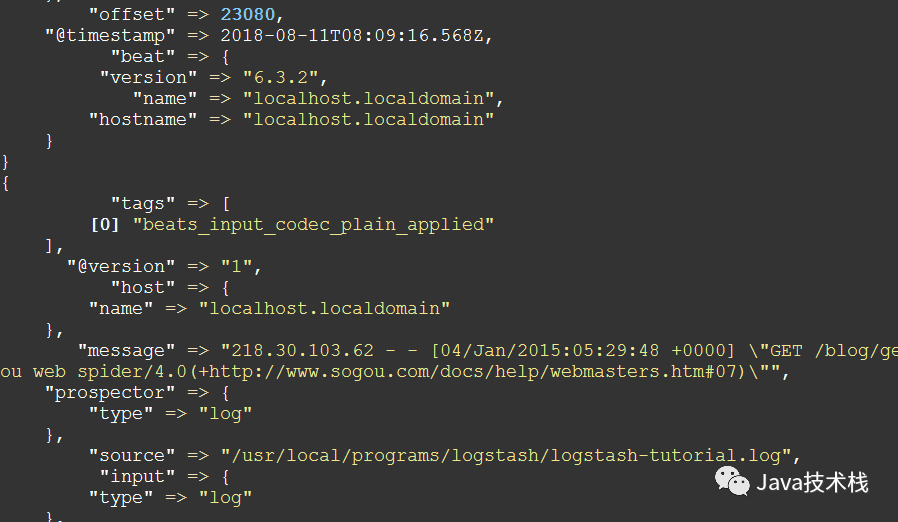
此時,再看Logstash控制臺,輸出可能是這樣的:
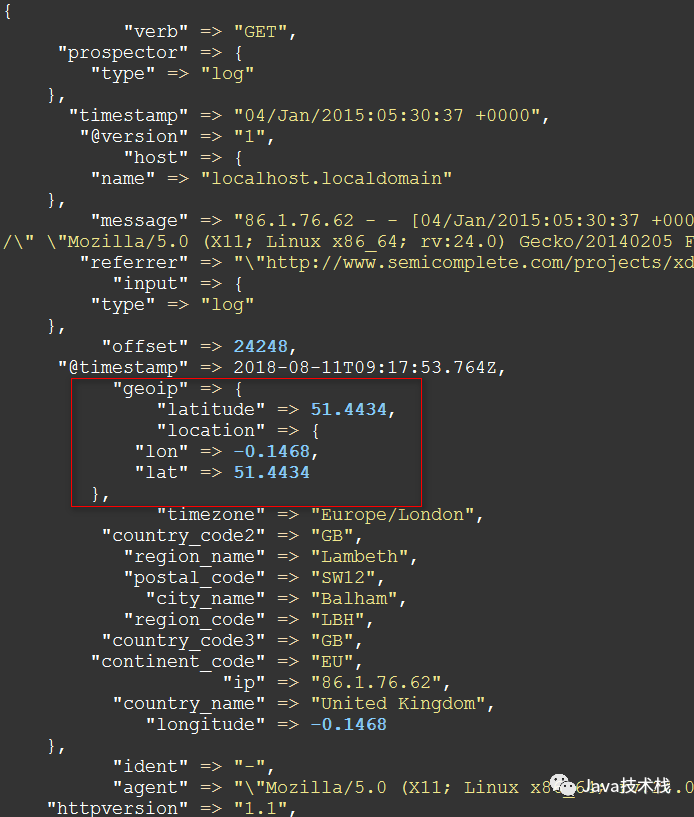
用 Geoip 過濾器插件增強你的數(shù)據(jù)
然后,同樣地,重啟Filebeat
Ctrl+C

rm?data/registry

./filebeat?-e?-c?filebeat.yml?-d?"publish"
再次查看Logstash控制臺,我們會發(fā)現(xiàn)多了地理位置信息:
索引你的數(shù)據(jù)到Elasticsearch
在之前的配置中,我們配置了Logstash輸出到控制臺,現(xiàn)在我們讓它輸出到Elasticsearch集群。另外,關(guān)注公眾號Java技術(shù)棧,在后臺回復:面試,可以獲取我整理的 Java 系列面試題和答案。
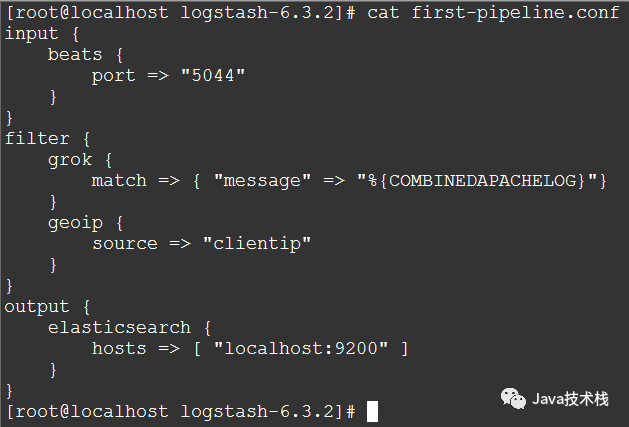
編輯first-pipeline.conf文件,替換output區(qū)域為:
output?{
????elasticsearch?{
????????hosts?=>?[?"localhost:9200"?]
????}
}
在這段配置中,Logstash用http協(xié)議連接到Elasticsearch,而且假設(shè)Logstash和Elasticsearch允許在同一臺機器上。你也可以指定一個遠程的Elasticsearch實例,比如host=>["es-machine:9092"]
現(xiàn)在,first-pipeline.conf文件是這樣的:
同樣,保存改變以后,重啟Filebeat
(畫外音:首先,Ctrl+C終止Filebeat;接著rm data/registry刪除注冊文件;最后,./filebeat -e -c filebeat.yml -d "publish" 啟動Filebeat)
好了,接下來啟動Elasticsearch
(畫外音:查看Elasticsearch索引,如果沒有看到logstash的索引,那么重啟Filebeat和Logstash,重啟之后應該就可以看到了)
如果一切正常的話,可以在Elasticsearch的控制臺日志中看到這樣的輸出:
[2018-08-11T17:35:27,871][INFO?][o.e.c.m.MetaDataIndexTemplateService]?[Px524Ts]?adding?template?[logstash]?for?index?patterns?[logstash-*]
[2018-08-11T17:46:13,311][INFO?][o.e.c.m.MetaDataCreateIndexService]?[Px524Ts]?[logstash-2018.08.11]?creating?index,?cause?[auto(bulk?api)],?templates?[logstash],?shards?[5]/[1],?mappings?[_default_]
[2018-08-11T17:46:13,549][INFO?][o.e.c.m.MetaDataMappingService]?[Px524Ts]?[logstash-2018.08.11/pzcVdNxSSjGzaaM9Ib_G_w]?create_mapping?[doc]
[2018-08-11T17:46:13,722][INFO?][o.e.c.m.MetaDataMappingService]?[Px524Ts]?[logstash-2018.08.11/pzcVdNxSSjGzaaM9Ib_G_w]?update_mapping?[doc]
這個時候,我們再查看Elasticsearch的索引
請求:
curl?'localhost:9200/_cat/indices?v'
響應:
health?status?index?????????????????????uuid???????????????????pri?rep?docs.count?docs.deleted?store.size?pri.store.size
yellow?open???bank??????????????????????59jD3B4FR8iifWWjrdMzUg???5???1???????1000????????????0????475.1kb????????475.1kb
green??open???.kibana???????????????????DzGTSDo9SHSHcNH6rxYHHA???1???0????????153???????????23????216.8kb????????216.8kb
yellow?open???filebeat-6.3.2-2018.08.08?otgYPvsgR3Ot-2GDcw_Upg???3???1????????255????????????0?????63.7kb?????????63.7kb
yellow?open???customer??????????????????DoM-O7QmRk-6f3Iuls7X6Q???5???1??????????1????????????0??????4.5kb??????????4.5kb
yellow?open???logstash-2018.08.11???????pzcVdNxSSjGzaaM9Ib_G_w???5???1????????100????????????0????251.8kb????????251.8kb
可以看到有一個名字叫"logstash-2018.08.11"的索引,其它的索引都是之前建的不用管
接下來,查看這個索引下的文檔
請求:
curl?-X?GET?'localhost:9200/logstash-2018.08.11/_search?pretty&q=response=200'
響應大概是這樣的:
(畫外音:由于輸出太長了,這里截取部分)
{
????"_index"?:?"logstash-2018.08.11",
????"_type"?:?"doc",
????"_id"?:?"D_JhKGUBOuOlYJNtDfwl",
????"_score"?:?0.070617564,
????"_source"?:?{
??????"host"?:?{
????????"name"?:?"localhost.localdomain"
??????},
??????"httpversion"?:?"1.1",
??????"ident"?:?"-",
??????"message"?:?"83.149.9.216?-?-?[04/Jan/2015:05:13:42?+0000]?\"GET?/presentations/logstash-monitorama-2013/images/kibana-search.png?HTTP/1.1\"?200?203023?\"http://semicomplete.com/presentations/logstash-monitorama-2013/\"?\"Mozilla/5.0?(Macintosh;?Intel?Mac?OS?X?10_9_1)?AppleWebKit/537.36?(KHTML,?like?Gecko)?Chrome/32.0.1700.77?Safari/537.36\"",
??????"auth"?:?"-",
??????"timestamp"?:?"04/Jan/2015:05:13:42?+0000",
??????"input"?:?{
????????"type"?:?"log"
??????},
??????"geoip"?:?{
????????"postal_code"?:?"101194",
????????"region_name"?:?"Moscow",
????????"timezone"?:?"Europe/Moscow",
????????"continent_code"?:?"EU",
????????"city_name"?:?"Moscow",
????????"country_code3"?:?"RU",
????????"country_name"?:?"Russia",
????????"ip"?:?"83.149.9.216",
????????"country_code2"?:?"RU",
????????"region_code"?:?"MOW",
????????"latitude"?:?55.7485,
????????"longitude"?:?37.6184,
????????"location"?:?{
??????????"lon"?:?37.6184,
??????????"lat"?:?55.7485
????????}
??????},
??????"@timestamp"?:?"2018-08-11T09:46:10.209Z",
??????"offset"?:?0,
??????"tags"?:?[
????????"beats_input_codec_plain_applied"
??????],
??????"beat"?:?{
????????"version"?:?"6.3.2",
????????"hostname"?:?"localhost.localdomain",
????????"name"?:?"localhost.localdomain"
??????},
??????"clientip"?:?"83.149.9.216",
??????"@version"?:?"1",
??????"verb"?:?"GET",
??????"request"?:?"/presentations/logstash-monitorama-2013/images/kibana-search.png",
??????"prospector"?:?{
????????"type"?:?"log"
??????},
??????"referrer"?:?"\"http://semicomplete.com/presentations/logstash-monitorama-2013/\"",
??????"response"?:?"200",
??????"bytes"?:?"203023",
??????"source"?:?"/usr/local/programs/logstash/logstash-tutorial.log",
??????"agent"?:?"\"Mozilla/5.0?(Macintosh;?Intel?Mac?OS?X?10_9_1)?AppleWebKit/537.36?(KHTML,?like?Gecko)?Chrome/32.0.1700.77?Safari/537.36\""
????}
??}
再來一個
請求:
curl?-XGET?'localhost:9200/logstash-2018.08.11/_search?pretty&q=geoip.city_name=Buffalo'
響應:
{
??"took"?:?37,
??"timed_out"?:?false,
??"_shards"?:?{
????"total"?:?5,
????"successful"?:?5,
????"skipped"?:?0,
????"failed"?:?0
??},
??"hits"?:?{
????"total"?:?2,
????"max_score"?:?2.6855774,
????"hits"?:?[
??????{
????????"_index"?:?"logstash-2018.08.11",
????????"_type"?:?"doc",
????????"_id"?:?"DvJhKGUBOuOlYJNtDPw7",
????????"_score"?:?2.6855774,
????????"_source"?:?{
??????????"host"?:?{
????????????"name"?:?"localhost.localdomain"
??????????},
??????????"httpversion"?:?"1.1",
??????????"ident"?:?"-",
??????????"message"?:?"198.46.149.143?-?-?[04/Jan/2015:05:29:13?+0000]?\"GET?/blog/geekery/solving-good-or-bad-problems.html?utm_source=feedburner&utm_medium=feed&utm_campaign=Feed%3A+semicomplete%2Fmain+%28semicomplete.com+-+Jordan+Sissel%29?HTTP/1.1\"?200?10756?\"-\"?\"Tiny?Tiny?RSS/1.11?(http://tt-rss.org/)\"",
??????????"auth"?:?"-",
??????????"timestamp"?:?"04/Jan/2015:05:29:13?+0000",
??????????"input"?:?{
????????????"type"?:?"log"
??????????},
??????????"geoip"?:?{
????????????"postal_code"?:?"14202",
????????????"region_name"?:?"New?York",
????????????"timezone"?:?"America/New_York",
????????????"continent_code"?:?"NA",
????????????"city_name"?:?"Buffalo",
????????????"country_code3"?:?"US",
????????????"country_name"?:?"United?States",
????????????"ip"?:?"198.46.149.143",
????????????"dma_code"?:?514,
????????????"country_code2"?:?"US",
????????????"region_code"?:?"NY",
????????????"latitude"?:?42.8864,
????????????"longitude"?:?-78.8781,
????????????"location"?:?{
??????????????"lon"?:?-78.8781,
??????????????"lat"?:?42.8864
????????????}
??????????},
??????????"@timestamp"?:?"2018-08-11T09:46:10.254Z",
??????????"offset"?:?22795,
??????????"tags"?:?[
????????????"beats_input_codec_plain_applied"
??????????],
??????????"beat"?:?{
????????????"version"?:?"6.3.2",
????????????"hostname"?:?"localhost.localdomain",
????????????"name"?:?"localhost.localdomain"
??????????},
??????????"clientip"?:?"198.46.149.143",
??????????"@version"?:?"1",
??????????"verb"?:?"GET",
??????????"request"?:?"/blog/geekery/solving-good-or-bad-problems.html?utm_source=feedburner&utm_medium=feed&utm_campaign=Feed%3A+semicomplete%2Fmain+%28semicomplete.com+-+Jordan+Sissel%29",
??????????"prospector"?:?{
????????????"type"?:?"log"
??????????},
??????????"referrer"?:?"\"-\"",
??????????"response"?:?"200",
??????????"bytes"?:?"10756",
??????????"source"?:?"/usr/local/programs/logstash/logstash-tutorial.log",
??????????"agent"?:?"\"Tiny?Tiny?RSS/1.11?(http://tt-rss.org/)\""
????????}
??????},
。。。
命令行啟動Logstash
為了從命令行啟動Logstash,用下面的命令:
bin/logstash?[options]
下面的例子展示了啟動Logstash,并制定配置定義在mypipeline.conf文件中:
bin/logstash?-f?mypipeline.conf
在命令行中設(shè)置的任何標志都會覆蓋logstash.yml中的相應設(shè)置。但是文件本身的內(nèi)容沒有改變。
Command-Line Flags
--node.name NAME
指定Logstash實例的名字。如果沒有指定的話,默認是當前主機名。
-f, --path.config CONFIG_PATH
從指定的文件或者目錄加載Logstash配置。如果給定的是一個目錄,則該目錄中的所有文件將以字典順序連接,然后作為一個配置文件進行解析。
-e, --config.string CONFIG_STRING
用給定的字符串作為配置數(shù)據(jù),語法和配置文件中是一樣的。
--modules
運行的模塊名字
-l, --path.logs PATH
Logstash內(nèi)部日志輸出目錄
--log.level LEVEL
日志級別
-t, --config.test_and_exit
檢查配置語法是否正確并退出
-r, --config.reload.automatic
監(jiān)視配置文件的改變,并且當配置文件被修改以后自動重新加載配置文件。
-config.reload.interval RELOAD_INTERVAL
為了檢查配置文件是否改變,而拉去配置文件的頻率。默認3秒。
--http.host HTTP_HOST
Web API綁定的主機。REST端點綁定的地址。默認是"127.0.0.1"
--http.port HTTP_PORT
Web API http端口。REST端點綁定的端口。默認是9600-9700之間。
--log.format FORMAT
指定Logstash寫它自身的使用JSON格式還是文本格式。默認是"plain"。
--path.settings SETTINGS_DIR
設(shè)置包含logstash.yml配置文件的目錄,比如log4j日志配置。也可以設(shè)置LS_SETTINGS_DIR環(huán)境變量。默認的配置目錄是在Logstash home目錄下。
-h, --help
打印幫助
好了,關(guān)于Logstash介紹暫時先寫這么多吧!感謝用心的自己!!!


關(guān)注Java技術(shù)棧看更多干貨