
Prometheus Operator 對(duì)接 Thanos

前面我們使用 Prometheus Operator 來(lái)進(jìn)行監(jiān)控,在 Prometheus 高可用的章節(jié)中也手動(dòng)部署了 Thanos,Prometheus Operator 中提供了 ThanosRuler 這樣的 CRD 組件,但是如果使用 Prometheus Operator 部署整個(gè)監(jiān)控服務(wù)的話,其他 Thanos 組件(比如 Querier、Store 等)需要單獨(dú)配置,Thanos 和 Prometheus 進(jìn)行對(duì)接是通過(guò) Sidecar 組件完成的,而在 Prometheus 的 CRD 中就提供了對(duì) Sidecar 組件的配置屬性,該 Sidecar 可以連接到 Thanos Querier,還可以選擇備份對(duì)象存儲(chǔ)中的數(shù)據(jù)。
Thanos 的整個(gè)架構(gòu)圖如下所示:
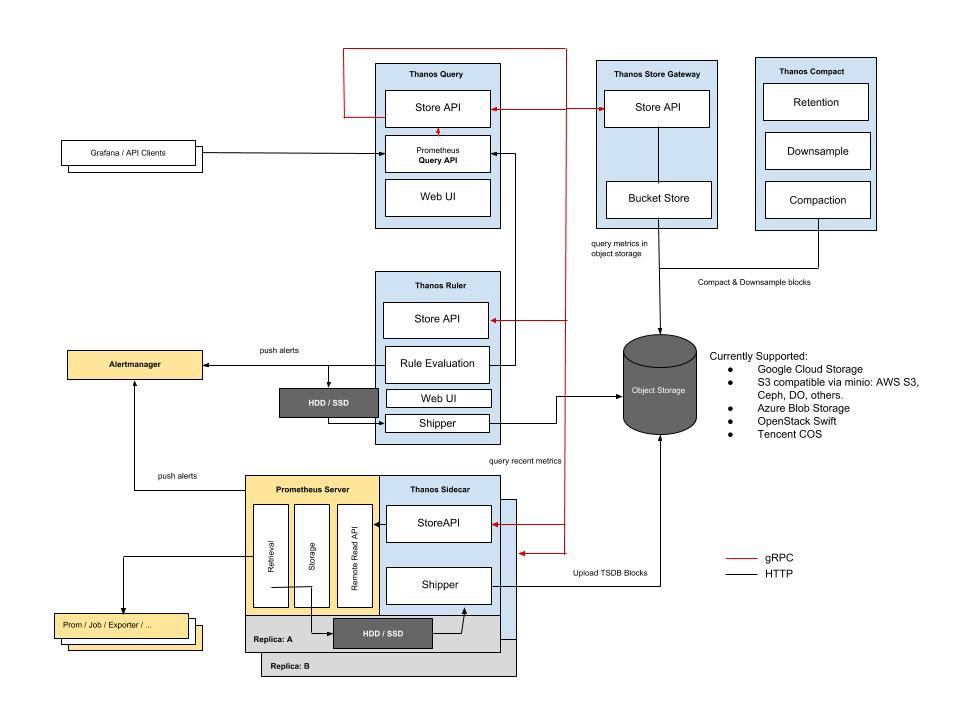
Thanos Sidecar
要使用 Prometheus Operator 來(lái)對(duì)接 Thanos,可以直接查看 Prometheus 這個(gè) CRD 的相關(guān)屬性:
$ kubectl explain prometheus.spec.thanos
......
現(xiàn)階段 Prometheus CRD 里面對(duì)接 Thanos 的方式是一個(gè)實(shí)驗(yàn)特性,所以如果你是在生產(chǎn)環(huán)境要使用的話需要注意,可能后續(xù)版本就變動(dòng)了,這里我們可以直接通過(guò) thanos 屬性來(lái)指定使用的鏡像版本,以及對(duì)應(yīng)的對(duì)象存儲(chǔ)配置,這里我們?nèi)匀皇褂?minio 來(lái)做對(duì)象存儲(chǔ)(部署參考前面章節(jié)),首先登錄 MinIO 創(chuàng)建一個(gè) thanos 的 bucket。然后創(chuàng)建一個(gè)對(duì)象存儲(chǔ)配置文件:
# thanos-storage-minio.yaml
type: s3
config:
  bucket: thanos # bucket 名稱
  endpoint: minio.default.svc.cluster.local:9000 # minio 訪問(wèn)地址
  access_key: minio
  secret_key: minio123
  insecure: true
  signature_version2: false
使用上面的配置文件來(lái)創(chuàng)建一個(gè) Secret 對(duì)象:
$ kubectl create secret generic thanos-objectstorage --from-file=thanos.yaml=thanos-storage-minio.yaml -n monitoring
secret/thanos-objectstorage created
對(duì)象存儲(chǔ)的配置準(zhǔn)備好過(guò)后,接下來(lái)我們就可以在 Prometheus CRD 中添加對(duì)應(yīng)的 Thanos 配置了,完整的資源對(duì)象如下所示:
apiVersion: monitoring.coreos.com/v1
kind: Prometheus # crd 類型,表示資源對(duì)象,類似于Pod、Deployment,就是用來(lái)管理部署Prometheus應(yīng)用的
metadata:
  labels:
    prometheus: k8s
  name: k8s
  namespace: monitoring
spec:
  alerting:
    alertmanagers:
      - name: alertmanager-main
        namespace: monitoring
        port: web
  image: prom/prometheus:v2.26.0
  nodeSelector:
    kubernetes.io/os: linux
  podMonitorNamespaceSelector: {}
  podMonitorSelector: {}
  probeNamespaceSelector: {}
  probeSelector: {}
  replicas: 2
  resources:
    requests:
      memory: 400Mi
  ruleSelector: # 用來(lái)匹配rule規(guī)則的selector
    matchLabels: # 匹配的是具有下面兩個(gè)標(biāo)簽的PrometheusRule這個(gè)資源對(duì)象
      prometheus: k8s
      role: alert-rules
  securityContext:
    fsGroup: 2000
    runAsNonRoot: true
    runAsUser: 1000
  serviceAccountName: prometheus-k8s
  serviceMonitorNamespaceSelector: {}
  serviceMonitorSelector: {}
  version: v2.26.0
  additionalScrapeConfigs:
    key: prometheus-additional.yaml
    name: additional-configs
  thanos: # 添加 thanos 配置
    image: thanosio/thanos:v0.18.0
    resources:
      limits:
        cpu: 500m
        memory: 500Mi
      requests:
        cpu: 100m
        memory: 500Mi
    objectStorageConfig:
      key: thanos.yaml
      name: thanos-objectstorage
  # storage:
  #   volumeClaimTemplate:
  #     spec:
  #       storageClassName: rook-ceph-block  # 指定storageclass(別用nfs做存儲(chǔ))
  #       resources:
  #         requests:
  #           storage: 20Gi
然后直接更新即可:
$ kubectl apply -f prometheus-prometheus.yaml
prometheus.monitoring.coreos.com/k8s configured
更新完成后我們?cè)俅尾榭锤潞蟮?Prometheus Pod,可以發(fā)現(xiàn)已經(jīng)變成了 3 個(gè)容器了:
$ kubectl get pods -n monitoring -l app=prometheus
NAME               READY   STATUS    RESTARTS   AGE
prometheus-k8s-0   3/3     Running   1          117s
prometheus-k8s-1   3/3     Running   1          2m41s
把生成的資源對(duì)象導(dǎo)出來(lái)查看驗(yàn)證下:
$ kubectl get sts -n monitoring prometheus-k8s -o yaml
- args:  # sidecar 容器
  - sidecar
  - --prometheus.url=http://localhost:9090/
  - --grpc-address=[$(POD_IP)]:10901
  - --http-address=[$(POD_IP)]:10902
  - --objstore.config=$(OBJSTORE_CONFIG)
  - --tsdb.path=/prometheus
  env:
  - name: POD_IP
    valueFrom:
      fieldRef:
        apiVersion: v1
        fieldPath: status.podIP
  - name: OBJSTORE_CONFIG
    valueFrom:
      secretKeyRef:
        key: thanos.yaml
        name: thanos-objectstorage
  image: thanosio/thanos:v0.18.0
  imagePullPolicy: IfNotPresent
  name: thanos-sidecar
  ports:
  - containerPort: 10902
    name: http
    protocol: TCP
  - containerPort: 10901
    name: grpc
    protocol: TCP
......
可以看到在原來(lái)的基礎(chǔ)上新增了一個(gè) sidecar 容器,正常每 2 個(gè)小時(shí)會(huì)上傳一次數(shù)據(jù),查看 sidecar 可以查看到相關(guān)日志:
$ kubectl logs -f prometheus-k8s-0 -c thanos-sidecar -n monitoring
......
level=info ts=2021-04-14T01:48:22.292651206Z caller=sidecar.go:155 msg="successfully loaded prometheus external labels" external_labels="{prometheus=\"monitoring/k8s\", prometheus_replica=\"prometheus-k8s-0\"}"
level=info ts=2021-04-14T01:48:22.292687688Z caller=intrumentation.go:48 msg="changing probe status" status=ready
level=info ts=2021-04-14T04:48:54.276596974Z caller=shipper.go:334 msg="upload new block" id=01F37BB4A8EWDBN1AS25Z8MG5J
level=info ts=2021-04-14T05:00:24.275616176Z caller=shipper.go:334 msg="upload new block" id=01F37C07T9BS3744WKS8KEDZCS
Thanos Querier
Thanos Querier 組件提供了從所有 prometheus 實(shí)例中一次性檢索指標(biāo)的能力。它與原 prometheus 的 PromQL 和 HTTP API 是完全兼容的,所以同樣可以和 Grafana 一起使用。
因?yàn)?Querier 組件是要和 Sidecar 以及 Store 組件進(jìn)行對(duì)接的,所以在 Querier 組件的方向參數(shù)中需要配置上上面我們啟動(dòng)的 Thanos Sidecar,同樣我們可以通過(guò)對(duì)應(yīng)的 Headless Service 來(lái)進(jìn)行發(fā)現(xiàn),自動(dòng)創(chuàng)建的 Service 名為 prometheus-operated(可以通過(guò) Statefulset 查看):
$ kubectl describe svc -n monitoring prometheus-operated
Name:              prometheus-operated
Namespace:         monitoring
Labels:            operated-prometheus=true
Annotations:       <none>
Selector:          app=prometheus
Type:              ClusterIP
IP:                None
Port:              web  9090/TCP
TargetPort:        web/TCP
Endpoints:         10.244.1.92:9090,10.244.2.89:9090
Port:              grpc  10901/TCP
TargetPort:        grpc/TCP
Endpoints:         10.244.1.92:10901,10.244.2.89:10901
Session Affinity:  None
Events:            <none>
Thanos Querier 組件完整的資源清單如下所示,需要注意的是 Prometheus Operator 部署的 prometheus 實(shí)例多副本的 external_labels 標(biāo)簽為 prometheus_replica:
# thanos-querier.yaml
apiVersion: apps/v1
kind: Deployment
metadata:
  name: thanos-querier
  namespace: monitoring
  labels:
    app: thanos-querier
spec:
  selector:
    matchLabels:
      app: thanos-querier
  template:
    metadata:
      labels:
        app: thanos-querier
    spec:
      containers:
        - name: thanos
          image: thanosio/thanos:v0.18.0
          args:
            - query
            - --log.level=debug
            - --query.replica-label=prometheus_replica # prometheus-operator 里面配置的副本標(biāo)簽為 prometheus_replica
            # Discover local store APIs using DNS SRV.
            - --store=dnssrv+prometheus-operated:10901
          ports:
            - name: http
              containerPort: 10902
            - name: grpc
              containerPort: 10901
          resources:
            requests:
              memory: "2Gi"
              cpu: "1"
            limits:
              memory: "2Gi"
              cpu: "1"
          livenessProbe:
            httpGet:
              path: /-/healthy
              port: http
            initialDelaySeconds: 10
          readinessProbe:
            httpGet:
              path: /-/healthy
              port: http
            initialDelaySeconds: 15
---
apiVersion: v1
kind: Service
metadata:
  name: thanos-querier
  namespace: monitoring
  labels:
    app: thanos-querier
spec:
  ports:
    - port: 9090
      targetPort: http
      name: http
  selector:
    app: thanos-querier
---
apiVersion: traefik.containo.us/v1alpha1
kind: IngressRoute
metadata:
  name: thanos-querier
  namespace: monitoring
  labels:
    app: thanos-querier
spec:
  entryPoints:
    - web
  routes:
    - kind: Rule
      match: Host(`thanos.k8s.local`)
      services:
        - kind: Service
          name: thanos-querier
          port: 9090
直接創(chuàng)建上面的資源對(duì)象即可:
$ kubectl apply -f thanos-querier.yaml
$ kubectl get pods -n monitoring -l app=thanos-querier
NAME                              READY   STATUS    RESTARTS   AGE
thanos-querier-69bb75c8cc-5g6t6   1/1     Running   0          105s
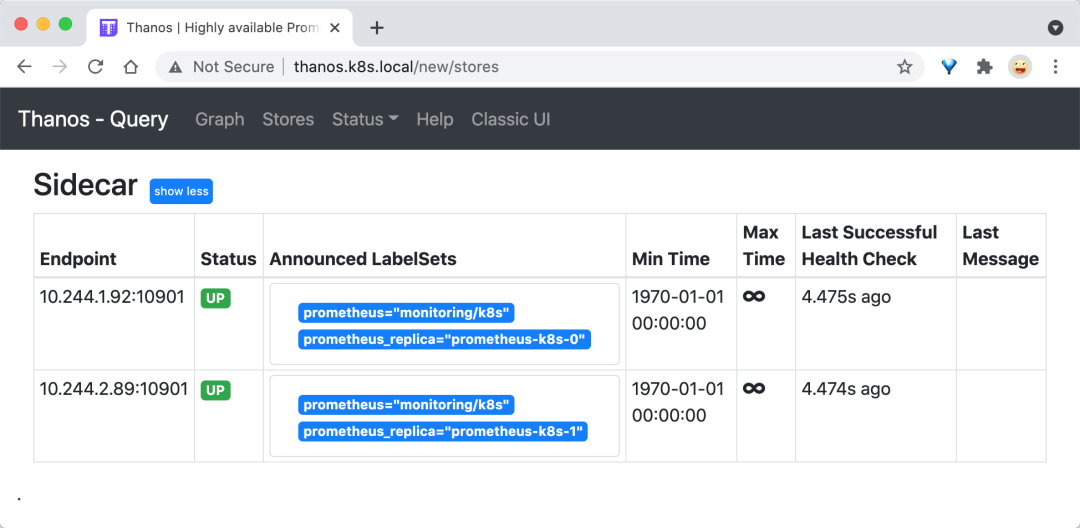
部署完成后我們可以在瀏覽器中打開(kāi) Querier 的頁(yè)面,查看已經(jīng)關(guān)聯(lián)上的 Stores:
比如在 Graph 頁(yè)面查詢 node_load1 指標(biāo),記住勾選上 Use Deduplication 用于去重查詢:

Thanos Store
接著需要部署 Thanos Store 組件,該組件和可以 Querier 組件一起協(xié)作從指定對(duì)象存儲(chǔ)的 bucket 中檢索歷史指標(biāo)數(shù)據(jù),所以自然在部署的時(shí)候我們需要指定對(duì)象存儲(chǔ)的配置,Store 組件配置完成后還需要加入到 Querier 組件里面去:
# thanos-store.yaml
apiVersion: apps/v1
kind: StatefulSet
metadata:
  name: thanos-store
  namespace: monitoring
  labels:
    app: thanos-store
spec:
  selector:
    matchLabels:
      app: thanos-store
  serviceName: thanos-store
  template:
    metadata:
      labels:
        app: thanos-store
    spec:
      containers:
        - name: thanos
          image: thanosio/thanos:v0.18.0
          args:
            - "store"
            - "--log.level=debug"
            - "--data-dir=/data"
            - "--objstore.config-file=/etc/secret/thanos.yaml"
            - "--index-cache-size=500MB"
            - "--chunk-pool-size=500MB"
          ports:
            - name: http
              containerPort: 10902
            - name: grpc
              containerPort: 10901
          livenessProbe:
            httpGet:
              port: 10902
              path: /-/healthy
            initialDelaySeconds: 10
          readinessProbe:
            httpGet:
              port: 10902
              path: /-/ready
            initialDelaySeconds: 15
          volumeMounts:
            - name: object-storage-config
              mountPath: /etc/secret
              readOnly: false
      volumes:
        - name: object-storage-config
          secret:
            secretName: thanos-objectstorage
---
apiVersion: v1
kind: Service
metadata:
  name: thanos-store
  namespace: monitoring
spec:
  type: ClusterIP
  clusterIP: None
  ports:
    - name: grpc
      port: 10901
      targetPort: grpc
  selector:
    app: thanos-store
直接部署上面的資源對(duì)象即可:
$ kubectl apply -f thanos-store.yaml
statefulset.apps/thanos-store created
service/thanos-store created
$ kubectl get pods -n monitoring -l app=thanos-store
NAME             READY   STATUS    RESTARTS   AGE
thanos-store-0   1/1     Running   0          106s
部署完成后為了讓 Querier 組件能夠發(fā)現(xiàn) Store 組件,我們還需要在 Querier 組件中增加 Store 組件的發(fā)現(xiàn):
containers:
  - name: thanos
    image: thanosio/thanos:v0.18.0
    args:
      - query
      - --log.level=debug
      - --query.replica-label=prometheus_replica
      # Discover local store APIs using DNS SRV.
      - --store=dnssrv+prometheus-operated:10901
      - --store=dnssrv+thanos-store:10901
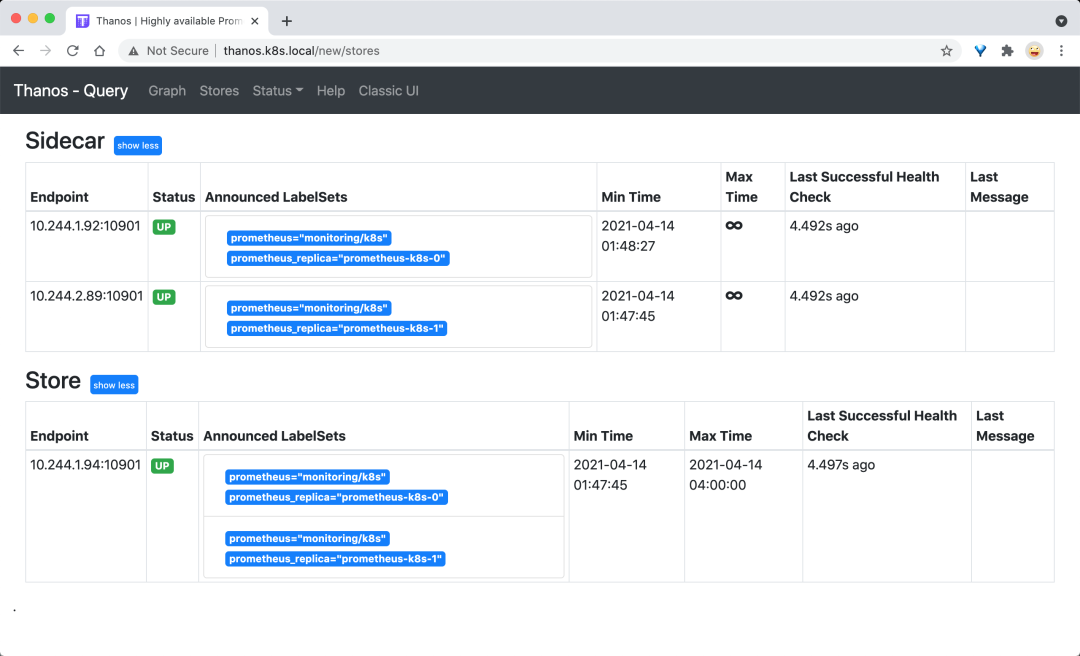
更新后再次前往 Querier 組件的頁(yè)面查看發(fā)現(xiàn)的 Store 組件正常會(huì)多一個(gè) Thanos Store 的組件。
Thanos Compactor
Thanos Compactor 組件可以對(duì)我們收集的歷史數(shù)據(jù)進(jìn)行下采樣,可以減少文件的大小。部署方式和之前沒(méi)什么太大的區(qū)別,主要也就是對(duì)接對(duì)象存儲(chǔ)。
# thanos-compactor
apiVersion: apps/v1
kind: StatefulSet
metadata:
  name: thanos-compactor
  namespace: monitoring
  labels:
    app: thanos-compactor
spec:
  selector:
    matchLabels:
      app: thanos-compactor
  serviceName: thanos-compactor
  template:
    metadata:
      labels:
        app: thanos-compactor
    spec:
      containers:
        - name: thanos
          image: thanosio/thanos:v0.18.0
          args:
            - "compact"
            - "--log.level=debug"
            - "--data-dir=/data"
            - "--objstore.config-file=/etc/secret/thanos.yaml"
            - "--wait"
          ports:
            - name: http
              containerPort: 10902
          livenessProbe:
            httpGet:
              port: 10902
              path: /-/healthy
            initialDelaySeconds: 10
          readinessProbe:
            httpGet:
              port: 10902
              path: /-/ready
            initialDelaySeconds: 15
          volumeMounts:
            - name: object-storage-config
              mountPath: /etc/secret
              readOnly: false
      volumes:
        - name: object-storage-config
          secret:
            secretName: thanos-objectstorage
同樣直接創(chuàng)建上面的資源對(duì)象即可:
kubectl apply -f thanos-compactor.yaml
最后如果想通過(guò) Thanos 的 Ruler 組件來(lái)配置報(bào)警規(guī)則,可以直接使用 Prometheus Operator 提供的 ThanosRuler 這個(gè) CRD 對(duì)象,不過(guò)還是推薦直接和單獨(dú)的 prometheus 實(shí)例配置報(bào)警規(guī)則,這樣調(diào)用鏈路更短,出現(xiàn)問(wèn)題的時(shí)候排查也更方便。Thanos Ruler 組件允許配置記錄和告警規(guī)則,跨越多個(gè) prometheus 實(shí)例進(jìn)行處理,一個(gè) ThanosRuler 實(shí)例至少需要一個(gè) queryEndpoint 指向 Thanos Queriers 或 prometheus 實(shí)例的位置,如下所示:
# ThanosRuler Demo
apiVersion: monitoring.coreos.com/v1
kind: ThanosRuler
metadata:
  name: thanos-ruler-demo
  labels:
    example: thanos-ruler
  namespace: monitoring
spec:
  image: thanosio/thanos
  ruleSelector:
    matchLabels: # 匹配 Rule 規(guī)則
      role: my-thanos-rules
  queryEndpoints: # querier 地址
    - dnssrv+_http._tcp.my-thanos-querier.monitoring.svc.cluster.local
ThanosRuler 組件使用的記錄和警報(bào)規(guī)則與 Prometheus 里面配置的 PrometheusRule 對(duì)象,比如上面的示例中,表示包含 role=my-thanos-rules 標(biāo)簽的 PrometheusRule 對(duì)象規(guī)則會(huì)被添加到 Thanos Ruler Pod 中去。
最后通過(guò) Prometheus Operator 對(duì)接上 Thanos 過(guò)后的所有資源對(duì)象如下所示:
$ kubectl get pods -n monitoring
NAME                                   READY   STATUS    RESTARTS   AGE
alertmanager-main-0                    2/2     Running   0          5h14m
alertmanager-main-1                    2/2     Running   0          5h14m
alertmanager-main-2                    2/2     Running   0          5h13m
dingtalk-hook-7c7c5559fd-kwfqk         1/1     Running   0          5h14m
grafana-f8cd57fcf-2q5h6                1/1     Running   0          5h14m
kube-state-metrics-587bfd4f97-pks8n    3/3     Running   0          5h14m
node-exporter-hzfwh                    2/2     Running   18         11d
node-exporter-kpd7q                    2/2     Running   12         5d22h
node-exporter-tbtfk                    2/2     Running   36         11d
prometheus-adapter-69b8496df6-cnhzn    1/1     Running   0          5h14m
prometheus-k8s-0                       3/3     Running   1          3h59m
prometheus-k8s-1                       3/3     Running   1          4h
prometheus-operator-7649c7454f-ls8wc   2/2     Running   0          5h14m
thanos-compactor-0                     1/1     Running   0          113m
thanos-querier-799845897-x4ljh         1/1     Running   0          128m
thanos-store-0                         1/1     Running   0          130m
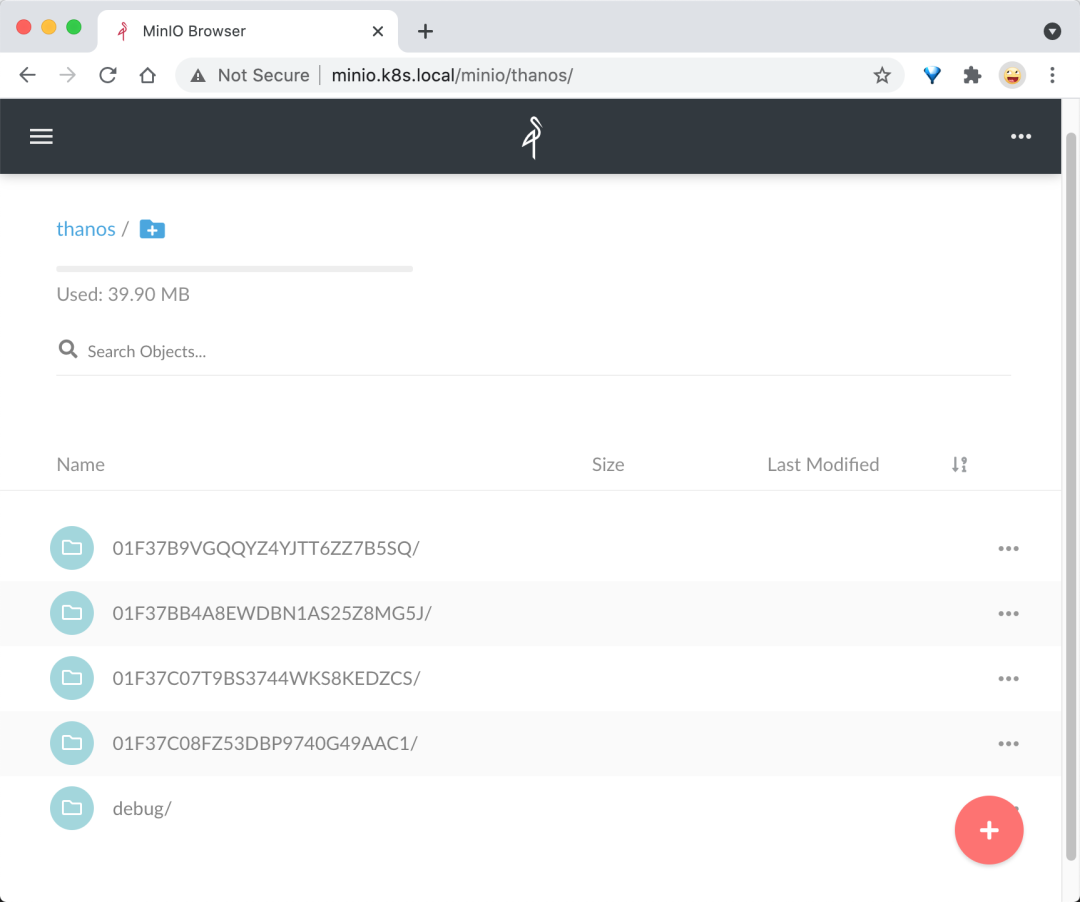
正常 minio 對(duì)象存儲(chǔ)上面也會(huì)有上傳的歷史數(shù)據(jù)了:
K8S 進(jìn)階訓(xùn)練營(yíng)

 點(diǎn)擊屏末 | 閱讀原文 | 即刻學(xué)習(xí)