
Python繪圖神器之matplotlib | 8個(gè)案例
Python繪圖
Author:zhenguo
From:Python與算法社區(qū)
? ??
使用版本
本文使用的 matplotlib 版本: 3.1.3
使用的 NumPy 版本: 1.18.1
順便說一句,matplotlib 的近親是 NumPy,對其的親緣性最好,無縫支持。官檔中說對Pandas數(shù)據(jù)結(jié)構(gòu)某些情況支持可能有問題,這點(diǎn)需要注意,可能出現(xiàn)非預(yù)期的結(jié)果。
1 兩套不同的繪圖API使用場景是怎樣的?
Matplotlib 構(gòu)建的繪圖體系是嚴(yán)謹(jǐn)?shù)模峁┗镜膬商桌L圖API:
基于 matplotlib.pyplot 模塊,優(yōu)點(diǎn):寫法簡潔,適用交互性強(qiáng),如Jupyter Notebook,一邊寫一邊出圖的場景;缺點(diǎn):不適宜在大項(xiàng)目中,構(gòu)建復(fù)雜的GUI圖形場景。
基于面向?qū)ο?OO)的API繪圖,需要自己手動(dòng)創(chuàng)建諸如,figure 對象,axes 對象,調(diào)用它們開放出的API,優(yōu)點(diǎn)定制能力更強(qiáng),適應(yīng)于大型項(xiàng)目,很多行腳本時(shí);缺點(diǎn):沒有pyplot那般簡潔。
2 分別如何使用這兩套API?
網(wǎng)上matplotlib的繪圖例子非常多,這篇文章我不想去羅列一個(gè)一個(gè)繪圖例子,而是想結(jié)合繪圖方法和例子,教會大家學(xué)會使用matplotlib的兩種繪圖體系,包括常用的API,以及如何調(diào)整屬性,直至把一幅圖做完美。
那么,先使用兩套繪圖方法,繪制一個(gè)簡單圖,重點(diǎn)體會它們書寫的不同。
使用第一種方法繪圖,即pyplot模塊,在極坐標(biāo)系下繪制一條螺旋線,完全使用pyplot模塊內(nèi)的方法:
#?創(chuàng)建figure
fig?=?plt.figure(dpi=120)
#?準(zhǔn)備好極坐標(biāo)系的數(shù)據(jù)
#?半徑為[0,1]
r?=?np.arange(0,?1,?0.001)
theta?=?2?*?2*np.pi?*?r
#?極坐標(biāo)下繪制
line,?=?plt.polar(theta,?r,?color='#ee8d18',?lw=3)
plt.show()
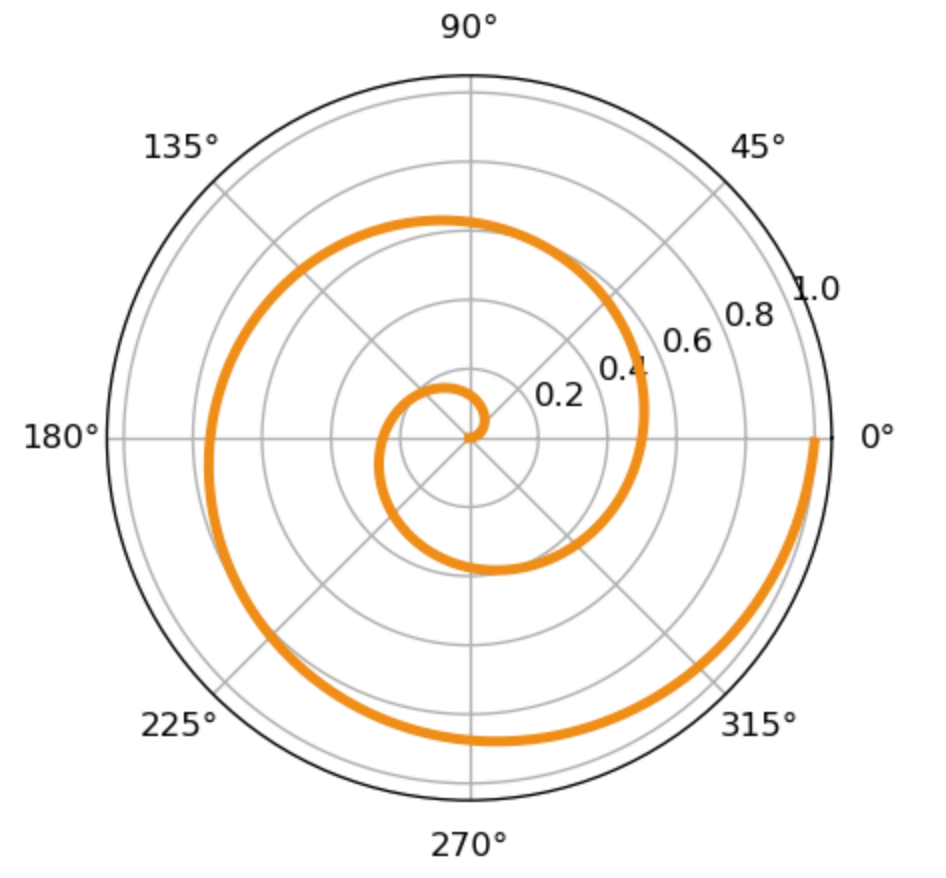
使用面向?qū)ο蟮姆椒ǎ{(diào)用axes對象同樣繪制出上圖:
fig?=?plt.figure(dpi=120)
#?添加一個(gè)坐標(biāo)系到figure中,返回這個(gè)坐標(biāo)系
ax?=?fig.add_subplot(111,?polar=True)
r?=?np.arange(0,?1,?0.001)
theta?=?2?*?2*np.pi?*?r
#?調(diào)用坐標(biāo)系ax對象內(nèi)的plot繪圖
#?而不是pyplot內(nèi)的plot
line,?=?ax.plot(theta,?r,?color='#ee8d18',?lw=3)
plt.show()
3 如何解剖圖中各個(gè)元素?
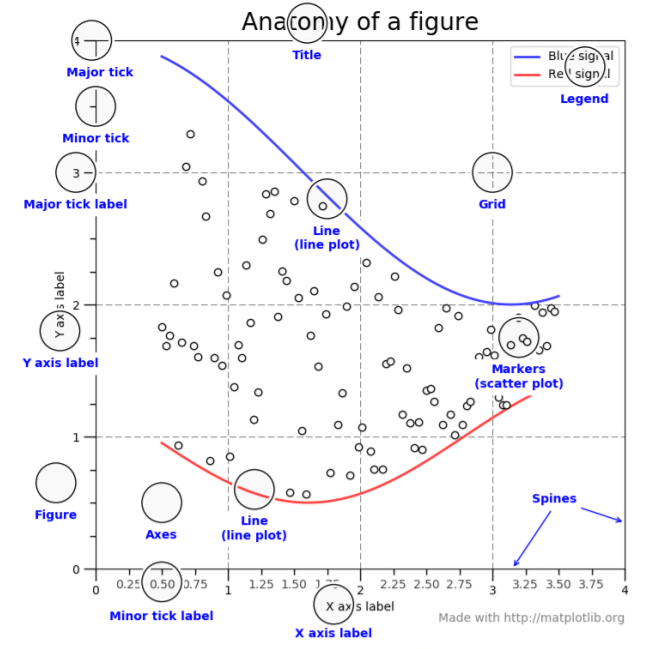
matplotlib 繪圖元素與我們上一個(gè)專題的繪圖入門介紹的元素基本對應(yīng),基本的元素包括:Figure(整個(gè)圖形),Axes(坐標(biāo)系),
主tick(major tick),次tick(minor tick),主tick的標(biāo)簽(major tick),次tick的標(biāo)簽(minor tick label),y軸標(biāo)簽(y axis label),線(line),標(biāo)題(title),網(wǎng)格(Grid),圖例(Legend),標(biāo)注點(diǎn)(Markers),
Spines 是連接軸刻度標(biāo)記的線,而且標(biāo)明了數(shù)據(jù)區(qū)域的邊界。
4 Figure 和 Axes 的關(guān)系是什么?
Figure 是所有繪圖元素的最頂層容器, 而 Axes 是 Figure 上的其中一個(gè)坐標(biāo)系,言外之意,一個(gè) Figure 能包括多個(gè) Axes!
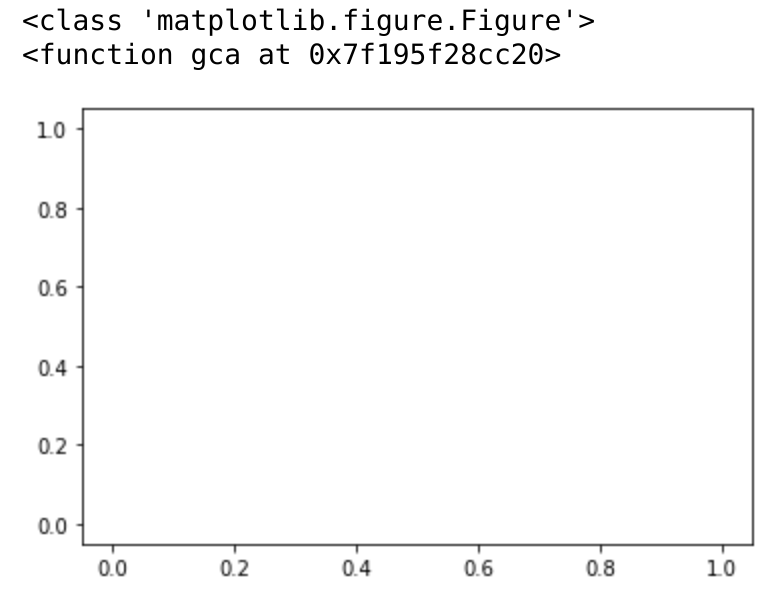
如下創(chuàng)建 Figure 時(shí),會默認(rèn)創(chuàng)建一個(gè) Axes
#?figure()?創(chuàng)建一個(gè)Figure對象
fig?=?plt.figure()
print(type(fig))
#?并且默認(rèn)創(chuàng)建一個(gè)坐標(biāo)系A(chǔ)xes
print(plt.gca)
plt.plot()
plt.show()
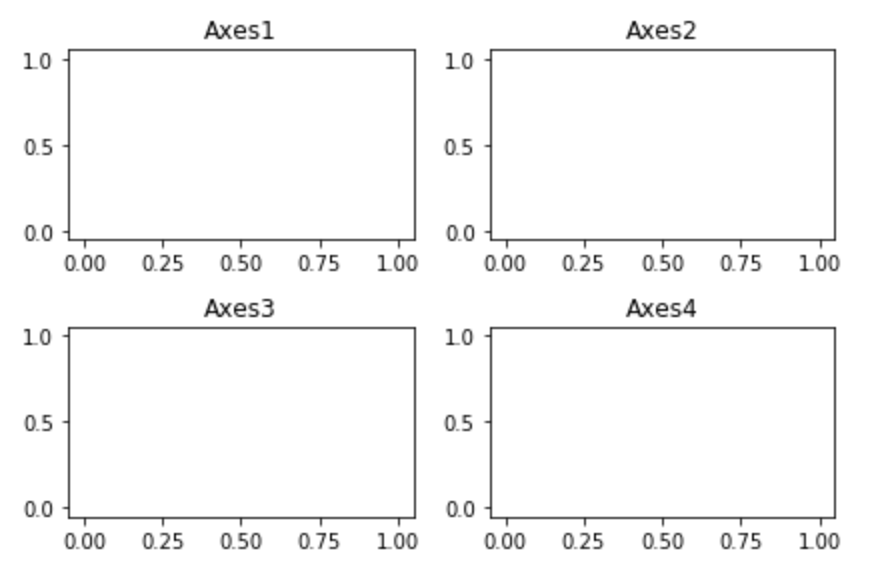
當(dāng)然我們也可以一個(gè) Figure 對象中包括多個(gè) Axes 對象,如下包括4個(gè):
fig?=?plt.figure()

for?i?in?range(1,5):
????ax?=?fig.add_subplot(220+i)
????ax.plot()
????plt.title('Axes'+str(i))

#?解決元素重疊問題
fig.tight_layout()
plt.show()
5 多圖時(shí)元素重疊如何解決?
正如上圖所示,matplotlib 有2個(gè)方法能自動(dòng)解決重疊問題,一個(gè)就是上面用到的tight_layout方法,再有一個(gè)subplots_adjust:
fig.subplots_adjust(0,0,1,1,hspace=0.5,wspace=0.5)
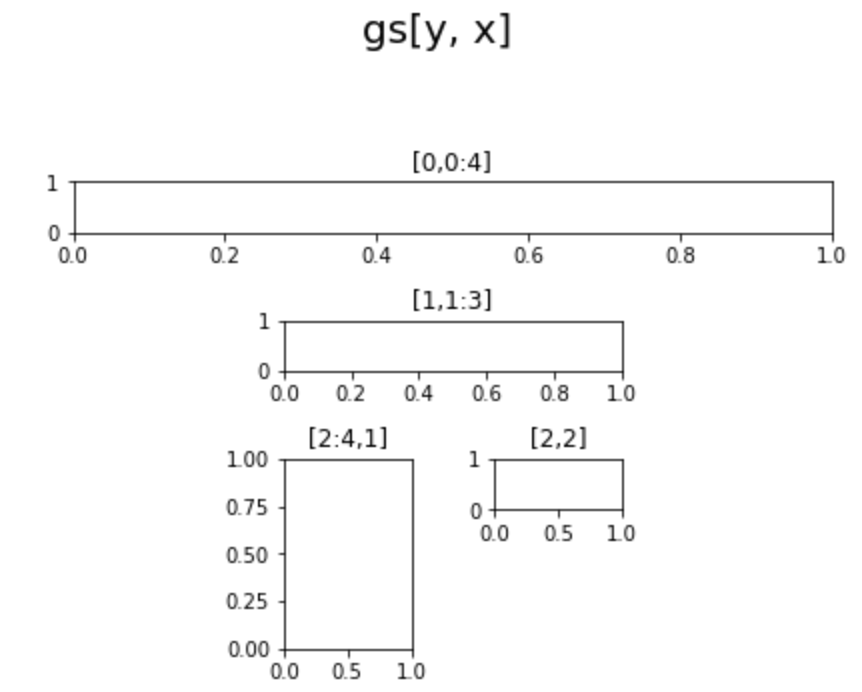
那么問題來了,如果實(shí)現(xiàn)更加雞血的布局,該如何做?借助 GridSpec,使用方法如下所示:
fig?=?plt.figure()

fig.suptitle("gs[y,?x]",?x=0.5,?y=1.2,?fontsize=20)
#?創(chuàng)建4*4的對象
gs?=?fig.add_gridspec(4,?4)

#?創(chuàng)建第一行
ax1?=?fig.add_subplot(gs[0,0:4])
ax1.set_title('[0,0:4]')

#?創(chuàng)建中間四行
ax2?=?fig.add_subplot(gs[1,1:3])
ax2.set_title('[1,1:3]')

ax3?=?fig.add_subplot(gs[2:4,1])
ax3.set_title('[2:4,1]')

ax4?=?fig.add_subplot(gs[2,2])
ax4.set_title('[2,2]')

plt.tight_layout()
6 圖中的漢字總是亂碼怎么解決?
借助全局參數(shù)配置字典rcParams,只需要在代碼開頭,添加如下兩行代碼:
#解決中文顯示問題

#?指定默認(rèn)字體
plt.rcParams['font.sans-serif']?=?['KaiTi']?
#?解決保存圖像是負(fù)號'-'顯示為方塊的問題
plt.rcParams['axes.unicode_minus']?=?False?
7 matplotlib中如何繪制動(dòng)畫?
詳細(xì)參考前幾天的推送,專題第18篇:Python 繪圖入門,使用animation模塊,FuncAnimation方法,定義好回調(diào)函數(shù),入?yún)檎麛?shù),代表幀數(shù)。
如下為繪制餅圖的動(dòng)畫,展示邏輯如下:
fig,ax?=?plt.subplots()
explode=[0.01,0.01,0.01,0.01]?


def?getmepie(i):
????def?absolute_value(val):
????????a?=?np.round(val/100.*df1.head(i).max().sum(),?0)
????????return?int(a)
????ax.clear()
????plot?=?df1.head(i).max().plot.pie(y=df1.columns,autopct=absolute_value,?label='',explode?=?explode,?shadow?=?True)
????plot.set_title('Total?Number?of?Deaths\n'?+?str(df1.index[min(?i,?len(df1.index)-1?)].strftime('%Y-%m-%d')),?fontsize=12)
animator = ani.FuncAnimation(fig, getmepie, interval = 200) plt.show() 繪制動(dòng)畫只有這一行,調(diào)用FuncAnimation,它的第二個(gè)參數(shù)為上面定義的函數(shù)getmepie:
animator = ani.FuncAnimation(fig, getmepie, interval = 200) plt.show() 繪制后的餅圖部分 gif 動(dòng)畫,錄制效果如下:
今天就先介紹這些,下一篇介紹使用matplotlib的具體案例。如果覺得這些文章有幫助,歡迎點(diǎn)個(gè)贊支持一下。