
SpringBoot+Actuator打造強大的監(jiān)控和管理系統(tǒng)
0.前言
背景:一直零散的使用著Spring Boot 的各種組件和特性,從未系統(tǒng)性的學習和總結(jié),本次借著這個機會搞一波。共同學習,一起進步。哈哈
Spring Boot Actuator 是一個強大的監(jiān)控和管理框架,它提供了一系列的監(jiān)控端點,可以用于獲取應用程序的狀態(tài)、度量指標、健康檢查、配置信息等。Actuator 的監(jiān)控端點可以通過 HTTP 請求訪問,并返回有關應用程序運行時信息的響應。
使用 Actuator 可以方便地了解應用程序的運行狀況,監(jiān)控關鍵指標,并根據(jù)需要采取相應的措施。它為開發(fā)人員和運維人員提供了一種簡單而有效的方式來監(jiān)控和管理 Spring Boot 應用程序。
本系列文章將深入探討 Spring Boot Actuator 監(jiān)控端點的各個方面。我們將逐個介紹默認的監(jiān)控端點,包括健康檢查、信息、度量指標等,并說明如何自定義和擴展這些端點以滿足特定需求。
在本系列文章中,你將學到以下內(nèi)容:
- Actuator 的介紹和基本概念。
- 默認監(jiān)控端點的詳細解釋,包括健康檢查、信息、度量指標等。
- 如何自定義監(jiān)控端點,以便獲取特定的應用程序狀態(tài)和信息。
- 監(jiān)控端點的安全性配置,以保護敏感信息的訪問。
- 如何使用 Actuator 的事件和監(jiān)聽器功能。
- Actuator 的擴展性機制,包括自定義指標、自定義端點和自定義 EndpointGroup 等。
通過閱讀本系列文章,你將全面了解 Spring Boot Actuator 監(jiān)控端點的功能和用法,能夠靈活應用 Actuator 來監(jiān)控和管理你的 Spring Boot 應用程序。讓我們開始這個有趣而實用的學習之旅吧!
1.參考文檔
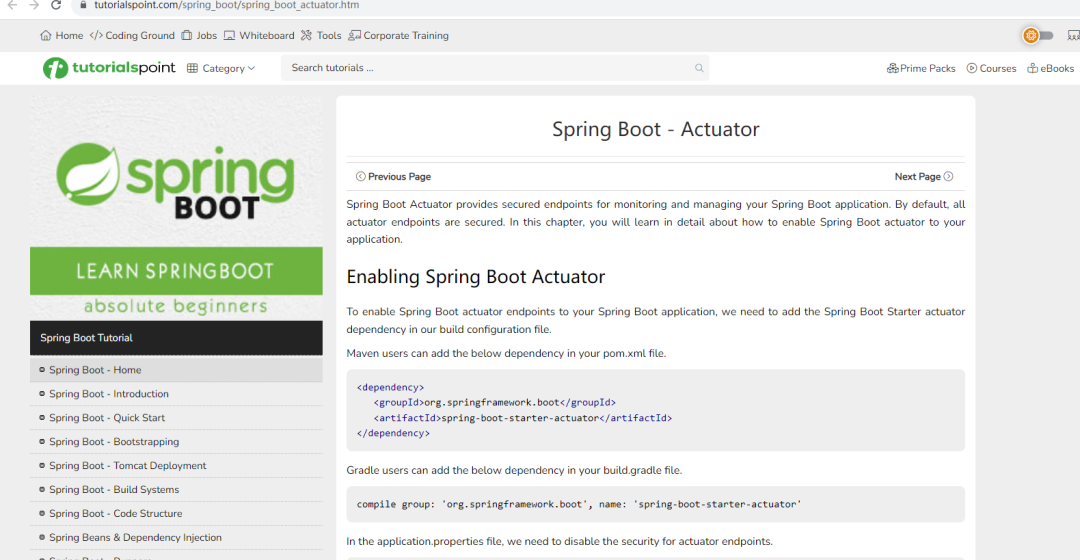
1、Spring Boot Actuator Tutorial
?https://www.tutorialspoint.com/spring_boot/spring_boot_actuator.htm
?
Tutorialspoint 還是比較好的比較權威的一個網(wǎng)站上。他上面羅列的一些示例具有很好的借鑒意義,至少比CSDN 的一些代碼示例強的多,不會抄來抄去,連bug都一模一樣,哈哈。建議大家可以隨便翻翻,東西還是挺全的。上面的鏈接介紹了 Spring Boot Actuator 的基本概念和用法,包括默認端點、自定義端點、健康檢查等方面的內(nèi)容,并提供了一些示例代碼。
2、官方文檔 - Spring Boot Actuator
?https://docs.spring.io/spring-boot/docs/current/reference/htmlsingle/#production-ready
?
官方文檔提供了詳細的關于 Actuator 的說明,包括監(jiān)控端點的概述、默認端點的介紹、自定義端點的創(chuàng)建和配置等內(nèi)容。
3、官方文檔 - Health Indicator
?https://www.baeldung.com/spring-boot-actuators
?
Baeldung 網(wǎng)站的文章提供了一個全面的 Spring Boot Actuator 指南,涵蓋了 Actuator 的核心概念、監(jiān)控端點的詳細解釋,以及如何自定義和配置端點等內(nèi)容。
2.基礎介紹
spring-boot-starter-actuator 是 Spring Boot 提供的一個模塊,用于監(jiān)控和管理 Spring Boot 應用程序的運行時信息。它提供了一組監(jiān)控端點(endpoints),用于獲取應用程序的健康狀態(tài)、性能指標、配置信息等,并支持通過 HTTP 或 JMX 進行訪問。
以下是 spring-boot-starter-actuator 的一些主要特性和功能:
-
健康監(jiān)測(Health Indicators):spring-boot-starter-actuator 提供了一個健康端點,可用于檢查應用程序的健康狀態(tài)。它通過 Health Indicator 提供了一組預定義的健康檢查規(guī)則,如數(shù)據(jù)庫連接、磁盤空間、內(nèi)存使用等。也可以自定義 Health Indicator 來添加自定義的健康檢查規(guī)則。
-
信息端點(Info Endpoint):該端點用于獲取應用程序的自定義信息。可以配置應用程序的元數(shù)據(jù),如版本號、構(gòu)建信息等,并通過 Info Endpoint 暴露這些信息。
-
度量指標(Metrics):spring-boot-starter-actuator 支持收集和暴露應用程序的度量指標,如 CPU 使用率、內(nèi)存使用量、請求處理時間等。可以使用 Micrometer 庫來收集和管理度量指標,并通過 Metrics Endpoint 暴露這些指標。
-
配置屬性(Configuration Properties):該功能允許檢索和調(diào)整應用程序的配置屬性。可以通過 Configuration Properties Endpoint 查看和修改應用程序的配置屬性,并支持屬性的動態(tài)刷新。
-
日志記錄(Logging):spring-boot-starter-actuator 提供了一個端點用于管理應用程序的日志級別。可以通過 Logging Endpoint 查看和修改日志記錄器的級別,以及重新加載日志配置。
-
遠程 Shell(Remote Shell):該功能允許通過 SSH 或 Telnet 連接到應用程序,并執(zhí)行一些管理操作。可以在應用程序中啟用遠程 Shell,以便通過命令行界面遠程管理和監(jiān)控應用程序。
通過引入 spring-boot-starter-actuator 依賴,可以輕松地將上述功能集成到 Spring Boot 應用程序中。同時,spring-boot-starter-actuator 還提供了一些安全性配置選項,以確保監(jiān)控端點的安全訪問。
默認支持的端點
Spring Boot 默認提供了以下一些常用的端點(endpoints):
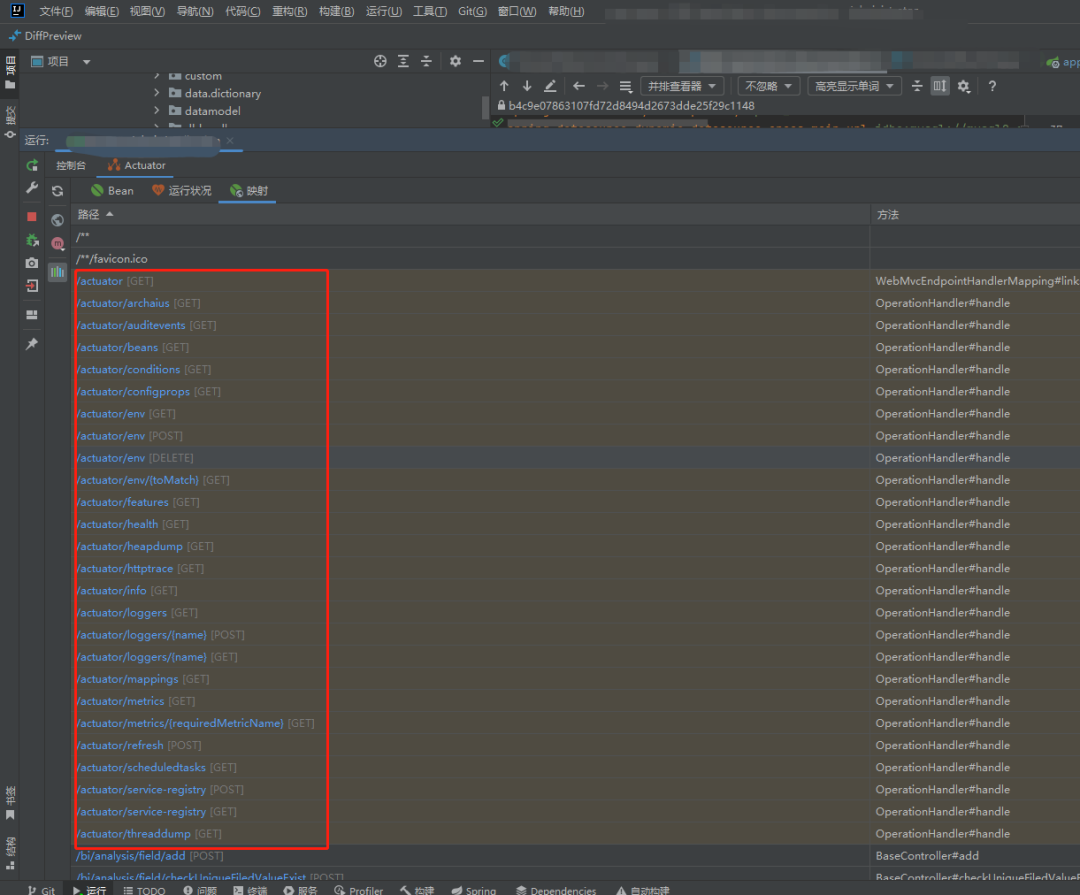
1./actuator/health:顯示應用程序的健康狀態(tài)。返回一個表示健康狀態(tài)的 JSON 響應。假設我們的應用程序是一個電子商務平臺, 展示了 /actuator/health 端點的健康狀態(tài)和其他自定義健康檢查項:
      {
  "status": "UP",
  "components": {
    "database": {
      "status": "UP",
      "details": {
        "connection": "OK",
        "activeConnections": 10
      }
    },
    "storage": {
      "status": "UP",
      "details": {
        "availableSpace": "10 GB",
        "usedSpace": "2 GB"
      }
    },
    "paymentGateway": {
      "status": "DOWN",
      "details": {
        "error": "Connection timeout"
      }
    }
  }
}
2./actuator/info:顯示應用程序的信息。
3./actuator/metrics:顯示應用程序的度量指標。返回 如內(nèi)存使用量、HTTP 請求計數(shù)等。
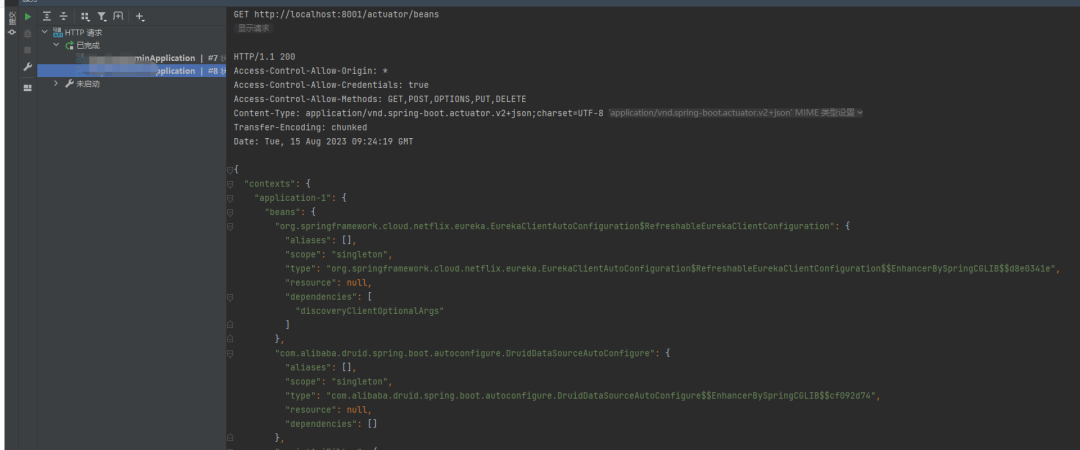
4./actuator/beans:顯示應用程序中所有的 Spring Bean。返回一個包含所有 Bean 的 JSON 響應。
5./actuator/env:顯示應用程序的環(huán)境屬性。返回一個包含應用程序環(huán)境屬性的 JSON 響應,如配置文件屬性、系統(tǒng)屬性等。
6./actuator/mappings:顯示應用程序的 URL 映射。返回一個包含應用程序中所有 URL 映射信息的 JSON 響應,包括控制器、請求方法等。
7./actuator/trace:顯示最近的 HTTP 請求跟蹤信息。返回一個包含最近 HTTP 請求的 JSON 響應,包括請求方法、URL、狀態(tài)碼等。
      {
  "traces": [
    {
      "timestamp": "2023-08-15T09:26:18.062Z",
      "principal": null,
      "session": null,
      "request": {
        "method": "GET",
        "uri": "http://localhost:8001/actuator/loggers",
        "headers": {
          "accept": [
            "application/vnd.spring-boot.actuator.v2+json"
          ],
          "host": [
            "localhost:8001"
          ],
          "connection": [
            "Keep-Alive"
          ],
          "user-agent": [
            "Apache-HttpClient/4.5.14 (Java/17.0.7)"
          ],
          "accept-encoding": [
            "br,deflate,gzip,x-gzip"
          ]
        },
        "remoteAddress": null
      },
      "response": {
        "status": 200,
        "headers": {
          "Access-Control-Allow-Origin": [
            "*"
          ],
          "Access-Control-Allow-Credentials": [
            "true"
          ],
          "Access-Control-Allow-Methods": [
            "GET,POST,OPTIONS,PUT,DELETE"
          ],
          "Content-Type": [
            "application/vnd.spring-boot.actuator.v2+json;charset=UTF-8"
          ],
          "Transfer-Encoding": [
            "chunked"
          ],
          "Date": [
            "Tue, 15 Aug 2023 09:26:18 GMT"
          ]
        }
      },
      "timeTaken": 49
    },
    {
      "timestamp": "2023-08-15T09:24:19.108Z",
      "principal": null,
      "session": null,
      "request": {
        "method": "GET",
        "uri": "http://localhost:8001/actuator/beans",
        "headers": {
          "accept": [
            "application/vnd.spring-boot.actuator.v2+json"
          ],
          "host": [
            "localhost:8001"
          ],
          "connection": [
            "Keep-Alive"
          ],
          "user-agent": [
            "Apache-HttpClient/4.5.14 (Java/17.0.7)"
          ],
          "accept-encoding": [
            "br,deflate,gzip,x-gzip"
          ]
        },
        "remoteAddress": null
      },
      "response": {
        "status": 200,
        "headers": {
          "Access-Control-Allow-Origin": [
            "*"
          ],
          "Access-Control-Allow-Credentials": [
            "true"
          ],
          "Access-Control-Allow-Methods": [
            "GET,POST,OPTIONS,PUT,DELETE"
          ],
          "Content-Type": [
            "application/vnd.spring-boot.actuator.v2+json;charset=UTF-8"
          ],
          "Transfer-Encoding": [
            "chunked"
          ],
          "Date": [
            "Tue, 15 Aug 2023 09:24:19 GMT"
          ]
        }
      },
      "timeTaken": 70
    },
    {
      "timestamp": "2023-08-15T09:23:50.737Z",
      "principal": null,
      "session": null,
      "request": {
        "method": "GET",
        "uri": "http://localhost:8001/actuator/health",
        "headers": {
          "accept": [
            "application/vnd.spring-boot.actuator.v2+json"
          ],
          "host": [
            "localhost:8001"
          ],
          "connection": [
            "Keep-Alive"
          ],
          "user-agent": [
            "Apache-HttpClient/4.5.14 (Java/17.0.7)"
          ],
          "accept-encoding": [
            "br,deflate,gzip,x-gzip"
          ]
        },
        "remoteAddress": null
      },
      "response": {
        "status": 200,
        "headers": {
          "Access-Control-Allow-Origin": [
            "*"
          ],
          "Access-Control-Allow-Credentials": [
            "true"
          ],
          "Access-Control-Allow-Methods": [
            "GET,POST,OPTIONS,PUT,DELETE"
          ],
          "Content-Type": [
            "application/vnd.spring-boot.actuator.v2+json;charset=UTF-8"
          ],
          "Transfer-Encoding": [
            "chunked"
          ],
          "Date": [
            "Tue, 15 Aug 2023 09:23:51 GMT"
          ]
        }
      },
      "timeTaken": 488
    }
  ]
}
響應文件已保存。
> 2023-08-15T172634.200.json

Response code: 200; Time: 38ms (38 ms); Content length: 2230 bytes (2.23 kB)
8./actuator/auditevents:顯示應用程序的審計事件。返回一個包含應用程序?qū)徲嬍录?JSON 響應,如登錄成功、失敗等。
9./actuator/loggers:顯示和修改應用程序的日志記錄器配置。返回一個包含日志記錄器配置信息的 JSON 響應,可以修改日志記錄器的級別。
10./actuator/httptrace:顯示最近的 HTTP 跟蹤信息。返回一個包含最近的 HTTP 請求和響應跟蹤信息的 JSON 響應,包括請求和響應頭、狀態(tài)碼等。
11./actuator/threaddump:顯示應用程序的線程轉(zhuǎn)儲信息。返回一個包含應用程序線程轉(zhuǎn)儲信息的 JSON 響應,用于分析線程狀態(tài)和問題。
大家可以在自己的項目中去嘗試獲取一下這些信息,此處不再演示。,我們繼續(xù)搞。
3.步驟
3.1. 引入依賴
      <dependency>
    <groupId>org.springframework.boot</groupId>
    <artifactId>spring-boot-starter-actuator</artifactId>
</dependency>
3.2. 配置文件
這些配置大家按需配置,還有一點,開啟端點是具有一定安全風險的,大家可以通過上面我演示的結(jié)果來看,其實會輸出一些核心信息,給攻擊者提供了價值。切記生產(chǎn)環(huán)境非必要不要開啟
# Actuator Endpoints
# 啟用所有端點,默認為true
management.endpoints.enabled-by-default=true
# 管理端點的基本路徑,默認為/actuator
management.endpoints.web.base-path=/actuator
# 配置需要暴露的端點,*表示全部暴露
management.endpoints.web.exposure.include=*
# 配置需要排除的端點,如果需要排除特定端點,可以在此處指定
management.endpoints.web.exposure.exclude=
# 允許跨域訪問的來源,*表示允許全部來源
management.endpoints.web.cors.allowed-origins=*
# 允許跨域訪問的HTTP方法
management.endpoints.web.cors.allowed-methods=GET
# Health Endpoint
# 顯示詳細的健康狀態(tài)信息,always表示始終顯示
management.endpoint.health.show-details=always
# Info Endpoint
# 應用程序名稱
info.app.name=我的應用程序
# 應用程序版本
info.app.version=1.0.0
# Metrics Endpoint
# 啟用度量指標端點
management.endpoint.metrics.enabled=true
# 啟用緩存的度量指標
management.endpoint.metrics.cache.enabled=true
# 啟用默認的度量指標
management.metrics.export.defaults.enabled=true
# Beans Endpoint
# 啟用顯示所有 Spring Bean 的端點
management.endpoint.beans.enabled=true
# Environment Endpoint
# 啟用顯示應用程序環(huán)境屬性的端點
management.endpoint.env.enabled=true
# Mappings Endpoint
# 啟用顯示應用程序 URL 映射信息的端點
management.endpoint.mappings.enabled=true
# Trace Endpoint
# 啟用顯示最近的 HTTP 請求跟蹤信息的端點
management.endpoint.trace.enabled=true
# Auditevents Endpoint
# 啟用顯示應用程序?qū)徲嬍录亩它c
management.endpoint.auditevents.enabled=true
# Loggers Endpoint
# 啟用顯示和修改應用程序日志記錄器配置的端點
management.endpoint.loggers.enabled=true
# Httptrace Endpoint
# 啟用顯示最近的 HTTP 請求和響應跟蹤信息的端點
management.endpoint.httptrace.enabled=true
# Threaddump Endpoint
# 啟用顯示應用程序線程轉(zhuǎn)儲信息的端點
management.endpoint.threaddump.enabled=true
3.3. 核心源碼
其核心代碼包括以下關鍵組件和功能:版本不一樣類和接口也是有差異的,包括上面的配置項。本文是基于2.0.3
Endpoint 接口:Endpoint 接口定義了監(jiān)控和管理功能的核心方法。所有的監(jiān)控端點都必須實現(xiàn)該接口,并提供自己的邏輯實現(xiàn)。
MetricsEndpoint 類:MetricsEndpoint 是用于提供應用程序度量指標信息的監(jiān)控端點。它繼承自 AbstractEndpoint,并實現(xiàn)了 Endpoint 接口的方法,通過收集應用程序的度量指標數(shù)據(jù)并返回給調(diào)用方。
InfoEndpoint 類:InfoEndpoint 是一個監(jiān)控端點,用于提供應用程序的自定義信息。它繼承自 AbstractEndpoint,并實現(xiàn)了 Endpoint 接口的方法,通過收集應用程序的自定義信息并返回給調(diào)用方。
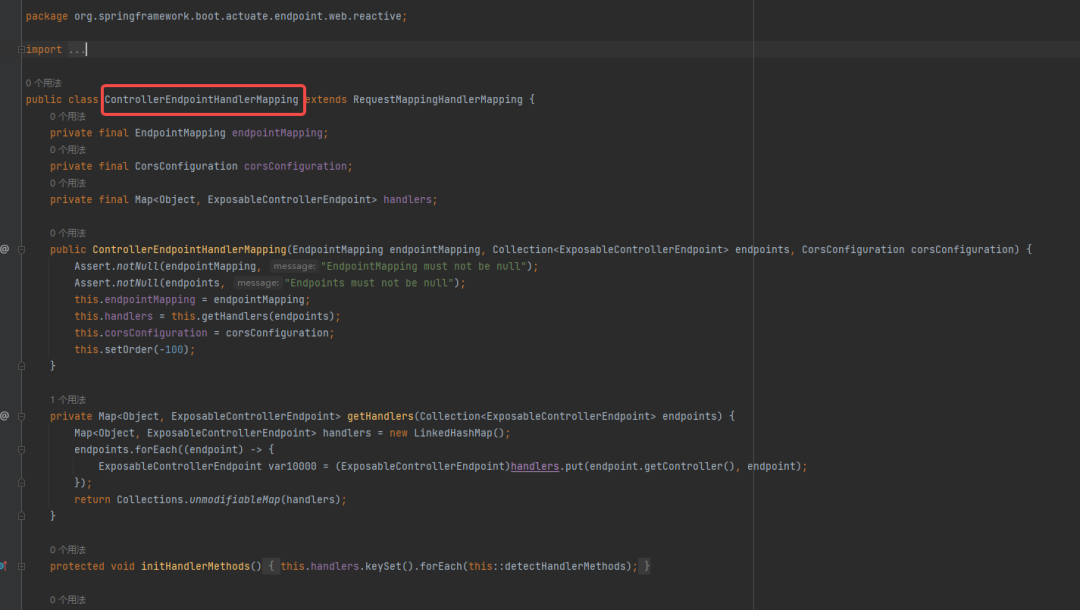
ControllerEndpointHandlerMapping類:EndpointHandlerMapping 類是一個 Spring MVC 的處理器映射器,負責將 HTTP 請求映射到相應的監(jiān)控端點的處理器。
EndpointWebMvcManagementContextConfiguration 類:EndpointWebMvcManagementContextConfiguration 類是 Spring Boot Actuator 的自動配置類,用于注冊和配置 Actuator 的核心組件,包括 EndpointHandlerMapping、EndpointMvcAdapter 等。
AbstractEndpoint 類:AbstractEndpoint 類是 Endpoint 接口的抽象實現(xiàn),提供了一些通用的功能和方法,例如端點的 ID、是否啟用、安全性配置等。自定義的監(jiān)控端點可以繼承該類來簡化實現(xiàn)。
HealthIndicator:是 Spring Boot Actuator 提供的一個核心接口,用于定義應用程序的健康檢查邏輯。它允許開發(fā)人員自定義健康檢查的實現(xiàn),并將其注冊為 Spring Bean,使其成為 Actuator 的一部分。。
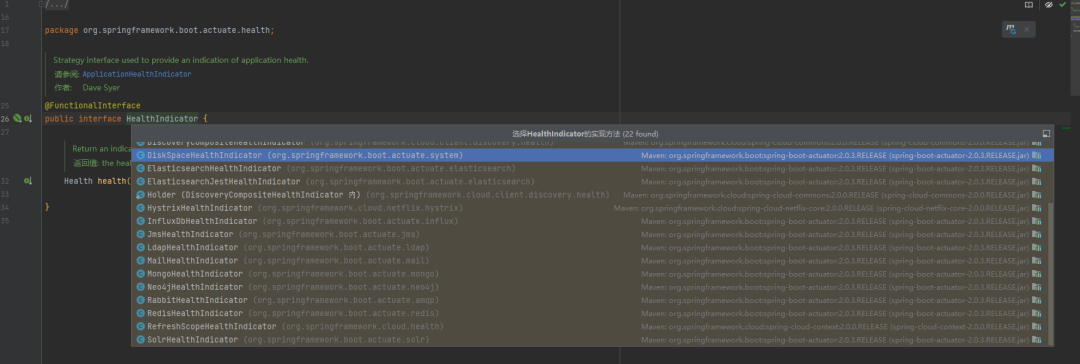
我們可以看到有這么多約定的配置已經(jīng)加入的將康檢查。
HealthIndicator 接口是 Spring Boot Actuator 提供的一個核心接口,用于定義應用程序的健康檢查邏輯。它允許開發(fā)人員自定義健康檢查的實現(xiàn),并將其注冊為 Spring Bean,使其成為 Actuator 的一部分。
HealthIndicator 接口只有一個方法 health(),該方法返回一個 Health 對象,表示應用程序的健康狀態(tài)。
自定義的健康指標實現(xiàn)需要實現(xiàn) HealthIndicator 接口,并實現(xiàn)其中的 health() 方法。在該方法中,開發(fā)人員可以編寫自己的健康檢查邏輯,并返回一個 Health 對象,該對象描述了應用程序的健康狀態(tài)。
Health 對象可以使用 Health.up()、Health.down()、Health.unknown() 等靜態(tài)方法進行創(chuàng)建。它可以包含一些狀態(tài)信息、錯誤消息、異常信息等,以提供更詳細的健康狀態(tài)描述。
簡單的實現(xiàn)方式如下:
      @Component
public class MyHealthIndicator implements HealthIndicator {

    @Override
    public Health health() {
        // 自定義健康檢查邏輯
        boolean isHealthy = checkHealth(); // 健康檢查的具體實現(xiàn)

        if (isHealthy) {
            return Health.up().build(); // 返回健康狀態(tài)
        } else {
            return Health.down().withDetail("Error", "Something went wrong").build(); // 返回不健康狀態(tài),并提供錯誤信息
        }
    }

    private boolean checkHealth() {
        // 實現(xiàn)自定義的健康檢查邏輯
        // 返回 true 表示健康,返回 false 表示不健康
        // 可以根據(jù)具體需求進行判斷
    }
}
4.示例項目
假設我們有一個 Spring Boot 應用程序,它使用 MongoDB 作為數(shù)據(jù)庫,并且我們希望添加一個自定義健康檢查規(guī)則來檢查與 MongoDB 數(shù)據(jù)庫的連接狀態(tài)。如果連接正常,應用程序?qū)⒈粯擞洖榻】禒顟B(tài),否則將被標記為非健康狀態(tài)。
首先,我們需要創(chuàng)建一個自定義的健康指示器類 MongoDBHealthIndicator,實現(xiàn) HealthIndicator 接口,并重寫 health() 方法來執(zhí)行 MongoDB 連接的健康檢查。
我們使用 MongoClient 對象來執(zhí)行 MongoDB 的 ping 命令,如果命令執(zhí)行成功,則認為與數(shù)據(jù)庫的連接正常。如果出現(xiàn)異常,我們將錯誤信息添加到健康狀態(tài)的詳細信息中。
      import com.mongodb.MongoClient;
import org.springframework.boot.actuate.health.Health;
import org.springframework.boot.actuate.health.HealthIndicator;
import org.springframework.stereotype.Component;

@Component
public class MongoDBHealthIndicator implements HealthIndicator {

    private final MongoClient mongoClient;

    public MongoDBHealthIndicator(MongoClient mongoClient) {
        this.mongoClient = mongoClient;
    }

    @Override
    public Health health() {
        try {
            mongoClient.getDatabase("admin").runCommand("ping"); // 執(zhí)行 MongoDB 的 ping 命令,檢查連接狀態(tài)
            return Health.up().build(); // 健康狀態(tài)
        } catch (Exception e) {
            return Health.down().withDetail("Error", e.getMessage()).build(); // 非健康狀態(tài),添加錯誤信息
        }
    }
}
然后,確保應用程序能夠自動掃描到 MongoDBHealthIndicator 類。可以使用 @ComponentScan 或 @SpringBootApplication 注解進行自動掃描。
      import org.springframework.boot.SpringApplication;
import org.springframework.boot.autoconfigure.SpringBootApplication;

@SpringBootApplication
public class MyApplication {

    public static void main(String[] args) {
        SpringApplication.run(MyApplication.class, args);
    }
}
最后,啟動應用程序,并訪問 /actuator/health 端點,查看自定義健康檢查規(guī)則的結(jié)果。
GET /actuator/health
應該能夠看到返回的 JSON 中包含自定義健康檢查結(jié)果,類似于以下輸出:
mongoDB 表示自定義健康檢查的結(jié)果,status 字段為 "UP" 表示健康狀態(tài),details 字段為附加的詳細信息。如果連接出現(xiàn)問題,status 字段將變?yōu)?"DOWN",并在 details 字段中提供錯誤信息。
      {
  "status": "UP",
  "components": {
    "mongoDB": {
      "status": "UP",
      "details": {
        "error": null
      }
    },
    "ping": {
      "status": "UP",
      "details": {
        "error": null
      }
    }
  }
}
5.總結(jié)
Spring Boot Actuator 的設計思想是為了提供一種簡單、可擴展和可配置的方式來監(jiān)控和管理 Spring Boot 應用程序。
約定優(yōu)于配置: Spring Boot Actuator 遵循 Spring Boot 的約定優(yōu)于配置原則,通過默認配置和自動裝配的方式,使得監(jiān)控和管理端點能夠在應用程序啟動時自動可用,而無需進行繁瑣的手動配置。
端點的模塊化和可擴展性: Actuator 提供了一組核心端點(如健康檢查、信息、度量指標等),同時也支持自定義端點的添加和擴展。開發(fā)人員可以根據(jù)自己的需求,編寫自定義的端點,并通過簡單的配置將其集成到 Actuator 中。
基于 HTTP 協(xié)議的遠程訪問: Actuator 的端點通過 HTTP 協(xié)議進行訪問,這使得監(jiān)控和管理操作可以通過遠程方式進行,無需直接訪問應用程序的代碼或運行時環(huán)境。這樣可以方便地在分布式環(huán)境中監(jiān)控和管理多個應用程序。
提供豐富的監(jiān)控和管理功能: Actuator 提供了一系列功能強大的端點,可以監(jiān)控和管理應用程序的各個方面,包括健康狀態(tài)、性能指標、環(huán)境屬性、日志記錄器配置等。這些功能可以幫助開發(fā)人員快速了解應用程序的運行狀況,并進行問題排查和性能優(yōu)化。
安全性和權限控制: Actuator 提供了安全性配置選項,可以限制對端點的訪問權限,確保只有授權的用戶或角色才能訪問敏感的監(jiān)控和管理端點。這樣可以保護應用程序的安全性和敏感信息的機密性。
來源:blog.csdn.net/wangshuai6707/
article/details/132303140
后端專屬技術群
構(gòu)建高質(zhì)量的技術交流社群,歡迎從事編程開發(fā)、技術招聘HR進群,也歡迎大家分享自己公司的內(nèi)推信息,相互幫助,一起進步!
文明發(fā)言,以交流技術和經(jīng)驗、行業(yè)探討為主加我好友,拉你進群