
輕量級云原生日志收集方案 Loki

?本文轉(zhuǎn)自掘金,原文:https://juejin.cn/post/7150469420605767717,版權歸原作者所有。歡迎投稿,投稿請?zhí)砑游⑿藕糜眩?strong style="color: rgb(50, 108, 229);">cloud-native-yang
Hi,很高興能夠在掘金開發(fā)者的平臺上為大家?guī)硪惶纵p量級的 kubernetes 日志收集方案的相關介紹。我自己也在生產(chǎn)環(huán)境中使用過這套方案,令我意想不到的時它占用的 kubernetes 的資源相比與 ELK 這套方案真的是小巫見大巫。那接下來就跟隨這篇文章開始學習它吧……
為什么要使用 Loki
這篇文章著重介紹了 grafana 公司開發(fā)的 loki 日志收集應用。Loki 是一個輕量級的日志收集、分析的應用,采用的是 promtail 的方式來獲取日志內(nèi)容并送到 loki 里面進行存儲,最終在 grafana 的 datasource 里面添加數(shù)據(jù)源進行日志的展示、查詢。
loki 的持久化存儲支持 azure、gcs、s3、swift、local 這 5 中類型,其中常用的是 s3、local。另外,它還支持很多種日志搜集類型,像最常用的 logstash、fluentbit 也在官方支持的列表中。
那它有哪些優(yōu)點呢?
支持的客戶端,如 Promtail,F(xiàn)luentbit,F(xiàn)luentd,Vector,Logstash 和 Grafana Agent 首選代理 Promtail,可以多來源提取日志,包括本地日志文件,systemd,Windows 事件日志,Docker 日志記錄驅(qū)動程序等 沒有日志格式要求,包括 JSON,XML,CSV,logfmt,非結(jié)構(gòu)化文本 使用與查詢指標相同的語法查詢?nèi)罩?/section> 日志查詢時允許動態(tài)篩選和轉(zhuǎn)換日志行 可以輕松地計算日志中的需要的指標 引入時的最小索引意味著您可以在查詢時動態(tài)地對日志進行切片和切塊,以便在出現(xiàn)新問題時回答它們 云原生支持,使用 Prometheus 形式抓取數(shù)據(jù)
各日志收集組件簡單對比
| 名稱 | 安裝的組件 | 優(yōu)點 |
|---|---|---|
| ELK/EFK | elasticsearch、logstash、kibana、filebeat、kafka/redis | 支持自定義 grok 正則解析復雜日志內(nèi)容;dashboard 支持豐富的可視化展示 |
| Loki | grafana、loki、promtail | 占用資源小;grafana 原生支持;查詢速度快 ; |
Loki 工作方式解惑
日志解析格式
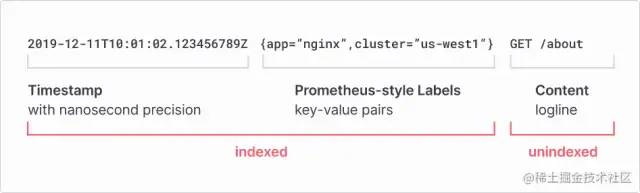
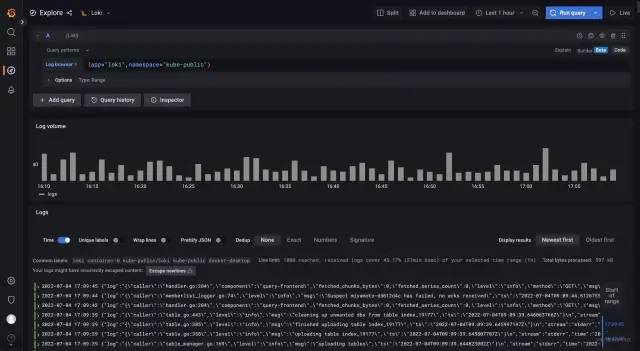
從上面的圖中我們可以看到,它在解析日志的時候是以 index 為主的,index 包括時間戳和 pod 的部分 label(其他 label 為 filename、containers 等),其余的是日志內(nèi)容。具體查詢效果如下:
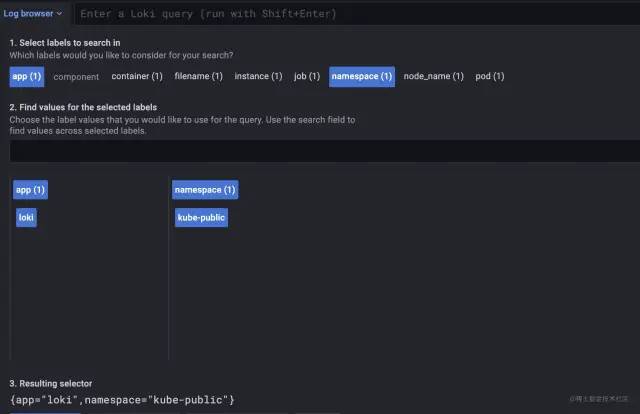
{app="loki",namespace="kube-public"} 為索引。
日志搜集架構(gòu)模式
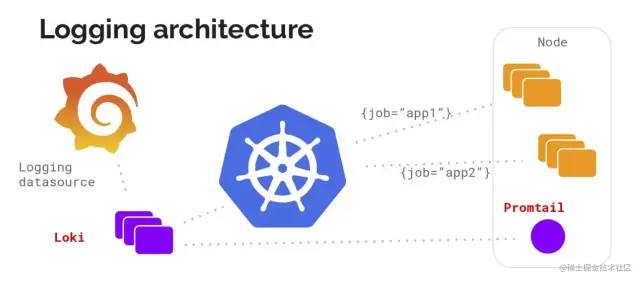 在使用過程中,官方推薦使用
 promtail 做為 agent 以 DaemonSet 方式部署在 kubernetes 的 worker 節(jié)點上搜集日志。另外也可以用上面提到的其他日志收集工具來收取,這篇文章在結(jié)尾處會附上其他工具的配置方式。
Loki 部署模式都有哪些呢
Loki 由許多組件微服務構(gòu)建而成,微服務組件有 5 個。在這 5 個里面添加緩存用來把數(shù)據(jù)放起來加快查詢。數(shù)據(jù)放在共享存儲里面配置 memberlist_config 部分并在實例之間共享狀態(tài),將 Loki 進行無限橫向擴展。在配置完 memberlist_config 部分后采用輪詢的方式查找數(shù)據(jù)。為了使用方便官方把所有的微服務編譯成一個二進制,可以通過命令行參數(shù)-target 控制,支持 all、read、write,我們在部署時根據(jù)日志量的大小可以指定不同模式。
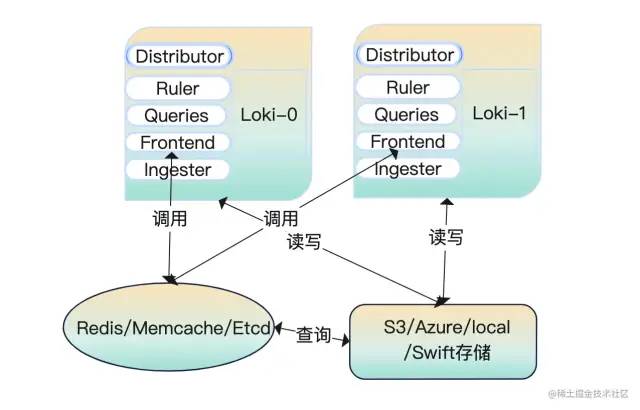
all(讀寫模式)
服務啟動后,我們做的數(shù)據(jù)查詢、數(shù)據(jù)寫入都是來自這一個節(jié)點。請看下面的這個圖解:
read/write(讀寫分離模式)
在讀寫分離模式下運行時 fronted-query 查詢會將流量轉(zhuǎn)發(fā)到 read 節(jié)點上。讀節(jié)點上保留了 querier、ruler、fronted,寫節(jié)點上保留了 distributor、ingester。

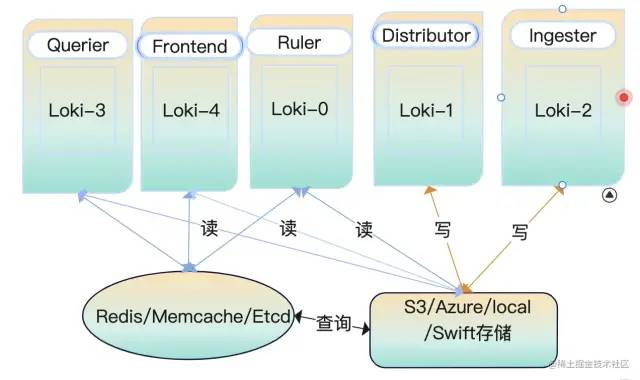
微服務模式運行
微服務模式運行下,通過不同的配置參數(shù)啟動為不同的角色,每一個進程都引用它的目標角色服務。
| 組件名稱 | 功能 |
|---|---|
| 分發(fā)器 / 調(diào)度器(distributor) | 驗證數(shù)據(jù)合規(guī);數(shù)據(jù)排序;hash 一致性;QPS 限制;轉(zhuǎn)發(fā);數(shù)據(jù)副本保證不丟失 |
| 收集器(ingester) | 時間戳排序;文件系統(tǒng)支持;WAL 預寫; |
| 查詢前端(query-frontend) | 提供頁面操作,向后端存儲發(fā)出數(shù)據(jù)查詢;查詢隊列(query-queueing)能夠防止大數(shù)據(jù)量查詢時觸發(fā) OOM;查詢分割(query-split)可以分割大批量查詢最后進行數(shù)據(jù)聚合 |
| 查詢器 Querier | 使用 logql 語言在后端存儲中查詢?nèi)罩?/td> |
| 緩存 | 將查詢到的日志緩存起來共后續(xù)使用,如果數(shù)據(jù)不完整重新查詢?nèi)笔У臄?shù)據(jù) |
大顯身手之服務端部署
上面我們講了那么多關于 loki 的介紹和它的工作模式,你也一定期待它是怎么部署的吧?!該怎么部署、部署在哪里、部署后怎么使用等等問題都會出現(xiàn)在你的腦海里。在部署之前你需要準備好一個 k8s 集群才行哦。那好,接下來耐著性子往下看……
| 應用 | 鏡像 |
|---|---|
| loki | grafana/loki:2.5.0 |
| promtail | grafana/promtail:2.5.0 |
AllInOne 部署模式
① k8s 部署
我們從 github 上下載的程序是沒有配置文件的,需要提前將文件準備一份。這里提供了一份完整的 allInOne 配置文件,部分內(nèi)容進行了優(yōu)化。
配置文件內(nèi)容如下所示
auth_enabled: false
target: all
ballast_bytes: 20480
server:
  grpc_listen_port: 9095
  http_listen_port: 3100
  graceful_shutdown_timeout: 20s
  grpc_listen_address: "0.0.0.0"
  grpc_listen_network: "tcp"
  grpc_server_max_concurrent_streams: 100
  grpc_server_max_recv_msg_size: 4194304
  grpc_server_max_send_msg_size: 4194304
  http_server_idle_timeout: 2m
  http_listen_address: "0.0.0.0"
  http_listen_network: "tcp"
  http_server_read_timeout: 30s
  http_server_write_timeout: 20s
  log_source_ips_enabled: true
  ## http_path_prefix如果需要更改,在推送日志的時候前綴都需要加指定的內(nèi)容
  ## http_path_prefix: "/"
  register_instrumentation: true
  log_format: json
  log_level: info
distributor:
  ring:
    heartbeat_timeout: 3s
    kvstore:
      prefix: collectors/
      store: memberlist
      ## 需要提前創(chuàng)建好consul集群
    ##   consul:
    ##     http_client_timeout: 20s
    ##     consistent_reads: true
    ##     host: 127.0.0.1:8500
    ##     watch_burst_size: 2
    ##     watch_rate_limit: 2
querier:
  engine:
    max_look_back_period: 20s
    timeout: 3m0s
  extra_query_delay: 100ms
  max_concurrent: 10
  multi_tenant_queries_enabled: true
  query_ingester_only: false
  query_ingesters_within: 3h0m0s
  query_store_only: false
  query_timeout: 5m0s
  tail_max_duration: 1h0s
query_scheduler:
  max_outstanding_requests_per_tenant: 2048
  grpc_client_config:
    max_recv_msg_size: 104857600
    max_send_msg_size: 16777216
    grpc_compression: gzip
    rate_limit: 0
    rate_limit_burst: 0
    backoff_on_ratelimits: false
    backoff_config:
      min_period: 50ms
      max_period: 15s
      max_retries: 5
  use_scheduler_ring: true
  scheduler_ring:
    kvstore:
      store: memberlist
      prefix: "collectors/"
    heartbeat_period: 30s
    heartbeat_timeout: 1m0s
    ## 默認第一個網(wǎng)卡的名稱
    ## instance_interface_names
    ## instance_addr: 127.0.0.1
    ## 默認server.grpc-listen-port
    instance_port: 9095
frontend:
  max_outstanding_per_tenant: 4096
  querier_forget_delay: 1h0s
  compress_responses: true
  log_queries_longer_than: 2m0s
  max_body_size: 104857600
  query_stats_enabled: true
  scheduler_dns_lookup_period: 10s
  scheduler_worker_concurrency: 15
query_range:
  align_queries_with_step: true
  cache_results: true
  parallelise_shardable_queries: true
  max_retries: 3
  results_cache:
    cache:
      enable_fifocache: false
      default_validity: 30s
      background:
        writeback_buffer: 10000
      redis:
        endpoint: 127.0.0.1:6379
        timeout: 1s
        expiration: 0s
        db: 9
        pool_size: 128
        password: 1521Qyx6^
        tls_enabled: false
        tls_insecure_skip_verify: true
        idle_timeout: 10s
        max_connection_age: 8h
ruler:
  enable_api: true
  enable_sharding: true
  alertmanager_refresh_interval: 1m
  disable_rule_group_label: false
  evaluation_interval: 1m0s
  flush_period: 3m0s
  for_grace_period: 20m0s
  for_outage_tolerance: 1h0s
  notification_queue_capacity: 10000
  notification_timeout: 4s
  poll_interval: 10m0s
  query_stats_enabled: true
  remote_write:
    config_refresh_period: 10s
    enabled: false
  resend_delay: 2m0s
  rule_path: /rulers
  search_pending_for: 5m0s
  storage:
    local:
      directory: /data/loki/rulers
    type: configdb
  sharding_strategy: default
  wal_cleaner:
    period:  240h
    min_age: 12h0m0s
  wal:
    dir: /data/loki/ruler_wal
    max_age: 4h0m0s
    min_age: 5m0s
    truncate_frequency: 1h0m0s
  ring:
    kvstore:
      store: memberlist
      prefix: "collectors/"
    heartbeat_period: 5s
    heartbeat_timeout: 1m0s
    ## instance_addr: "127.0.0.1"
    ## instance_id: "miyamoto.en0"
    ## instance_interface_names: ["en0","lo0"]
    instance_port: 9500
    num_tokens: 100
ingester_client:
  pool_config:
    health_check_ingesters: false
    client_cleanup_period: 10s
    remote_timeout: 3s
  remote_timeout: 5s
ingester:
  autoforget_unhealthy: true
  chunk_encoding: gzip
  chunk_target_size: 1572864
  max_transfer_retries: 0
  sync_min_utilization: 3.5
  sync_period: 20s
  flush_check_period: 30s
  flush_op_timeout: 10m0s
  chunk_retain_period: 1m30s
  chunk_block_size: 262144
  chunk_idle_period: 1h0s
  max_returned_stream_errors: 20
  concurrent_flushes: 3
  index_shards: 32
  max_chunk_age: 2h0m0s
  query_store_max_look_back_period: 3h30m30s
  wal:
    enabled: true
    dir: /data/loki/wal
    flush_on_shutdown: true
    checkpoint_duration: 15m
    replay_memory_ceiling: 2GB
  lifecycler:
    ring:
      kvstore:
        store: memberlist
        prefix: "collectors/"
      heartbeat_timeout: 30s
      replication_factor: 1
    num_tokens: 128
    heartbeat_period: 5s
    join_after: 5s
    observe_period: 1m0s
    ## interface_names: ["en0","lo0"]
    final_sleep: 10s
    min_ready_duration: 15s
storage_config:
  boltdb:
    directory: /data/loki/boltdb
  boltdb_shipper:
    active_index_directory: /data/loki/active_index
    build_per_tenant_index: true
    cache_location: /data/loki/cache
    cache_ttl: 48h
    resync_interval: 5m
    query_ready_num_days: 5
    index_gateway_client:
      grpc_client_config:
  filesystem:
    directory: /data/loki/chunks
chunk_store_config:
  chunk_cache_config:
    enable_fifocache: true
    default_validity: 30s
    background:
      writeback_buffer: 10000
    redis:
      endpoint: 192.168.3.56:6379
      timeout: 1s
      expiration: 0s
      db: 8
      pool_size: 128
      password: 1521Qyx6^
      tls_enabled: false
      tls_insecure_skip_verify: true
      idle_timeout: 10s
      max_connection_age: 8h
    fifocache:
      ttl: 1h
      validity: 30m0s
      max_size_items: 2000
      max_size_bytes: 500MB
  write_dedupe_cache_config:
    enable_fifocache: true
    default_validity: 30s
    background:
      writeback_buffer: 10000
    redis:
      endpoint: 127.0.0.1:6379
      timeout: 1s
      expiration: 0s
      db: 7
      pool_size: 128
      password: 1521Qyx6^
      tls_enabled: false
      tls_insecure_skip_verify: true
      idle_timeout: 10s
      max_connection_age: 8h
    fifocache:
      ttl: 1h
      validity: 30m0s
      max_size_items: 2000
      max_size_bytes: 500MB
  cache_lookups_older_than: 10s
## 壓縮碎片索引
compactor:
  shared_store: filesystem
  shared_store_key_prefix: index/
  working_directory: /data/loki/compactor
  compaction_interval: 10m0s
  retention_enabled: true
  retention_delete_delay: 2h0m0s
  retention_delete_worker_count: 150
  delete_request_cancel_period: 24h0m0s
  max_compaction_parallelism: 2
  ## compactor_ring:
frontend_worker:
  match_max_concurrent: true
  parallelism: 10
  dns_lookup_duration: 5s
## runtime_config 這里沒有配置任何信息
## runtime_config:
common:
  storage:
    filesystem:
      chunks_directory: /data/loki/chunks
      fules_directory: /data/loki/rulers
  replication_factor: 3
  persist_tokens: false
  ## instance_interface_names: ["en0","eth0","ens33"]
analytics:
  reporting_enabled: false
limits_config:
  ingestion_rate_strategy: global
  ingestion_rate_mb: 100
  ingestion_burst_size_mb: 18
  max_label_name_length: 2096
  max_label_value_length: 2048
  max_label_names_per_series: 60
  enforce_metric_name: true
  max_entries_limit_per_query: 5000
  reject_old_samples: true
  reject_old_samples_max_age: 168h
  creation_grace_period: 20m0s
  max_global_streams_per_user: 5000
  unordered_writes: true
  max_chunks_per_query: 200000
  max_query_length: 721h
  max_query_parallelism: 64
  max_query_series: 700
  cardinality_limit: 100000
  max_streams_matchers_per_query: 1000
  max_concurrent_tail_requests: 10
  ruler_evaluation_delay_duration: 3s
  ruler_max_rules_per_rule_group: 0
  ruler_max_rule_groups_per_tenant: 0
  retention_period: 700h
  per_tenant_override_period: 20s
  max_cache_freshness_per_query: 2m0s
  max_queriers_per_tenant: 0
  per_stream_rate_limit: 6MB
  per_stream_rate_limit_burst: 50MB
  max_query_lookback: 0
  ruler_remote_write_disabled: false
  min_sharding_lookback: 0s
  split_queries_by_interval: 10m0s
  max_line_size: 30mb
  max_line_size_truncate: false
  max_streams_per_user: 0

## memberlist_conig模塊配置gossip用于在分發(fā)服務器、攝取器和查詢器之間發(fā)現(xiàn)和連接。
## 所有三個組件的配置都是唯一的,以確保單個共享環(huán)。
## 至少定義了1個join_members配置后,將自動為分發(fā)服務器、攝取器和ring 配置memberlist類型的kvstore
memberlist:
  randomize_node_name: true
  stream_timeout: 5s
  retransmit_factor: 4
  join_members:
  - 'loki-memberlist'
  abort_if_cluster_join_fails: true
  advertise_addr: 0.0.0.0
  advertise_port: 7946
  bind_addr: ["0.0.0.0"]
  bind_port: 7946
  compression_enabled: true
  dead_node_reclaim_time: 30s
  gossip_interval: 100ms
  gossip_nodes: 3
  gossip_to_dead_nodes_time: 3
  ## join:
  leave_timeout: 15s
  left_ingesters_timeout: 3m0s
  max_join_backoff: 1m0s
  max_join_retries: 5
  message_history_buffer_bytes: 4096
  min_join_backoff: 2s
  ## node_name: miyamoto
  packet_dial_timeout: 5s
  packet_write_timeout: 5s
  pull_push_interval: 100ms
  rejoin_interval: 10s
  tls_enabled: false
  tls_insecure_skip_verify: true
schema_config:
  configs:
  - from: "2020-10-24"
    index:
      period: 24h
      prefix: index_
    object_store: filesystem
    schema: v11
    store: boltdb-shipper
    chunks:
      period: 168h
    row_shards: 32
table_manager:
  retention_deletes_enabled: false
  retention_period: 0s
  throughput_updates_disabled: false
  poll_interval: 3m0s
  creation_grace_period: 20m
  index_tables_provisioning:
    provisioned_write_throughput: 1000
    provisioned_read_throughput: 500
    inactive_write_throughput: 4
    inactive_read_throughput: 300
    inactive_write_scale_lastn: 50
    enable_inactive_throughput_on_demand_mode: true
    enable_ondemand_throughput_mode: true
    inactive_read_scale_lastn: 10
    write_scale:
      enabled: true
      target: 80
      ## role_arn:
      out_cooldown: 1800
      min_capacity: 3000
      max_capacity: 6000
      in_cooldown: 1800
    inactive_write_scale:
      enabled: true
      target: 80
      out_cooldown: 1800
      min_capacity: 3000
      max_capacity: 6000
      in_cooldown: 1800
    read_scale:
      enabled: true
      target: 80
      out_cooldown: 1800
      min_capacity: 3000
      max_capacity: 6000
      in_cooldown: 1800
    inactive_read_scale:
      enabled: true
      target: 80
      out_cooldown: 1800
      min_capacity: 3000
      max_capacity: 6000
      in_cooldown: 1800
  chunk_tables_provisioning:
    enable_inactive_throughput_on_demand_mode: true
    enable_ondemand_throughput_mode: true
    provisioned_write_throughput: 1000
    provisioned_read_throughput: 300
    inactive_write_throughput: 1
    inactive_write_scale_lastn: 50
    inactive_read_throughput: 300
    inactive_read_scale_lastn: 10
    write_scale:
      enabled: true
      target: 80
      out_cooldown: 1800
      min_capacity: 3000
      max_capacity: 6000
      in_cooldown: 1800
    inactive_write_scale:
      enabled: true
      target: 80
      out_cooldown: 1800
      min_capacity: 3000
      max_capacity: 6000
      in_cooldown: 1800
    read_scale:
      enabled: true
      target: 80
      out_cooldown: 1800
      min_capacity: 3000
      max_capacity: 6000
      in_cooldown: 1800
    inactive_read_scale:
      enabled: true
      target: 80
      out_cooldown: 1800
      min_capacity: 3000
      max_capacity: 6000
      in_cooldown: 1800
tracing:
  enabled: true
復制代碼
注意 :
ingester.lifecycler.ring.replication_factor的值在單實例的情況下為1ingester.lifecycler.min_ready_duration的值為 15s,在啟動后默認會顯示 15 秒將狀態(tài)變?yōu)?ready
memberlist.node_name的值可以不用設置,默認是當前主機的名稱memberlist.join_members是一個列表,在有多個實例的情況下需要添加各個節(jié)點的主機名 /IP 地址。在 k8s 里面可以設置成一個service綁定到StatefulSets。query_range.results_cache.cache.enable_fifocache建議設置為false,我這里設置成了trueinstance_interface_names是一個列表,默認的為["en0","eth0"],可以根據(jù)需要設置對應的網(wǎng)卡名稱,一般不需要進行特殊設置。
創(chuàng)建 configmap
說明:將上面的內(nèi)容寫入到一個文件——>loki-all.yaml,把它作為一個 configmap 寫入 k8s 集群。可以使用如下命令創(chuàng)建:
$ kubectl create configmap --from-file ./loki-all.yaml loki-all
可以通過命令查看到已經(jīng)創(chuàng)建好的 configmap,具體操作詳見下圖 
創(chuàng)建持久化存儲
在 k8s 里面我們的數(shù)據(jù)是需要進行持久化的。Loki 收集起來的日志信息對于業(yè)務來說是至關重要的,因此需要在容器重啟的時候日志能夠保留下來。那么就需要用到 pv、pvc,后端存儲可以使用 nfs、glusterfs、hostPath、azureDisk、cephfs 等 20 種支持類型,這里因為沒有對應的環(huán)境就采用了 hostPath 方式。
apiVersion: v1
kind: PersistentVolume
metadata:
  name: loki
  namespace: default
spec:
  hostPath:
    path: /glusterfs/loki
    type: DirectoryOrCreate
  capacity:
    storage: 1Gi
  accessModes:
    - ReadWriteMany
---
apiVersion: v1
kind: PersistentVolumeClaim
metadata:
  name: loki
  namespace: default
spec:
  accessModes:
    - ReadWriteMany
  resources:
    requests:
      storage: 1Gi
  volumeName: loki
創(chuàng)建應用
準備好 k8s 的 StatefulSet 部署文件后就可以直接在集群里面創(chuàng)建應用了。
apiVersion: apps/v1
kind: StatefulSet
metadata:
  labels:
    app: loki
  name: loki
  namespace: default
spec:
  podManagementPolicy: OrderedReady
  replicas: 1
  selector:
    matchLabels:
      app: loki
  template:
    metadata:
      annotations:
        prometheus.io/port: http-metrics
        prometheus.io/scrape: "true"
      labels:
        app: loki
    spec:
      containers:
      - args:
        - -config.file=/etc/loki/loki-all.yaml
        image: grafana/loki:2.5.0
        imagePullPolicy: IfNotPresent
        livenessProbe:
          failureThreshold: 3
          httpGet:
            path: /ready
            port: http-metrics
            scheme: HTTP
          initialDelaySeconds: 45
          periodSeconds: 10
          successThreshold: 1
          timeoutSeconds: 1
        name: loki
        ports:
        - containerPort: 3100
          name: http-metrics
          protocol: TCP
        - containerPort: 9095
          name: grpc
          protocol: TCP
        - containerPort: 7946
          name: memberlist-port
          protocol: TCP
        readinessProbe:
          failureThreshold: 3
          httpGet:
            path: /ready
            port: http-metrics
            scheme: HTTP
          initialDelaySeconds: 45
          periodSeconds: 10
          successThreshold: 1
          timeoutSeconds: 1
        resources:
          requests:
            cpu: 500m
            memory: 500Mi
          limits:
            cpu: 500m
            memory: 500Mi
        securityContext:
          readOnlyRootFilesystem: true
        volumeMounts:
        - mountPath: /etc/loki
          name: config
        - mountPath: /data
          name: storage
      restartPolicy: Always
      securityContext:
        fsGroup: 10001
        runAsGroup: 10001
        runAsNonRoot: true
        runAsUser: 10001
      serviceAccount: loki
      serviceAccountName: loki
      volumes:
      - emptyDir: {}
        name: tmp
      - name: config
        configMap:
          name: loki
      - persistentVolumeClaim:
          claimName: loki
        name: storage
---
kind: Service
apiVersion: v1
metadata:
  name: loki-memberlist
  namespace: default
spec:
  ports:
    - name: loki-memberlist
      protocol: TCP
      port: 7946
      targetPort: 7946
  selector:
    kubepi.org/name: loki
---
kind: Service
apiVersion: v1
metadata:
  name: loki
  namespace: default
spec:
  ports:
    - name: loki
      protocol: TCP
      port: 3100
      targetPort: 3100
  selector:
    kubepi.org/name: loki
在上面的配置文件中我添加了一些 pod 級別的安全策略,這些安全策略還有集群級別的 PodSecurityPolicy,防止因為漏洞的原因造成集群的整個崩潰,關于集群級別的 psp,可以詳見官方文檔[1]。
驗證部署結(jié)果
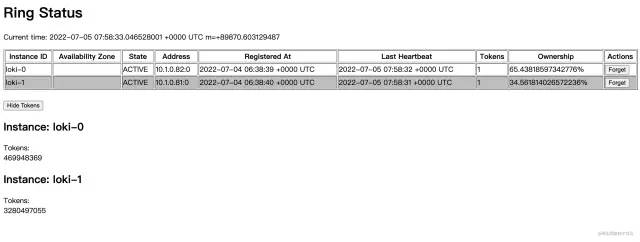
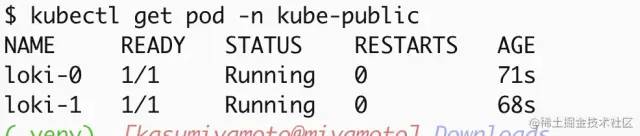 當看到上面的
 Running 狀態(tài)時可以通過 API 的方式看一下分發(fā)器是不是正常工作,當顯示 Active 時正常才會正常分發(fā)日志流到收集器(ingester)。
② 裸機部署
將 loki 放到系統(tǒng)的 /bin/ 目錄下,準備 grafana-loki.service 控制文件重載系統(tǒng)服務列表
[Unit]
Description=Grafana Loki Log Ingester
Documentation=https://grafana.com/logs/
After=network-online.target

[Service]
ExecStart=/bin/loki --config.file /etc/loki/loki-all.yaml
ExecReload=/bin/kill -s HUP $MAINPID
ExecStop=/bin/kill -s TERM $MAINPID

[Install]
WantedBy=multi-user.target
重載系統(tǒng)列表命令,可以直接系統(tǒng)自動管理服務:
$ systemctl daemon-reload
## 啟動服務
$ systemctl start grafana-loki
## 停止服務
$ systemctl stop grafana-loki
## 重載應用
$ systemctl reload grafana-loki
大顯身手之 Promtail 部署
部署客戶端收集日志時也需要創(chuàng)建一個配置文件,按照上面創(chuàng)建服務端的步驟創(chuàng)建。不同的是需要把日志內(nèi)容 push 到服務端
① k8s 部署
創(chuàng)建配置文件
server:
  log_level: info
  http_listen_port: 3101
clients:
  - url: http://loki:3100/loki/api/v1/push
positions:
  filename: /run/promtail/positions.yaml
scrape_configs:
  - job_name: kubernetes-pods
    pipeline_stages:
      - cri: {}
    kubernetes_sd_configs:
      - role: pod
    relabel_configs:
      - source_labels:
          - __meta_kubernetes_pod_controller_name
        regex: ([0-9a-z-.]+?)(-[0-9a-f]{8,10})?
        action: replace
        target_label: __tmp_controller_name
      - source_labels:
          - __meta_kubernetes_pod_label_app_kubernetes_io_name
          - __meta_kubernetes_pod_label_app
          - __tmp_controller_name
          - __meta_kubernetes_pod_name
        regex: ^;*([^;]+)(;.*)?$
        action: replace
        target_label: app
      - source_labels:
          - __meta_kubernetes_pod_label_app_kubernetes_io_instance
          - __meta_kubernetes_pod_label_release
        regex: ^;*([^;]+)(;.*)?$
        action: replace
        target_label: instance
      - source_labels:
          - __meta_kubernetes_pod_label_app_kubernetes_io_component
          - __meta_kubernetes_pod_label_component
        regex: ^;*([^;]+)(;.*)?$
        action: replace
        target_label: component
      - action: replace
        source_labels:
        - __meta_kubernetes_pod_node_name
        target_label: node_name
      - action: replace
        source_labels:
        - __meta_kubernetes_namespace
        target_label: namespace
      - action: replace
        replacement: $1
        separator: /
        source_labels:
        - namespace
        - app
        target_label: job
      - action: replace
        source_labels:
        - __meta_kubernetes_pod_name
        target_label: pod
      - action: replace
        source_labels:
        - __meta_kubernetes_pod_container_name
        target_label: container
      - action: replace
        replacement: /var/log/pods/*$1/*.log
        separator: /
        source_labels:
        - __meta_kubernetes_pod_uid
        - __meta_kubernetes_pod_container_name
        target_label: __path__
      - action: replace
        regex: true/(.*)
        replacement: /var/log/pods/*$1/*.log
        separator: /
        source_labels:
        - __meta_kubernetes_pod_annotationpresent_kubernetes_io_config_hash
        - __meta_kubernetes_pod_annotation_kubernetes_io_config_hash
        - __meta_kubernetes_pod_container_name
        target_label: __path__
用上面的內(nèi)容創(chuàng)建一個 configMap,方法同上
創(chuàng)建 DaemonSet 文件
Promtail 是一個無狀態(tài)應用不需要進行持久化存儲只需要部署到集群里面就可以了,還是同樣的準備 DaemonSets 創(chuàng)建文件。
kind: DaemonSet
apiVersion: apps/v1
metadata:
  name: promtail
  namespace: default
  labels:
    app.kubernetes.io/instance: promtail
    app.kubernetes.io/name: promtail
    app.kubernetes.io/version: 2.5.0
spec:
  selector:
    matchLabels:
      app.kubernetes.io/instance: promtail
      app.kubernetes.io/name: promtail
  template:
    metadata:
      labels:
        app.kubernetes.io/instance: promtail
        app.kubernetes.io/name: promtail
    spec:
      volumes:
        - name: config
          configMap:
            name: promtail
        - name: run
          hostPath:
            path: /run/promtail
        - name: containers
          hostPath:
            path: /var/lib/docker/containers
        - name: pods
          hostPath:
            path: /var/log/pods
      containers:
        - name: promtail
          image: docker.io/grafana/promtail:2.3.0
          args:
            - '-config.file=/etc/promtail/promtail.yaml'
          ports:
            - name: http-metrics
              containerPort: 3101
              protocol: TCP
          env:
            - name: HOSTNAME
              valueFrom:
                fieldRef:
                  apiVersion: v1
                  fieldPath: spec.nodeName
          volumeMounts:
            - name: config
              mountPath: /etc/promtail
            - name: run
              mountPath: /run/promtail
            - name: containers
              readOnly: true
              mountPath: /var/lib/docker/containers
            - name: pods
              readOnly: true
              mountPath: /var/log/pods
          readinessProbe:
            httpGet:
              path: /ready
              port: http-metrics
              scheme: HTTP
            initialDelaySeconds: 10
            timeoutSeconds: 1
            periodSeconds: 10
            successThreshold: 1
            failureThreshold: 5
          imagePullPolicy: IfNotPresent
          securityContext:
            capabilities:
              drop:
                - ALL
            readOnlyRootFilesystem: false
            allowPrivilegeEscalation: false
      restartPolicy: Always
      serviceAccountName: promtail
      serviceAccount: promtail
      tolerations:
        - key: node-role.kubernetes.io/master
          operator: Exists
          effect: NoSchedule
        - key: node-role.kubernetes.io/control-plane
          operator: Exists
          effect: NoSchedule
創(chuàng)建 promtail 應用
$ kubectl apply -f promtail.yaml
使用上面這個命令創(chuàng)建后就可以看到服務已經(jīng)創(chuàng)建好了。接下來就是在 Grafana 里面添加 DataSource 查看數(shù)據(jù)了。 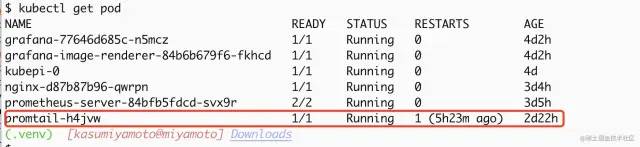
② 裸機部署
如果是裸機部署的情況下,需要對上面的配置文件做一下稍微的改動,更改 clients 得地址就可以,文件存放到 /etc/loki/ 下,例如改成:
clients:
  - url: http://ipaddress:port/loki/api/v1/push
添加系統(tǒng)開機啟動配置,service 配置文件存放位置 /usr/lib/systemd/system/loki-promtail.service 內(nèi)容如下
[Unit]
Description=Grafana Loki Log Ingester
Documentation=https://grafana.com/logs/
After=network-online.target

[Service]
ExecStart=/bin/promtail --config.file /etc/loki/loki-promtail.yaml
ExecReload=/bin/kill -s HUP $MAINPID
ExecStop=/bin/kill -s TERM $MAINPID

[Install]
WantedBy=multi-user.target
啟動方式同上面服務端部署內(nèi)容
Loki in DataSource
添加數(shù)據(jù)源
具體步驟 : Grafana->Setting->DataSources->AddDataSource->Loki
注意點: http 的 URL 地址,應用、服務部署在哪個 namespace 下,就需要指定它的 FQDN 地址,它的格式是 ServiceName.namespace。如果默認在 default 下、創(chuàng)建的端口號是 3100,就需要填寫為 http://loki:3100,這里為什么不寫 IP 地址而寫成服務的名字,是因為在 k8s 集群里面有個 dns 服務器會自動解析這個地址。 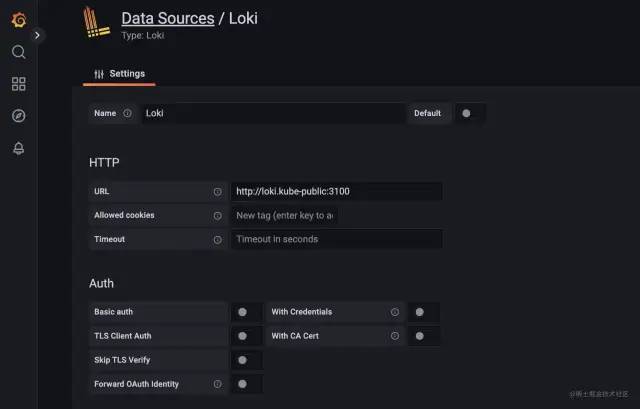
查找日志信息
其他客戶端配置
Logstash 作為日志收集客戶端
安裝插件
在啟動 Logstash 后我們需要安裝一個插件,可以通過這個命令安裝 loki 的輸出插件,安裝完成之后可以在 logstash 的 output 中添加信息。
$ bin/logstash-plugin install logstash-output-loki
添加配置進行測試
完整的 logstash 配置信息,可以參考官網(wǎng)給出的內(nèi)容LogstashConfigFile[2]
output {
  loki {
    [url => "" | default = none | required=true]
    [tenant_id => string | default = nil | required=false]
    [message_field => string | default = "message" | required=false]
    [include_fields => array | default = [] | required=false]
    [batch_wait => number | default = 1(s) | required=false]
    [batch_size => number | default = 102400(bytes) | required=false]
    [min_delay => number | default = 1(s) | required=false]
    [max_delay => number | default = 300(s) | required=false]
    [retries => number | default = 10 | required=false]
    [username => string | default = nil | required=false]
    [password => secret | default = nil | required=false]
    [cert => path | default = nil | required=false]
    [key => path | default = nil| required=false]
    [ca_cert => path | default = nil | required=false]
    [insecure_skip_verify => boolean | default = false | required=false]
  }
}
或者采用 logstash 的 http 輸出模塊,配置如下:
output {
    http {
        format => "json"
        http_method => "post"
        content_type => "application/json"
        connect_timeout => 10
        url => "http://loki:3100/loki/api/v1/push"
        message => '"message":"%{message}"}'
    }
}
Helm 安裝
如果你想簡便安裝的話,可以采用 helm 來安裝。helm 將所有的安裝步驟都進行了封裝,簡化了安裝步驟。對于想詳細了解 k8s 的人來說,helm 不太適合。因為它封裝后自動執(zhí)行,k8s 管理員不知道各組件之間是如何依賴的,可能會造成誤區(qū)。 廢話不多說,下面開始 helm 安裝
添加 repo 源
$ helm repo add grafana https://grafana.github.io/helm-charts
更新源
$ helm repo update
部署
默認配置
$ helm upgrade --install loki grafana/loki-simple-scalable
自定義 namespace
$ helm upgrade --install loki --namespace=loki grafana/loki-simple-scalable
自定義配置信息
$ helm upgrade --install loki grafana/loki-simple-scalable --set "key1=val1,key2=val2,..."
故障解決方案
502 BadGateWay
loki 的地址填寫不正確 http://LokiServiceNamehttp://LokiServiceName.namespacehttp://LokiServiceName.namespace:ServicePort在 k8s 里面,地址填寫錯誤造成了 502。檢查一下 loki 的地址是否是以下內(nèi)容: grafana 和 loki 在不同的節(jié)點上,檢查一下節(jié)點間網(wǎng)絡通信狀態(tài)、防火墻策略
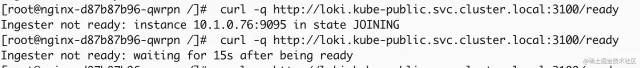
Ingester not ready: instance xx:9095 in state JOINING
耐心等待一會,因為是 allInOne 模式程序啟動需要一定的時間。
too many unhealthy instances in the ring
將 ingester.lifecycler.replication_factor改為 1,是因為這個設置不正確造成的。這個在啟動的時候會設置為多個復制源,但當前只部署了一個所以在查看 label 的時候提示這個。
Data source connected, but no labels received. Verify that Loki and Promtail is configured properly
promtail 無法將收集到的日志發(fā)送給 loki,許可檢查一下 promtail 的輸出是不是正常; promtail 在 loki 還沒有準備就緒的時候把日志發(fā)送過來了,但 loki 沒有接收到。如果需要重新接收日志,需要刪除 positions.yaml文件,具體路徑可以用find查找一下位置;promtail 忽略了目標日志文件或者配置文件錯誤造成的無法正常啟動; promtail 無法在指定的位置發(fā)現(xiàn)日志文件 配置文件參考 1[3]。
引用鏈接
官方文檔: https://link.juejin.cn?target=https%3A%2F%2Fkubernetes.io%2Fdocs%2Fconcepts%2Fsecurity%2Fpod-security-policy%2F
[2]LogstashConfigFile: https://link.juejin.cn?target=https%3A%2F%2Fwww.elastic.co%2Fguide%2Fen%2Flogstash%2Fcurrent%2Fconfiguration-file-structure.html
[3]配置文件參考 1: https://link.juejin.cn?target=https%3A%2F%2Fgrafana.com%2Fdocs%2Floki%2Flatest%2Fconfiguration%2F%23server


你可能還喜歡
點擊下方圖片即可閱讀
2022-10-24

2022-10-20

2022-10-19


云原生是一種信仰 ??
關注公眾號
后臺回復?k8s?獲取史上最方便快捷的 Kubernetes 高可用部署工具,只需一條命令,連 ssh 都不需要!

點擊 "閱讀原文" 獲取更好的閱讀體驗!
發(fā)現(xiàn)朋友圈變“安靜”了嗎?
