
從pheatmap無縫遷移至ComplexHeatmap
pheatmap是一個(gè)非常受歡迎的繪制熱圖的R包。ComplexHeatmap包即是受之啟發(fā)而來。你可以發(fā)現(xiàn)Heatmap()函數(shù)中很多參數(shù)都與pheatmap()相同。在pheatmap的時(shí)代(請?jiān)试S我這么說),pheatmap意思是pretty heatmap,但是隨著時(shí)間推進(jìn),技術(shù)發(fā)展,各種新的數(shù)據(jù)出現(xiàn),pretty is no more pretty,我們需要更加復(fù)雜和更有效率的熱圖可視化方法對龐大的數(shù)據(jù)進(jìn)行快速并且有效的解讀,因此我開發(fā)并且一直維護(hù)和改進(jìn)著ComplexHeatmap包。
為了使龐大并且“陳舊”的(對不起,我不應(yīng)該這么說)pheatmap用戶群能夠迅速并且無痛的遷移至ComplexHeatmap,從2.5.2版本開始,我在ComplexHeatmap包中加入了一個(gè)pheatmap()函數(shù),它涵蓋了pheatmap::pheatmap()所有的功能,也就是說,它提供了和pheatmap::pheatmap()一模一樣的參數(shù),并且生成的熱圖的樣式也幾乎相同。同時(shí),ComplexHeatmap::pheatmap()函數(shù)也能使用ComplexHeatmap獨(dú)有的功能,比如對行和列進(jìn)行切分,加入自定義的annotation,多個(gè)熱圖和annotation的連接,或者創(chuàng)建一個(gè)互動的熱圖(interactive heatmap, 通過ht_shiny()函數(shù))
ComplexHeatmap::pheatmap()包含了pheatmap::pheatmap()中所有的參數(shù),這意味著,當(dāng)你從pheatmap遷移至ComplexHeatmap時(shí),你無需添加任何額外的步驟,你只需要載入ComplexHeatmap而不是pheatmap包,然后重新運(yùn)行你原始的pheatmap代碼。剩下的你只是去見證奇跡的發(fā)生。
注意如下五個(gè)pheatmap::pheatmap()的參數(shù)在ComplexHeatmap::pheatmap()中被忽視:
kmeans_k:在pheatmap::pheatmap()中,如果這個(gè)參數(shù)被設(shè)定,輸入矩陣會進(jìn)行k均值聚類,然后每個(gè)cluster使用其均值向量表示。最終的熱圖是k個(gè)均值向量的熱圖。此操作改變了原始矩陣的大小,而且每個(gè)cluster的大小信息丟失了,直接解讀均值向量可能會造成對數(shù)據(jù)的誤解。我不贊成此操作,因此我沒有支持這個(gè)參數(shù)。在ComplexHeatmap中,row_km和column_km參數(shù)可能是一個(gè)更好的選擇。filename:如果這個(gè)參數(shù)被設(shè)定,熱圖直接保存至指定的文件中。我認(rèn)為這只是畫蛇添足(沒有貶低pheatmap的意思,只是最近在給小孩講成語故事,然后想在這里使用一下)的一步,ComplexHeatmap::pheatmap()不支持此參數(shù)。width:filename的寬度。height:filename的長度。silent: 是否打印信息。
在pheatmap::pheatmap()中,color參數(shù)需要設(shè)置為一個(gè)長長的顏色向量(如果你想用100種顏色的話),比如:
pheatmap::pheatmap(mat,?
????color?=?colorRampPalette(rev(brewer.pal(n?=?7,?name?=?"RdYlBu")))(100)
)
在ComplexHeatmap::pheatmap()中,你可以簡化無需使用colorRampPalette()去擴(kuò)展更多的顏色,你可以直接簡化為如下,顏色會被自動插值和擴(kuò)展。
ComplexHeatmap::pheatmap(mat,?
????color?=?rev(brewer.pal(n?=?7,?name?=?"RdYlBu"))
)
例子
我們首先創(chuàng)建一個(gè)隨機(jī)數(shù)據(jù),這個(gè)來自于pheatmap包中提供的例子(https://rdrr.io/cran/pheatmap/man/pheatmap.html).
test?=?matrix(rnorm(200),?20,?10)
test[1:10,?seq(1,?10,?2)]?=?test[1:10,?seq(1,?10,?2)]?+?3
test[11:20,?seq(2,?10,?2)]?=?test[11:20,?seq(2,?10,?2)]?+?2
test[15:20,?seq(2,?10,?2)]?=?test[15:20,?seq(2,?10,?2)]?+?4
colnames(test)?=?paste("Test",?1:10,?sep?=?"")
rownames(test)?=?paste("Gene",?1:20,?sep?=?"")
我們載入ComplexHeatmap包,然后執(zhí)行pheatmap()函數(shù),生成一副和pheatmap::pheatmap()非常類似的熱圖。
library(ComplexHeatmap)
#?注意這是ComplexHeatmap::pheatmap
pheatmap(test)
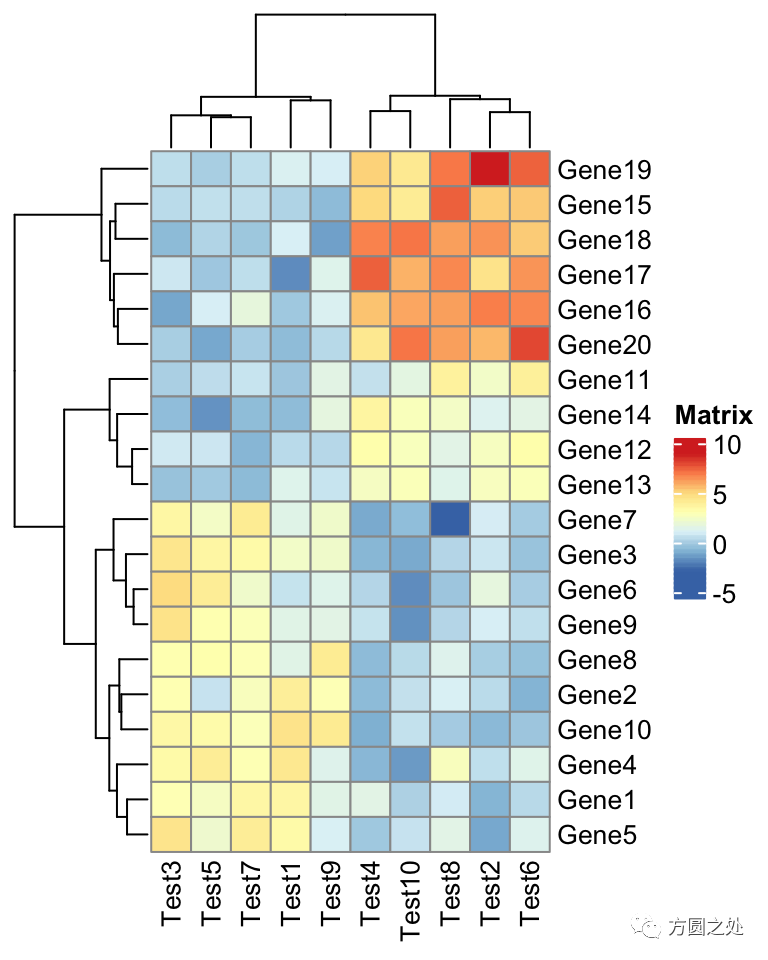
在ComplexHeatmap::pheatmap()中,按照pheatmap::pheatmap()的樣式進(jìn)行了相應(yīng)的配置,因此,大部分元素的樣式一模一樣。只有少部分不一致,比如說熱圖的legend。
下一個(gè)例子是在熱圖中加入annotation。以下代碼是在pheatmap()中添加annotation。如果你是pheatmap()用戶,你應(yīng)該對annotation的數(shù)據(jù)格式不太陌生。
annotation_col?=?data.frame(
????CellType?=?factor(rep(c("CT1",?"CT2"),?5)),?
????Time?=?1:5
)
rownames(annotation_col)?=?paste("Test",?1:10,?sep?=?"")

annotation_row?=?data.frame(
????GeneClass?=?factor(rep(c("Path1",?"Path2",?"Path3"),?c(10,?4,?6)))
)
rownames(annotation_row)?=?paste("Gene",?1:20,?sep?=?"")

ann_colors?=?list(
????Time?=?c("white",?"firebrick"),
????CellType?=?c(CT1?=?"#1B9E77",?CT2?=?"#D95F02"),
????GeneClass?=?c(Path1?=?"#7570B3",?Path2?=?"#E7298A",?Path3?=?"#66A61E")
)

pheatmap(test,?
????annotation_col?=?annotation_col,?
????annotation_row?=?annotation_row,?
????annotation_colors?=?ann_colors)
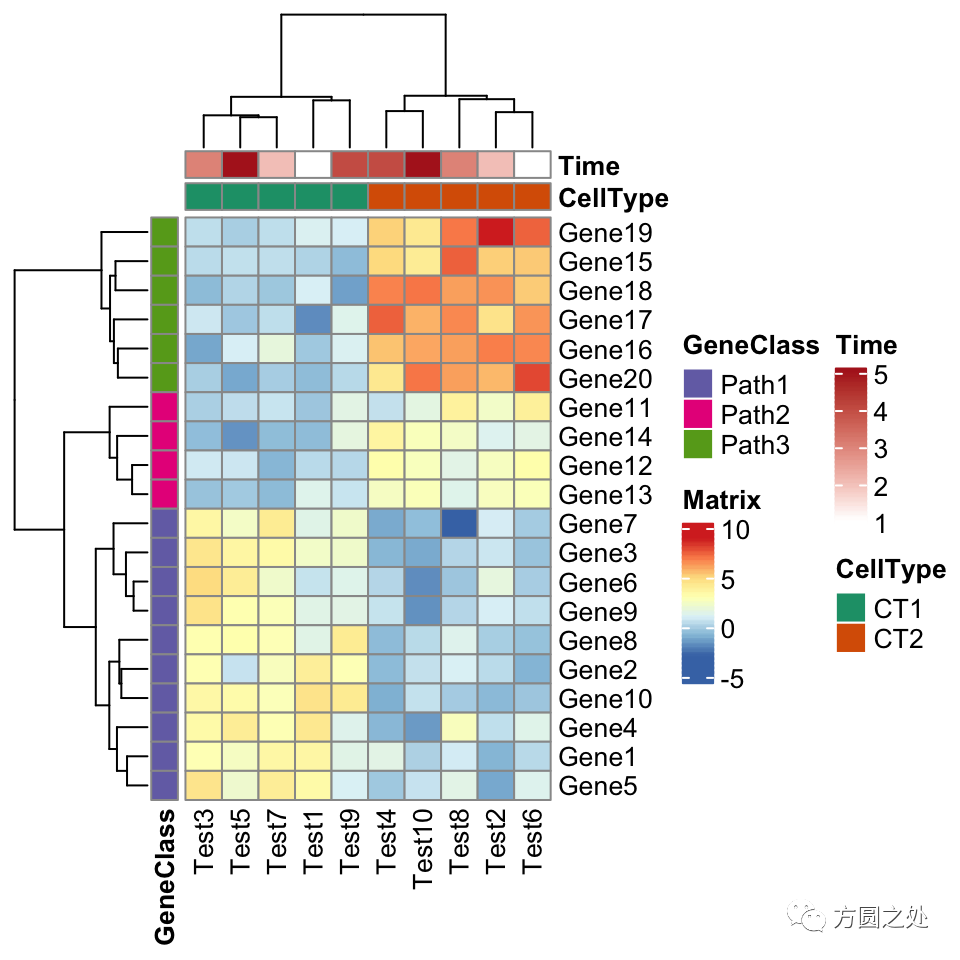
看起來和pheatmap::pheatmap()還是很一致。
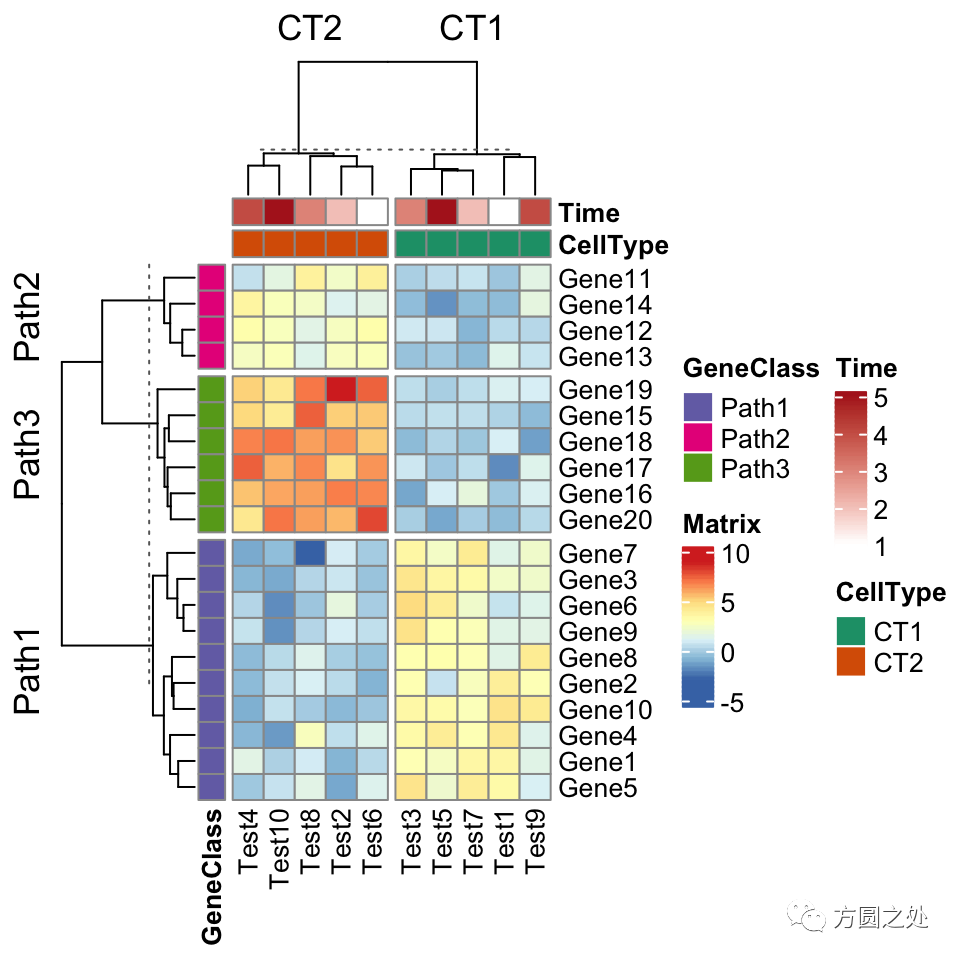
ComplexHeatmap::pheatmap()內(nèi)部其實(shí)使用了Heatmap()函數(shù),因此更多的參數(shù)都最終傳遞給了Heatmap()。我們可以在pheatmap()中使用一些Heatmap()特有的參數(shù),比如row_split和column_split來對行和列進(jìn)行切分。
pheatmap(test,?
????annotation_col?=?annotation_col,?
????annotation_row?=?annotation_row,?
????annotation_colors?=?ann_colors,?
????row_split?=?annotation_row$GeneClass,
????column_split?=?annotation_col$CellType)
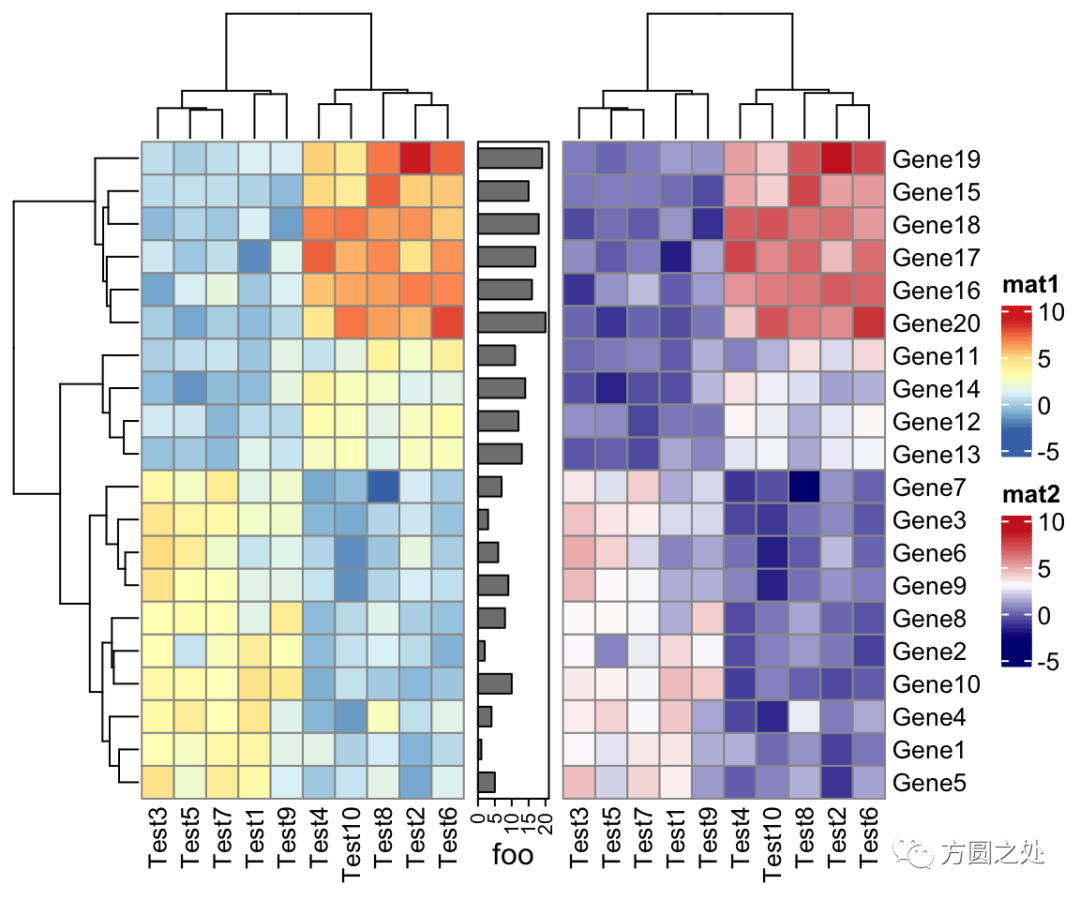
ComplexHeatmap::pheatmap()返回一個(gè)Heatmap對象,因此它可以與其他Heatmap/HeatmapAnnotation對象連接。換句話說,你可以使用炫酷的+或者%v%對多個(gè)pheatmap水平連接或者垂直連接。
p1?=?pheatmap(test,?name?=?"mat1")
p2?=?rowAnnotation(foo?=?anno_barplot(1:nrow(test)))
p3?=?pheatmap(test,?name?=?"mat2",?
????col?=?c("navy",?"white",?"firebrick3"))
p1?+?p2?+?p3
ComplexHeatmap支持將一個(gè)熱圖導(dǎo)出為一個(gè)shiny app,這也同樣適用于pheatmap(),因此你可以這樣做:
ht?=?pheatmap(...)
ht_shiny(ht)?#?強(qiáng)烈建議試一試
還有一件重要的小事是,因?yàn)?code style="font-size: 14px;overflow-wrap: break-word;padding: 2px 4px;border-radius: 4px;margin-right: 2px;margin-left: 2px;color: rgb(30, 107, 184);background-color: rgba(27, 31, 35, 0.05);font-family: "Operator Mono", Consolas, Monaco, Menlo, monospace;word-break: break-all;">ComplexHeatmap::pheatmap()返回一個(gè)Heatmap對象,如果pheatmap()并沒有在一個(gè)interactive的環(huán)境執(zhí)行,比如說在一個(gè)R腳本中,或者在一個(gè)函數(shù)/for loop中,你應(yīng)該顯式的調(diào)用draw()函數(shù)進(jìn)行畫圖。
for(...)?{
????p?=?pheatmap(...)
????draw(p)
}
最后我想說的事,這篇文章的主旨并不是鼓勵用戶直接使用ComplexHeatmap::pheatmap(),我只是在此展示了pheatmap完全可以用ComplexHeatmap來代替,而且ComplexHeatmap提供了工具讓用戶無需任何額外的操作(zero effort)就可以遷移以前舊的代碼。但是我還是強(qiáng)烈建議用戶直接使用ComplexHeatmap中的“正經(jīng)函數(shù)”。
從pheatmap到ComplexHeatmap的翻譯
在“閱讀原文”中,你可以找到一個(gè)表格,其中詳細(xì)的列出了如何將pheatmap::pheatmap()中的參數(shù)對應(yīng)到Heatmap()中。
比較
這一小節(jié)我比較了相同參數(shù)下pheatmap::pheatmap()生成的熱圖和ComplexHeatmap::pheatmap()的相似度。我使用了pheatmap包中所有的例子(https://rdrr.io/cran/pheatmap/man/pheatmap.html)。同時(shí)我也使用了ComplexHeatmap中提供的一個(gè)簡單的幫助函數(shù)ComplexHeatmap::compare_pheatmap()。它的功能就是把參數(shù)同時(shí)傳遞給pheatmap::pheatmap()和ComplexHeatmap::pheatmap(),然后生成兩幅熱圖,這樣可以直接進(jìn)行比較。因此如下代碼
compare_pheatmap(test)
其實(shí)等同于:
pheatmap::pheatmap(test)
ComplexHeatmap::pheatmap(test)
在往下閱讀之前,我先告訴你結(jié)論:pheatmap::pheatmap()和ComplexHeatmap::pheatmap()產(chǎn)生的熱圖幾乎完全相同。
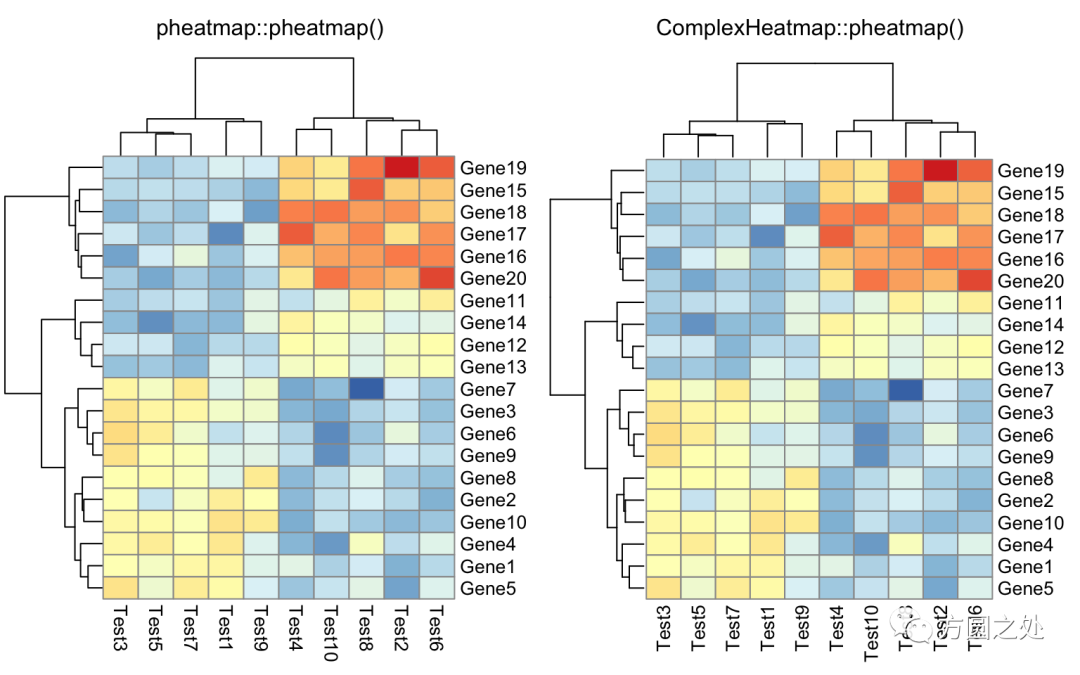
只提供一個(gè)矩陣:
compare_pheatmap(test)

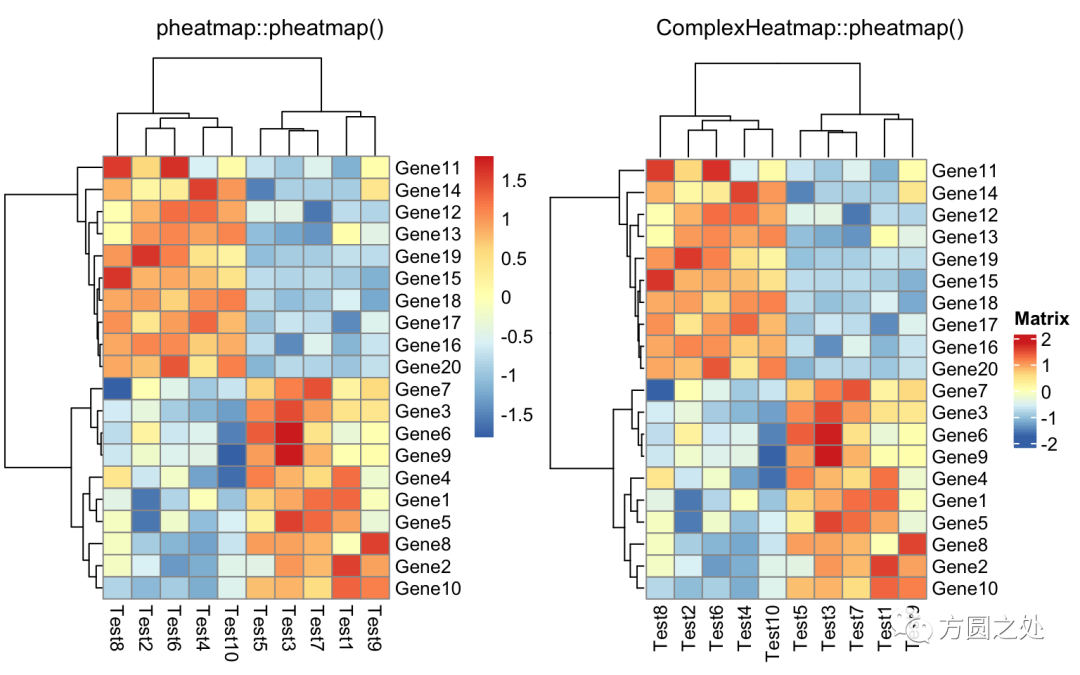
對列進(jìn)行z-score歸一化,行聚類距離使用相關(guān)性距離:
compare_pheatmap(test,?
????scale?=?"row",?
????clustering_distance_rows?=?"correlation")
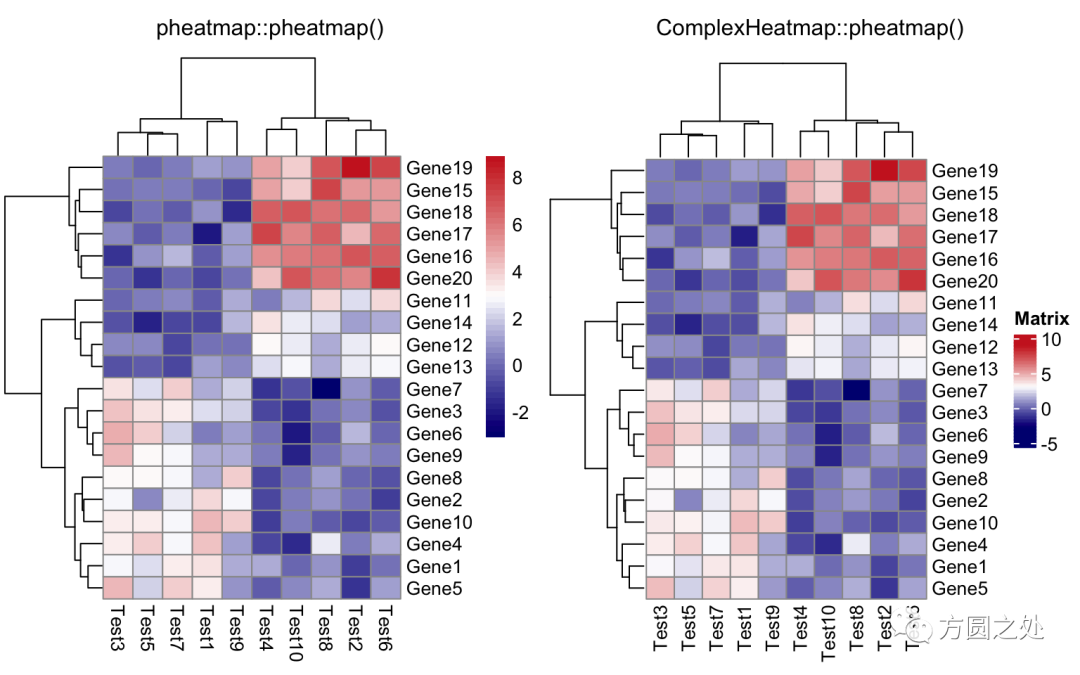
設(shè)定顏色:
compare_pheatmap(test,?
????color?=?colorRampPalette(c("navy",?"white",?"firebrick3"))(50))
不對行聚類:
compare_pheatmap(test,?
????cluster_row?=?FALSE)

不顯示legend:
compare_pheatmap(test,?
????legend?=?FALSE)
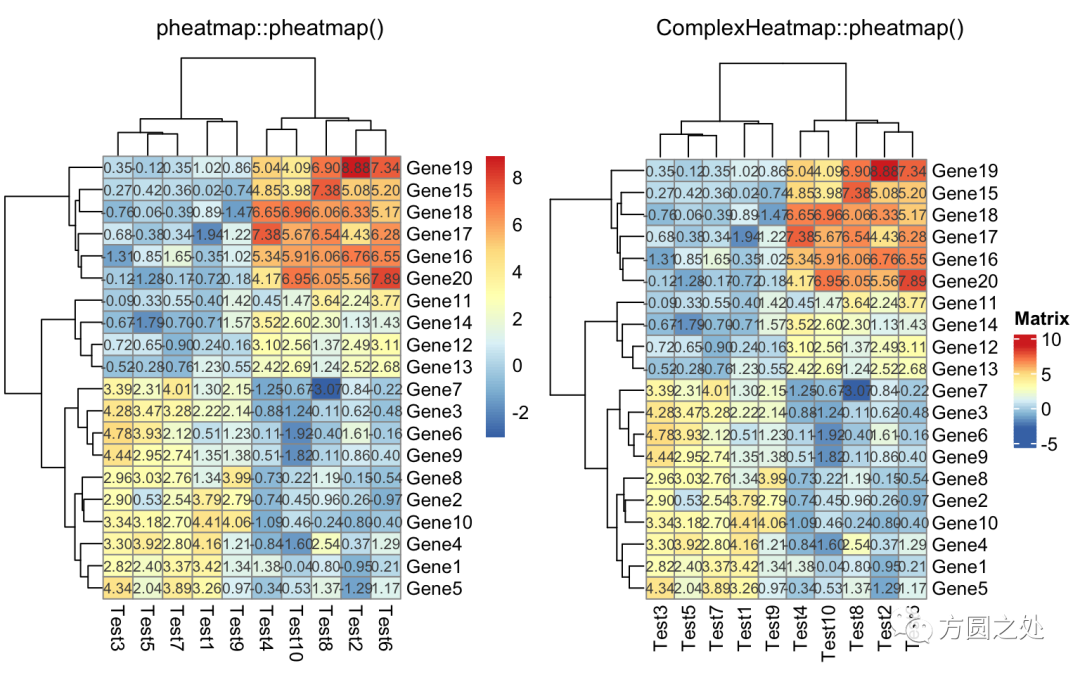
在矩陣格子上顯示數(shù)值:
compare_pheatmap(test,?
????display_numbers?=?TRUE)
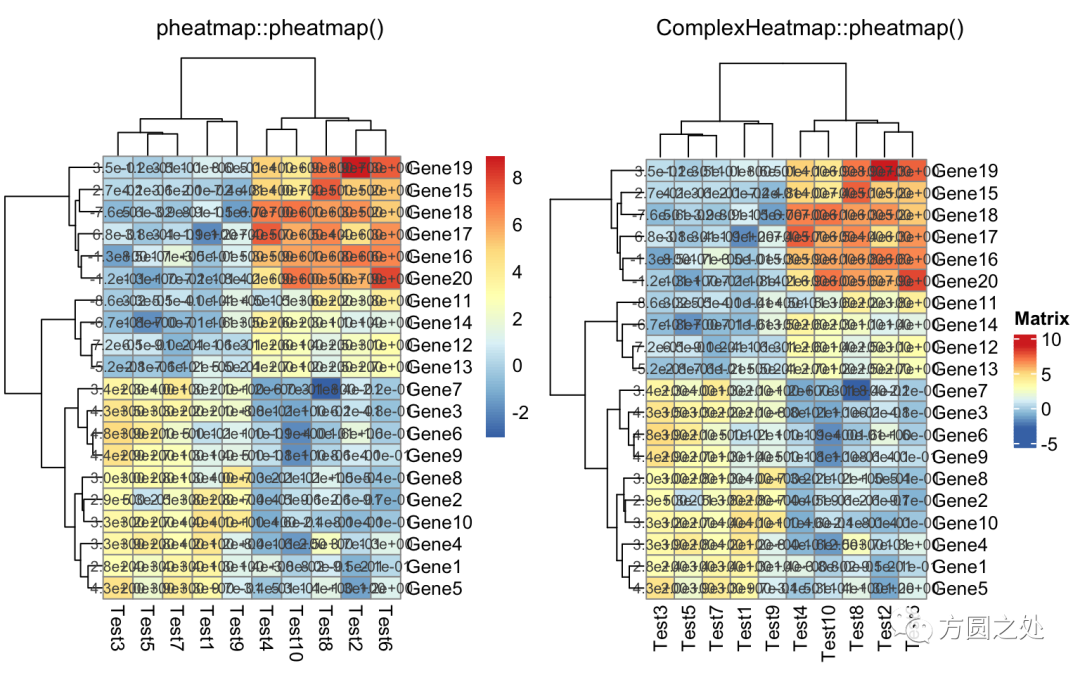
對矩陣格子上的數(shù)值進(jìn)行格式化:
compare_pheatmap(test,?
????display_numbers?=?TRUE,?
????number_format?=?"%.1e")
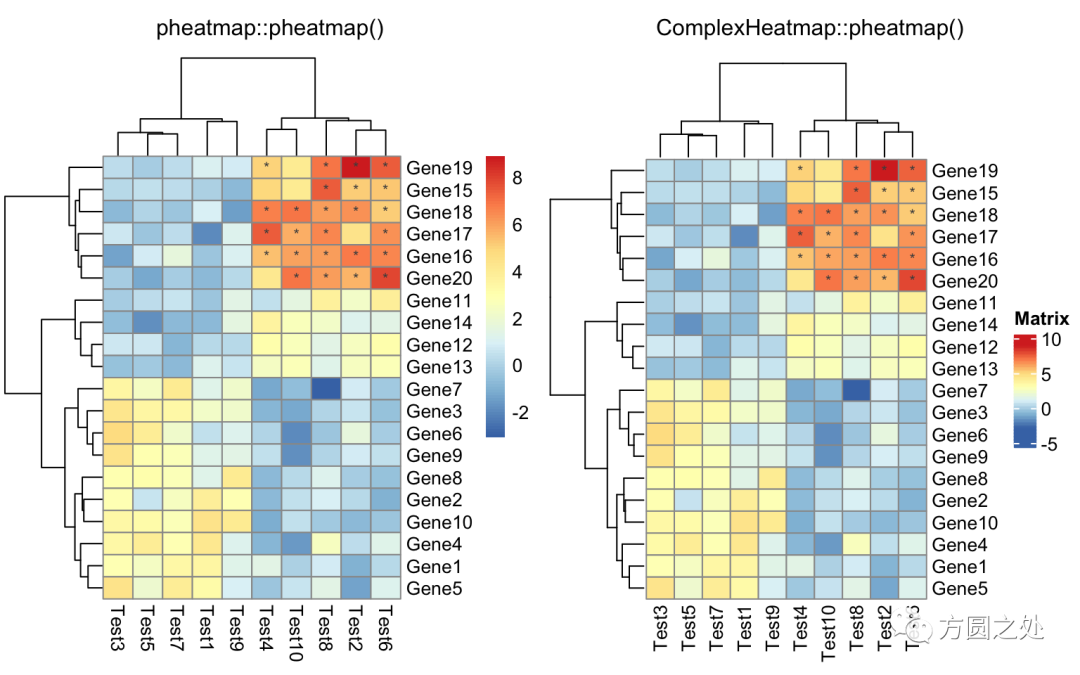
自定義矩陣格子上的文字:
compare_pheatmap(test,?
????display_numbers?=?matrix(ifelse(test?>?5,?"*",?""),?
?????????????????????????????nrow(test)))
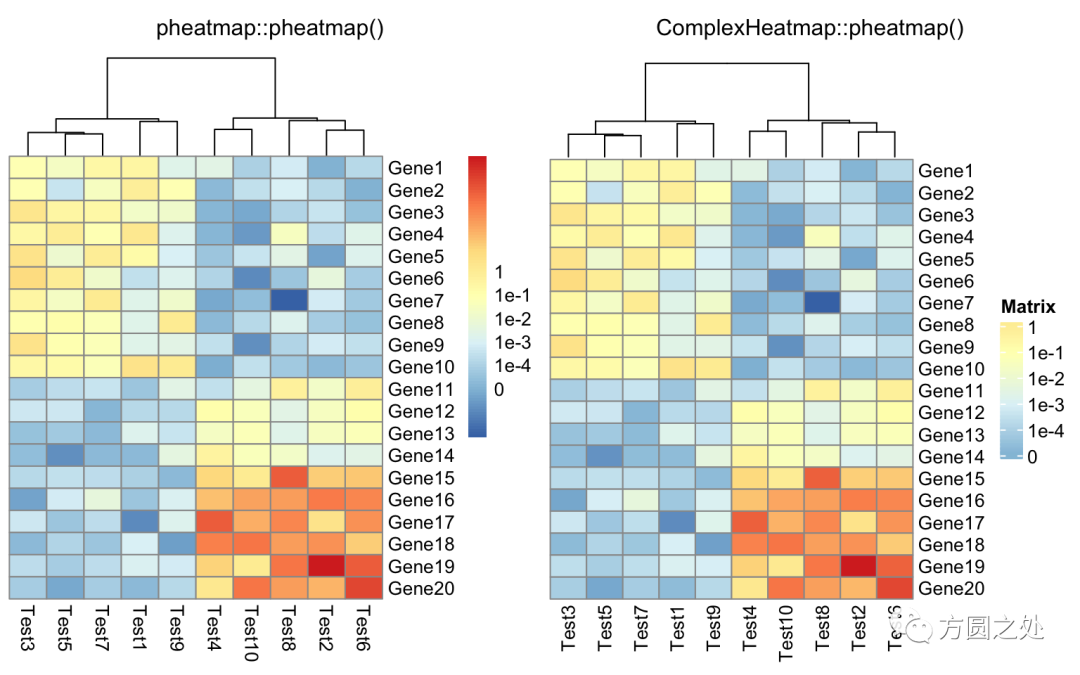
定義legend上的label:
compare_pheatmap(test,?
????cluster_row?=?FALSE,?
????legend_breaks?=?-1:4,?
????legend_labels?=?c("0",?"1e-4",?"1e-3",?"1e-2",?"1e-1",?"1"))
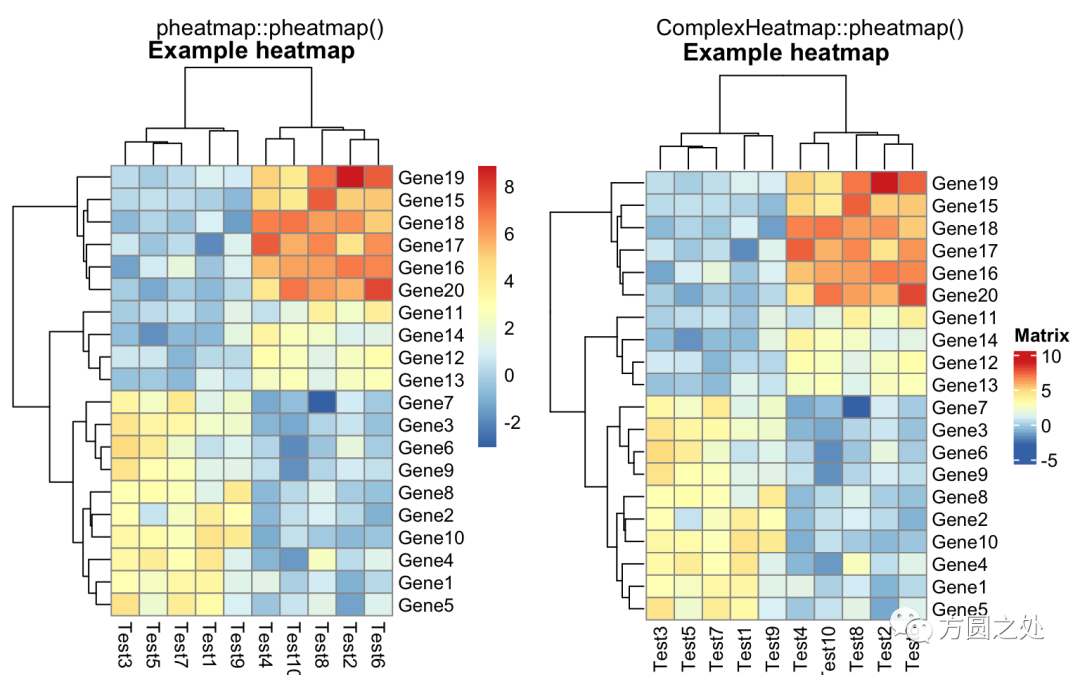
熱圖的標(biāo)題:
compare_pheatmap(test,?
????cellwidth?=?15,?
????cellheight?=?12,?
????main?=?"Example?heatmap")
添加列的annotation:
annotation_col?=?data.frame(
????CellType?=?factor(rep(c("CT1",?"CT2"),?5)),?
????Time?=?1:5
)
rownames(annotation_col)?=?paste("Test",?1:10,?sep?=?"")

annotation_row?=?data.frame(
????GeneClass?=?factor(rep(c("Path1",?"Path2",?"Path3"),?c(10,?4,?6)))
)
rownames(annotation_row)?=?paste("Gene",?1:20,?sep?=?"")

compare_pheatmap(test,?
????annotation_col?=?annotation_col)
不繪制annotation的legend:
compare_pheatmap(test,?
????annotation_col?=?annotation_col,?
????annotation_legend?=?FALSE)
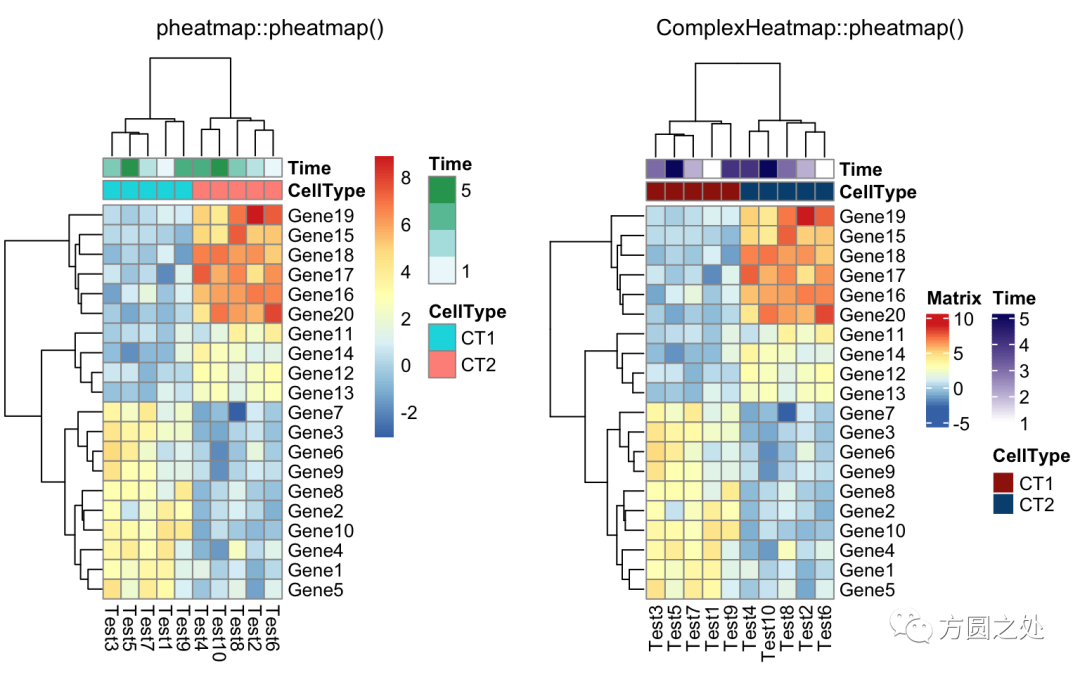
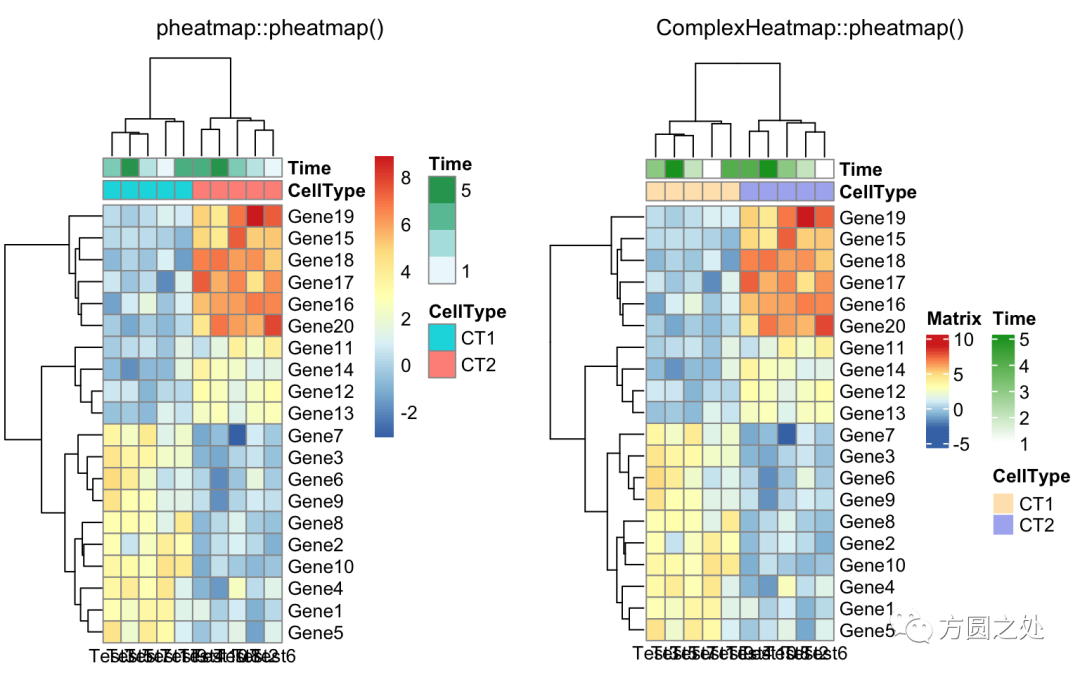
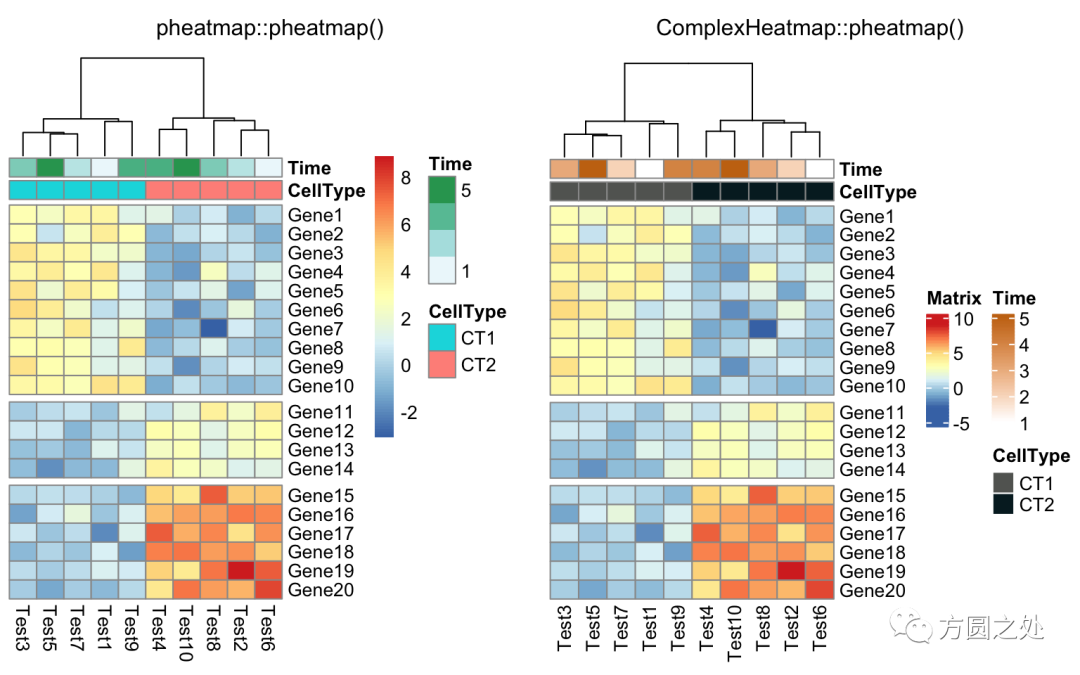
同時(shí)添加行和列的annotation:
compare_pheatmap(test,?
????annotation_col?=?annotation_col,?
????annotation_row?=?annotation_row)
調(diào)整列名的旋轉(zhuǎn):
compare_pheatmap(test,?
????annotation_col?=?annotation_col,?
????annotation_row?=?annotation_row,?
????angle_col?=?"45")
調(diào)整列名的旋轉(zhuǎn)至水平方向:
compare_pheatmap(test,?
????annotation_col?=?annotation_col,?
????angle_col?=?"0")
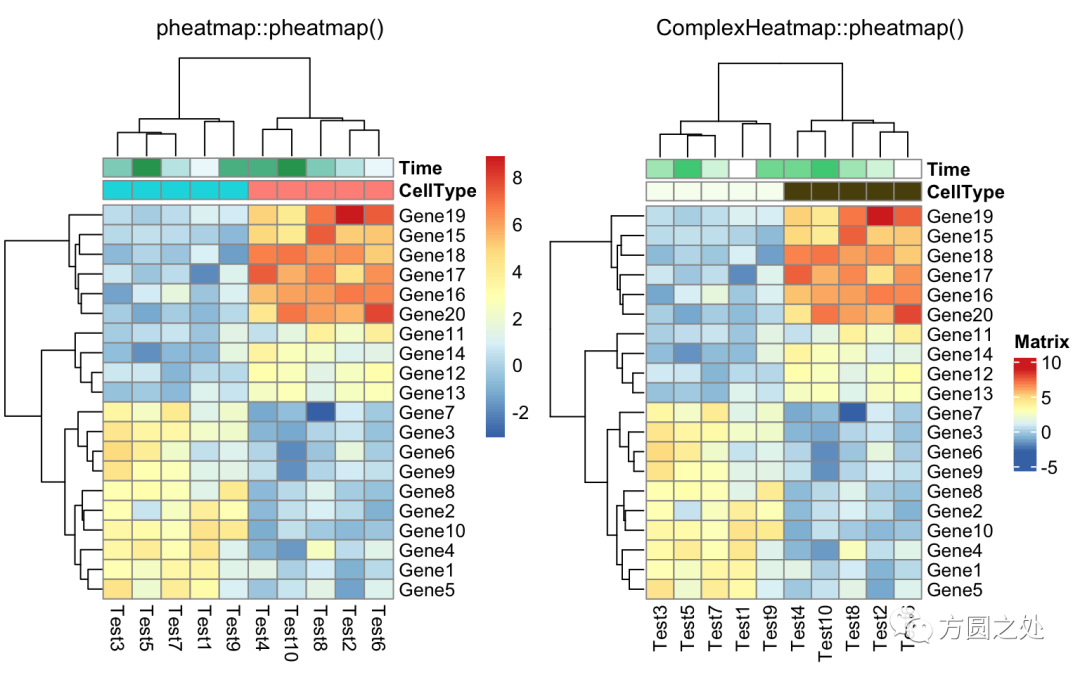
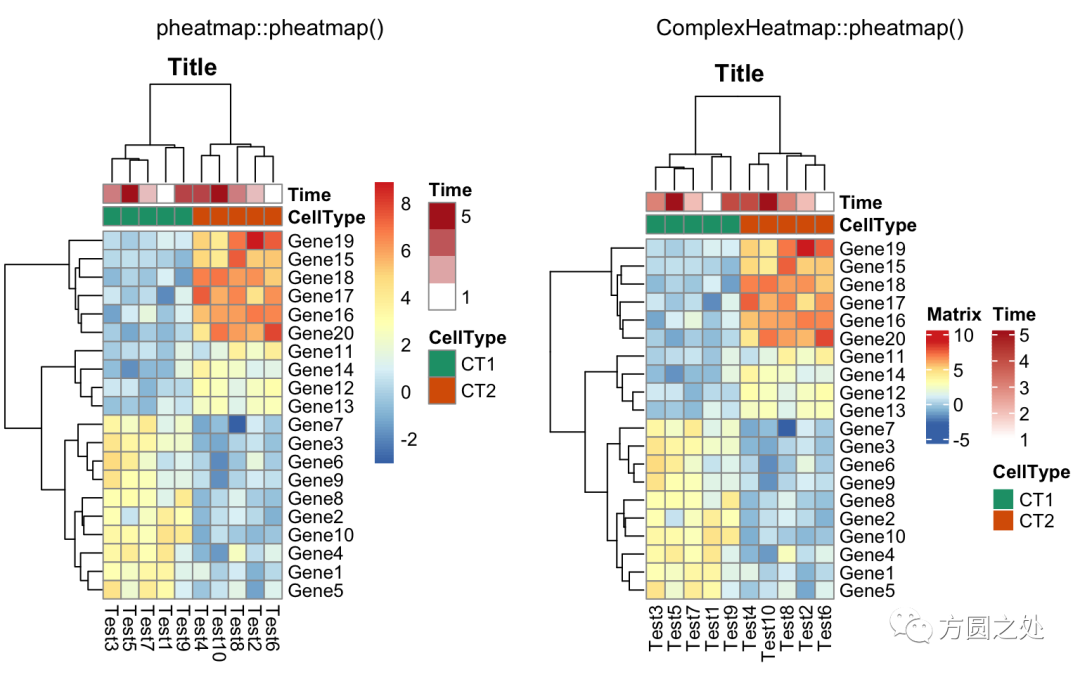
控制annotation的顏色:
ann_colors?=?list(
????Time?=?c("white",?"firebrick"),
????CellType?=?c(CT1?=?"#1B9E77",?CT2?=?"#D95F02"),
????GeneClass?=?c(Path1?=?"#7570B3",?Path2?=?"#E7298A",?Path3?=?"#66A61E")
)

compare_pheatmap(test,?
????annotation_col?=?annotation_col,?
????annotation_colors?=?ann_colors,?
????main?=?"Title")
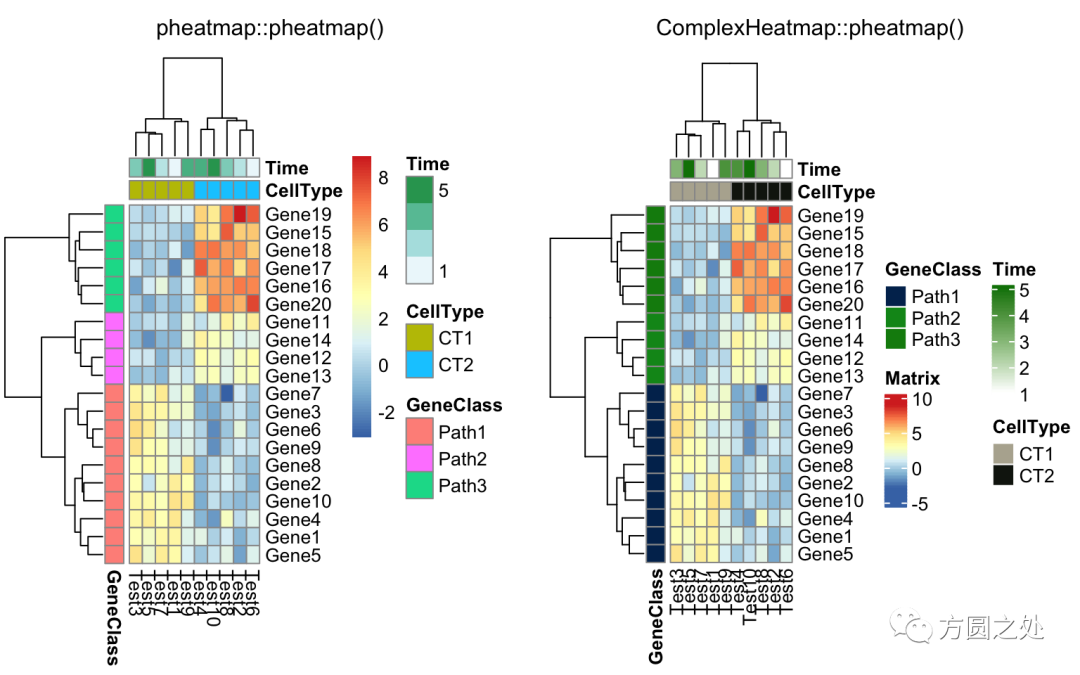
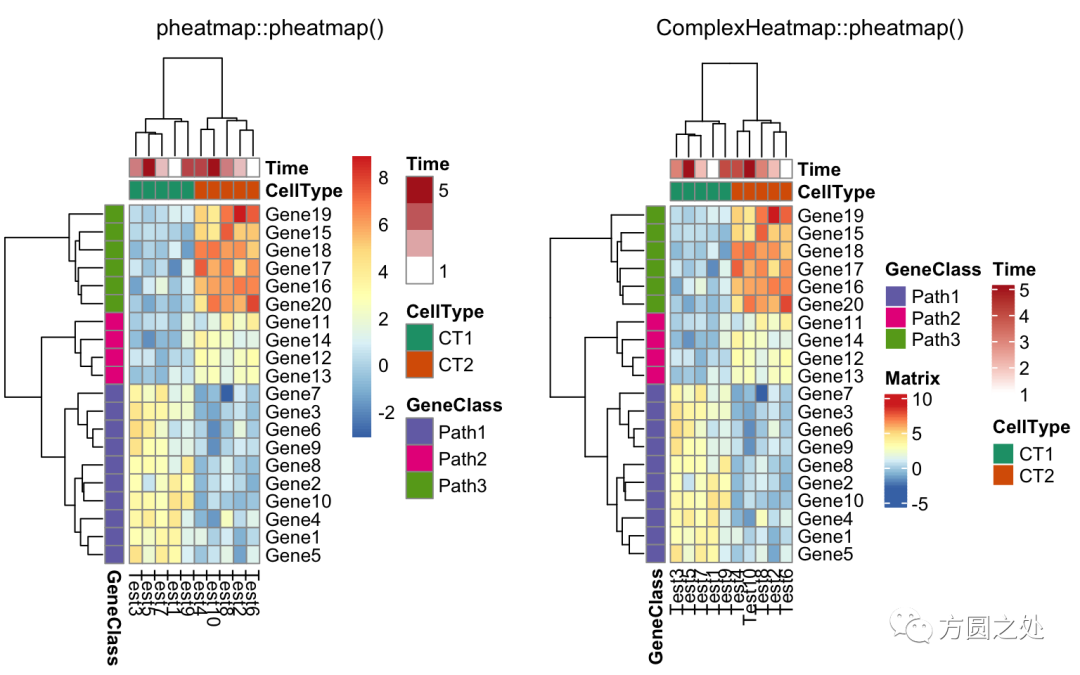
同時(shí)控制行和列annotation的顏色:
compare_pheatmap(test,?
????annotation_col?=?annotation_col,?
???annotation_row?=?annotation_row,?
????annotation_colors?=?ann_colors)
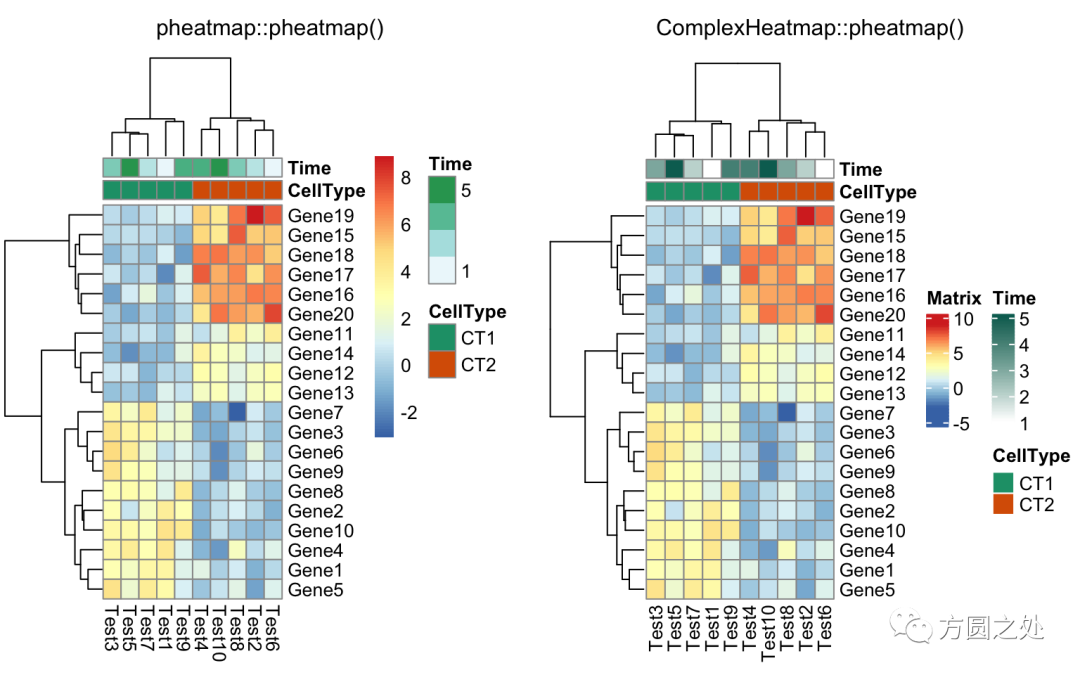
只提供部分annotation的顏色,未提供顏色的annotation使用隨機(jī)顏色:
compare_pheatmap(test,?
????annotation_col?=?annotation_col,?
????annotation_colors?=?ann_colors[2])?
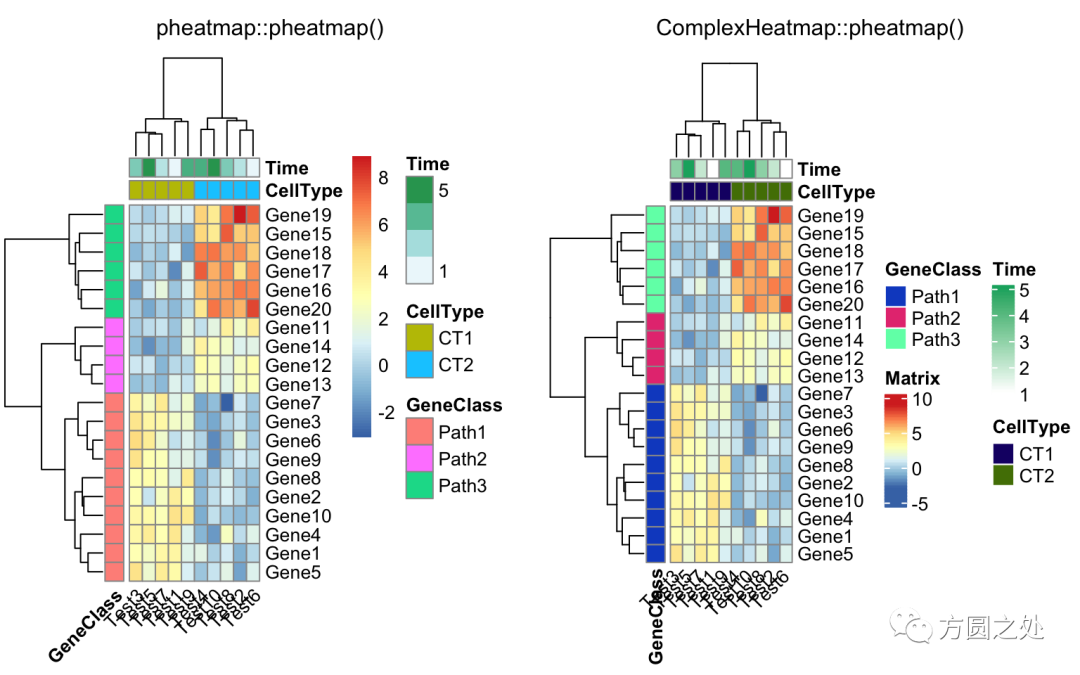
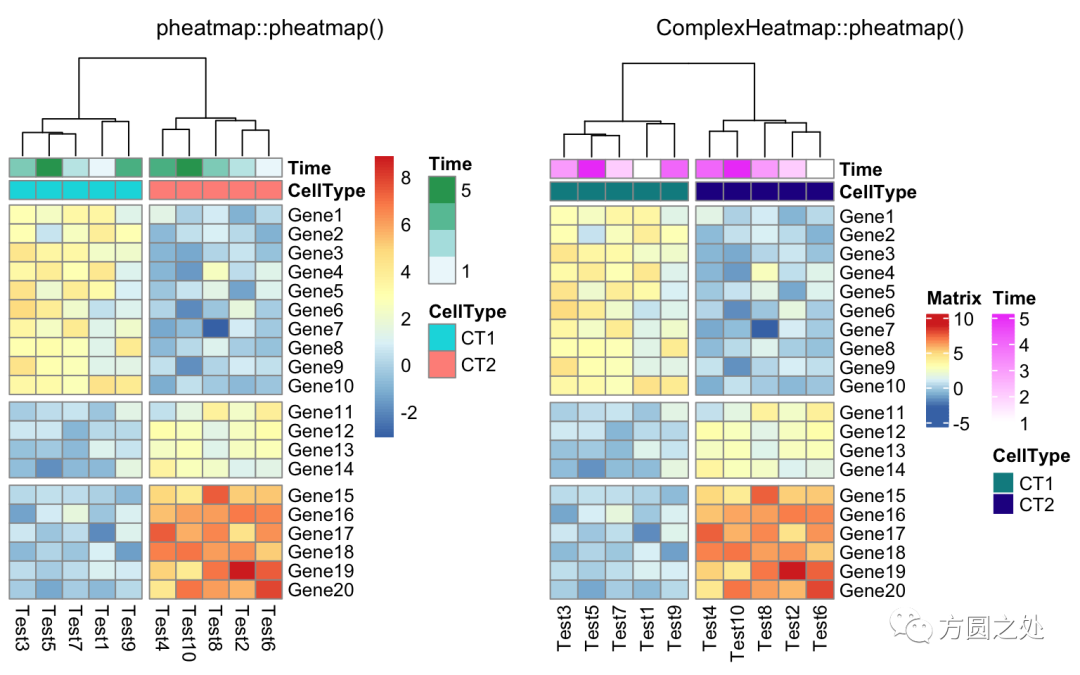
將熱圖分為兩部分,我建議直接使用Heatmap()中的row_split或者row_km參數(shù)。
compare_pheatmap(test,?
????annotation_col?=?annotation_col,?
????cluster_rows?=?FALSE,?
????gaps_row?=?c(10,?14))
使用cutree()對列的dendrogram切分:
compare_pheatmap(test,?
????annotation_col?=?annotation_col,?
????cluster_rows?=?FALSE,?
????gaps_row?=?c(10,?14),?
????cutree_col?=?2)
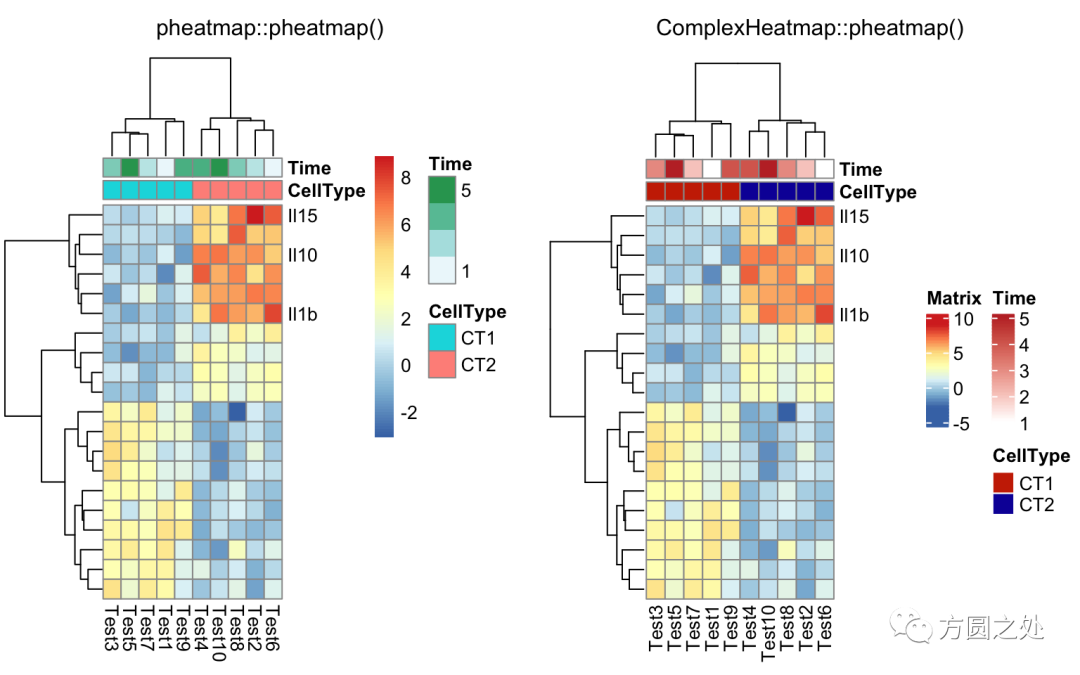
自定義行名:
labels_row?=?c("",?"",?"",?"",?"",?"",?
????"",?"",?"",?"",?"",?"",?"",?"",?"",?
????"",?"",?"Il10",?"Il15",?"Il1b")
compare_pheatmap(test,?
????annotation_col?=?annotation_col,?
????labels_row?=?labels_row)
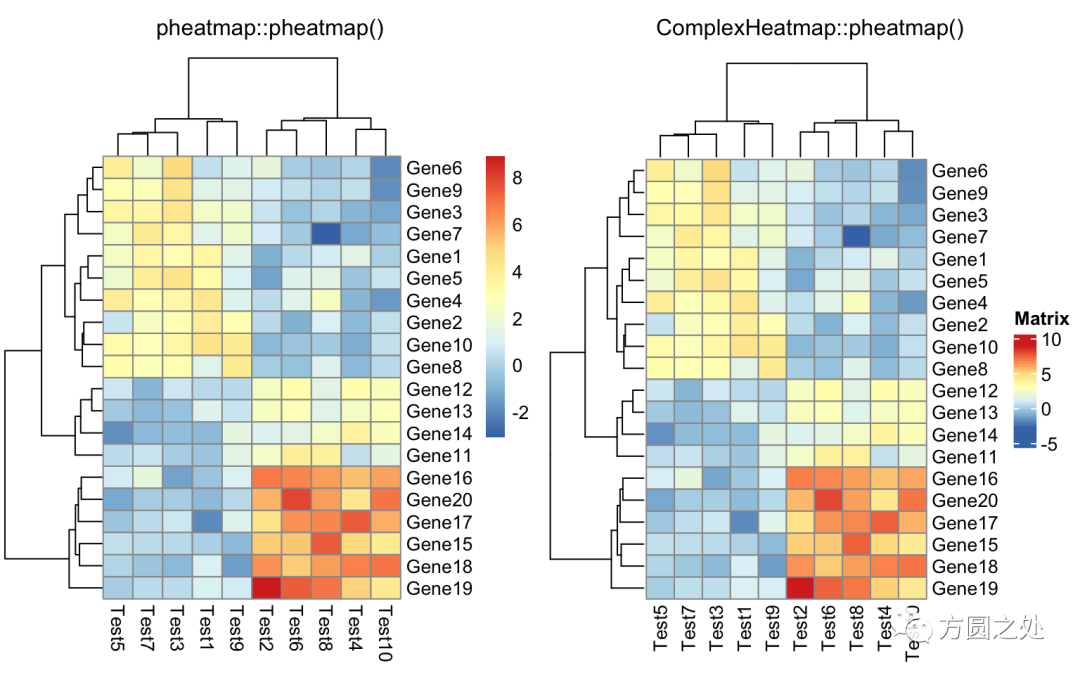
自定義聚類的距離:
drows?=?dist(test,?method?=?"minkowski")
dcols?=?dist(t(test),?method?=?"minkowski")
compare_pheatmap(test,?
????clustering_distance_rows?=?drows,?
????clustering_distance_cols?=?dcols)
對聚類的回調(diào)處理:
library(dendsort)
callback?=?function(hc,?...){dendsort(hc)}
compare_pheatmap(test,?
????clustering_callback?=?callback)
超詳細(xì)的熱圖繪制教程(5000余字),真正的保姆級教程
獲取pheatmap聚類后和標(biāo)準(zhǔn)化后的結(jié)果
往期精品(點(diǎn)擊圖片直達(dá)文字對應(yīng)教程)
|
|
|
|
|
|
|
|
|
|
|
|
|
|
|
|
|
|
|
|
|
|
|
|
|
|
|


后臺回復(fù)“生信寶典福利第一波”或點(diǎn)擊閱讀原文獲取教程合集

?