
用 Python 爬取了《掃黑風(fēng)暴》數(shù)據(jù),并將其可視化分析后,終于知道它為什么這么火了~

大家好,我是安果~
今天來跟大家分享一下從數(shù)據(jù)可視化角度看掃黑風(fēng)暴~
緒論 如何查找視頻id 項(xiàng)目結(jié)構(gòu) 制作詞云圖 制作最近評(píng)論數(shù)條形圖與折線圖 制作每小時(shí)評(píng)論條形圖與折線圖 制作最近評(píng)論數(shù)餅圖 制作每小時(shí)評(píng)論餅圖 制作觀看時(shí)間區(qū)間評(píng)論統(tǒng)計(jì)餅圖 制作掃黑風(fēng)暴主演提及占比餅圖 制作評(píng)論內(nèi)容情感分析圖 評(píng)論的時(shí)間戳轉(zhuǎn)換為正常時(shí)間 評(píng)論內(nèi)容讀入CSV 統(tǒng)計(jì)一天各個(gè)時(shí)間段內(nèi)的評(píng)論數(shù) 統(tǒng)計(jì)最近評(píng)論數(shù) 爬取評(píng)論內(nèi)容 爬取評(píng)論時(shí)間 一.爬蟲部分 二.數(shù)據(jù)處理部分 三. 數(shù)據(jù)分析
緒論
本期是對(duì)騰訊熱播劇——掃黑風(fēng)暴的一次爬蟲與數(shù)據(jù)分析,耗時(shí)兩個(gè)小時(shí),總爬取條數(shù)3W條評(píng)論,總體來說比較普通,值得注意的一點(diǎn)是評(píng)論的情緒文本分析處理,這是第一次接觸的知識(shí)。
爬蟲方面:由于騰訊的評(píng)論數(shù)據(jù)是封裝在json里面,所以只需要找到j(luò)son文件,對(duì)需要的數(shù)據(jù)進(jìn)行提取保存即可。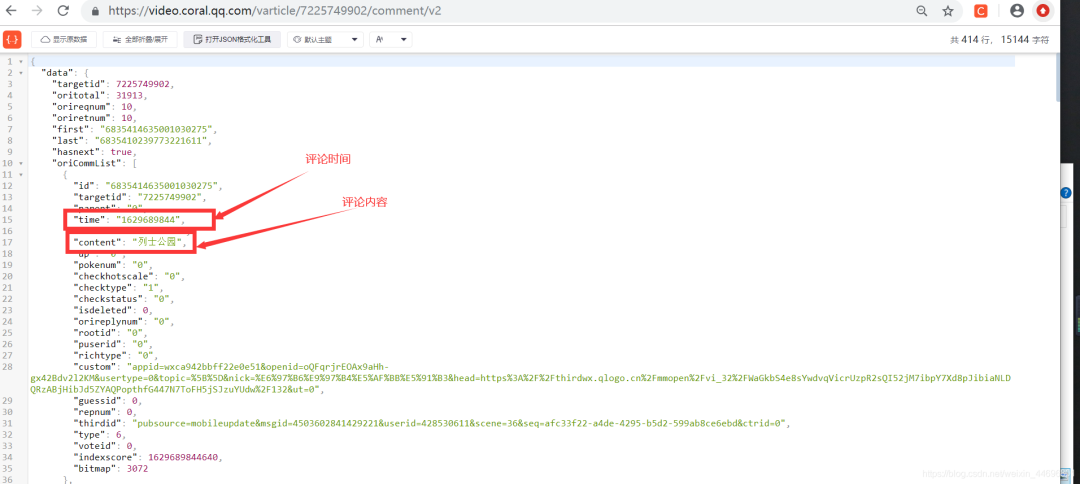
視頻網(wǎng)址:https://v.qq.com/x/cover/mzc00200lxzhhqz.html 評(píng)論json數(shù)據(jù)網(wǎng)址:https://video.coral.qq.com/varticle/7225749902/comment/v2 注:只要替換視頻數(shù)字id的值,即可爬取其他視頻的評(píng)論
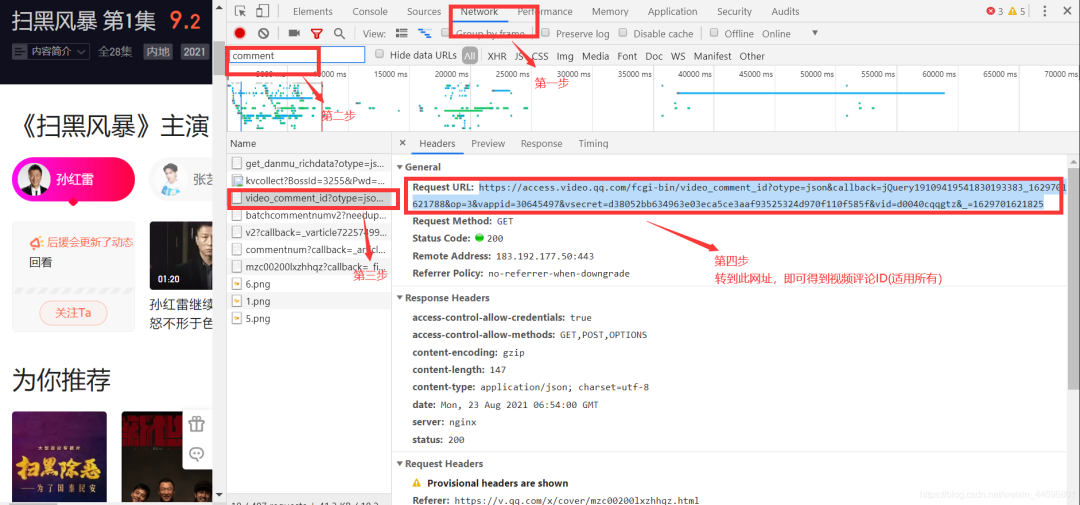
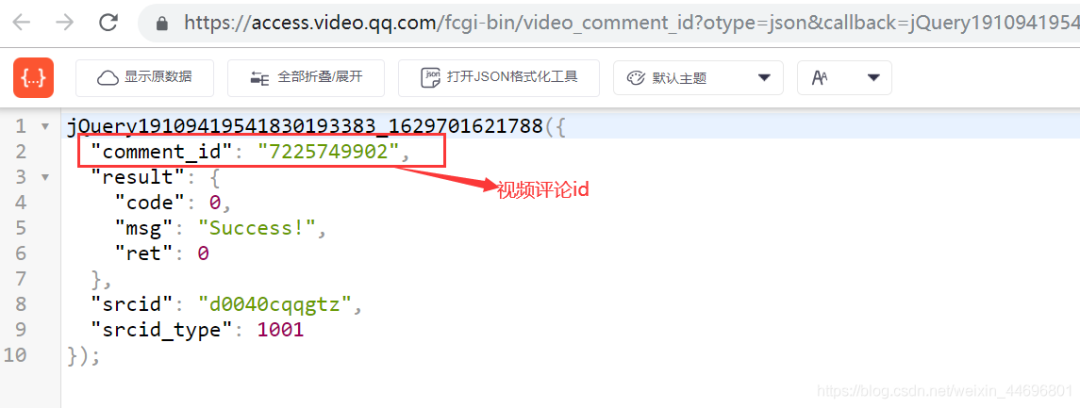
如何查找視頻id?
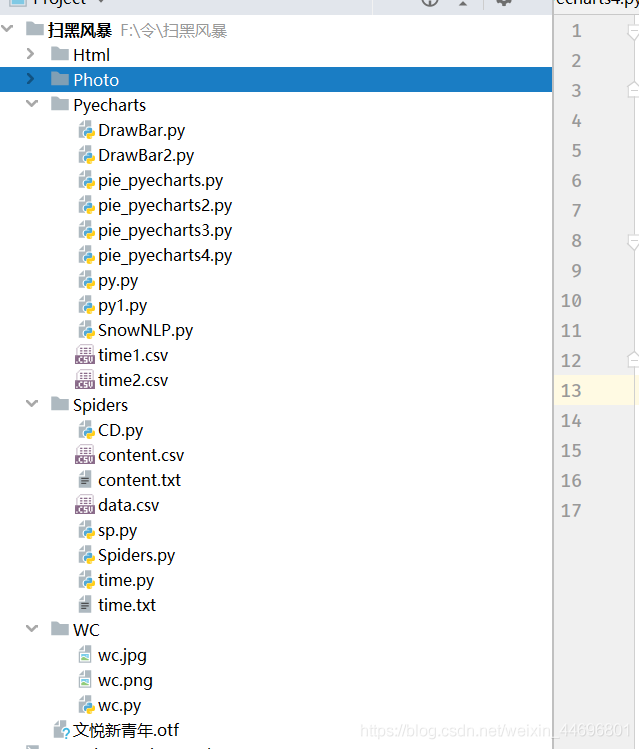
項(xiàng)目結(jié)構(gòu):
一. 爬蟲部分:
1.爬取評(píng)論內(nèi)容代碼:spiders.py
import requests
import re
import random


def get_html(url, params):
    uapools = [
        'Mozilla/5.0 (Macintosh; Intel Mac OS X 10_9_2) AppleWebKit/537.36 (KHTML, like Gecko) Chrome/35.0.1916.153 Safari/537.36',
        'Mozilla/5.0 (Windows NT 6.1; WOW64; rv:30.0) Gecko/20100101 Firefox/30.0',
        'Mozilla/5.0 (Macintosh; Intel Mac OS X 10_9_2) AppleWebKit/537.75.14 (KHTML, like Gecko) Version/7.0.3 Safari/537.75.14'
    ]

    thisua = random.choice(uapools)
    headers = {"User-Agent": thisua}
    r = requests.get(url, headers=headers, params=params)
    r.raise_for_status()
    r.encoding = r.apparent_encoding
    r.encoding = 'utf-8'  # 不加此句出現(xiàn)亂碼
    return r.text


def parse_page(infolist, data):
    commentpat = '"content":"(.*?)"'
    lastpat = '"last":"(.*?)"'

    commentall = re.compile(commentpat, re.S).findall(data)
    next_cid = re.compile(lastpat).findall(data)[0]

    infolist.append(commentall)

    return next_cid


def print_comment_list(infolist):
    j = 0
    for page in infolist:
        print('第' + str(j + 1) + '頁(yè)\n')
        commentall = page
        for i in range(0, len(commentall)):
            print(commentall[i] + '\n')
        j += 1


def save_to_txt(infolist, path):
    fw = open(path, 'w+', encoding='utf-8')
    j = 0
    for page in infolist:
        #fw.write('第' + str(j + 1) + '頁(yè)\n')
        commentall = page
        for i in range(0, len(commentall)):
            fw.write(commentall[i] + '\n')
        j += 1
    fw.close()


def main():
    infolist = []
    vid = '7225749902';
    cid = "0";
    page_num = 3000
    url = 'https://video.coral.qq.com/varticle/' + vid + '/comment/v2'
    #print(url)

    for i in range(page_num):
        params = {'orinum': '10', 'cursor': cid}
        html = get_html(url, params)
        cid = parse_page(infolist, html)


    print_comment_list(infolist)
    save_to_txt(infolist, 'content.txt')


main()
2.爬取評(píng)論時(shí)間代碼:sp.py
import requests
import re
import random


def get_html(url, params):
    uapools = [
        'Mozilla/5.0 (Macintosh; Intel Mac OS X 10_9_2) AppleWebKit/537.36 (KHTML, like Gecko) Chrome/35.0.1916.153 Safari/537.36',
        'Mozilla/5.0 (Windows NT 6.1; WOW64; rv:30.0) Gecko/20100101 Firefox/30.0',
        'Mozilla/5.0 (Macintosh; Intel Mac OS X 10_9_2) AppleWebKit/537.75.14 (KHTML, like Gecko) Version/7.0.3 Safari/537.75.14'
    ]

    thisua = random.choice(uapools)
    headers = {"User-Agent": thisua}
    r = requests.get(url, headers=headers, params=params)
    r.raise_for_status()
    r.encoding = r.apparent_encoding
    r.encoding = 'utf-8'  # 不加此句出現(xiàn)亂碼
    return r.text


def parse_page(infolist, data):
    commentpat = '"time":"(.*?)"'
    lastpat = '"last":"(.*?)"'

    commentall = re.compile(commentpat, re.S).findall(data)
    next_cid = re.compile(lastpat).findall(data)[0]

    infolist.append(commentall)

    return next_cid


def print_comment_list(infolist):
    j = 0
    for page in infolist:
        print('第' + str(j + 1) + '頁(yè)\n')
        commentall = page
        for i in range(0, len(commentall)):
            print(commentall[i] + '\n')
        j += 1


def save_to_txt(infolist, path):
    fw = open(path, 'w+', encoding='utf-8')
    j = 0
    for page in infolist:
        #fw.write('第' + str(j + 1) + '頁(yè)\n')
        commentall = page
        for i in range(0, len(commentall)):
            fw.write(commentall[i] + '\n')
        j += 1
    fw.close()


def main():
    infolist = []
    vid = '7225749902';
    cid = "0";
    page_num =3000
    url = 'https://video.coral.qq.com/varticle/' + vid + '/comment/v2'
    #print(url)

    for i in range(page_num):
        params = {'orinum': '10', 'cursor': cid}
        html = get_html(url, params)
        cid = parse_page(infolist, html)


    print_comment_list(infolist)
    save_to_txt(infolist, 'time.txt')


main()
二.數(shù)據(jù)處理部分
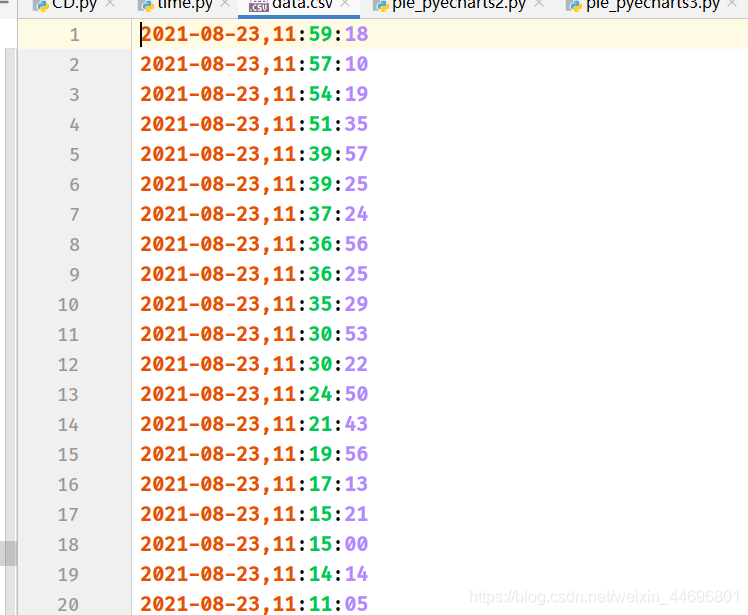
1.評(píng)論的時(shí)間戳轉(zhuǎn)換為正常時(shí)間 time.py
# coding=gbk
import csv
import time

csvFile = open("data.csv",'w',newline='',encoding='utf-8')
writer = csv.writer(csvFile)
csvRow = []
#print(csvRow)
f = open("time.txt",'r',encoding='utf-8')
for line in f:
    csvRow = int(line)
    #print(csvRow)

    timeArray = time.localtime(csvRow)
    csvRow = time.strftime("%Y-%m-%d %H:%M:%S", timeArray)
    print(csvRow)
    csvRow = csvRow.split()
    writer.writerow(csvRow)

f.close()
csvFile.close()
2.評(píng)論內(nèi)容讀入csv CD.py
# coding=gbk
import csv
csvFile = open("content.csv",'w',newline='',encoding='utf-8')
writer = csv.writer(csvFile)
csvRow = []

f = open("content.txt",'r',encoding='utf-8')
for line in f:
    csvRow = line.split()
    writer.writerow(csvRow)

f.close()
csvFile.close()
3.統(tǒng)計(jì)一天各個(gè)時(shí)間段內(nèi)的評(píng)論數(shù) py.py
# coding=gbk
import csv

from pyecharts import options as opts
from sympy.combinatorics import Subset
from wordcloud import WordCloud

with open('../Spiders/data.csv') as csvfile:
    reader = csv.reader(csvfile)

    data1 = [str(row[1])[0:2] for row in reader]

    print(data1)
print(type(data1))


#先變成集合得到seq中的所有元素,避免重復(fù)遍歷
set_seq = set(data1)
rst = []
for item in set_seq:
    rst.append((item,data1.count(item)))  #添加元素及出現(xiàn)個(gè)數(shù)
rst.sort()
print(type(rst))
print(rst)

with open("time2.csv", "w+", newline='', encoding='utf-8') as f:
    writer = csv.writer(f, delimiter=',')
    for i in rst:                # 對(duì)于每一行的,將這一行的每個(gè)元素分別寫在對(duì)應(yīng)的列中
        writer.writerow(i)

with open('time2.csv') as csvfile:
     reader = csv.reader(csvfile)
     x = [str(row[0]) for row in reader]
     print(x)
with open('time2.csv') as csvfile:
    reader = csv.reader(csvfile)
    y1 = [float(row[1]) for row in reader]
    print(y1)
處理結(jié)果(評(píng)論時(shí)間,評(píng)論數(shù))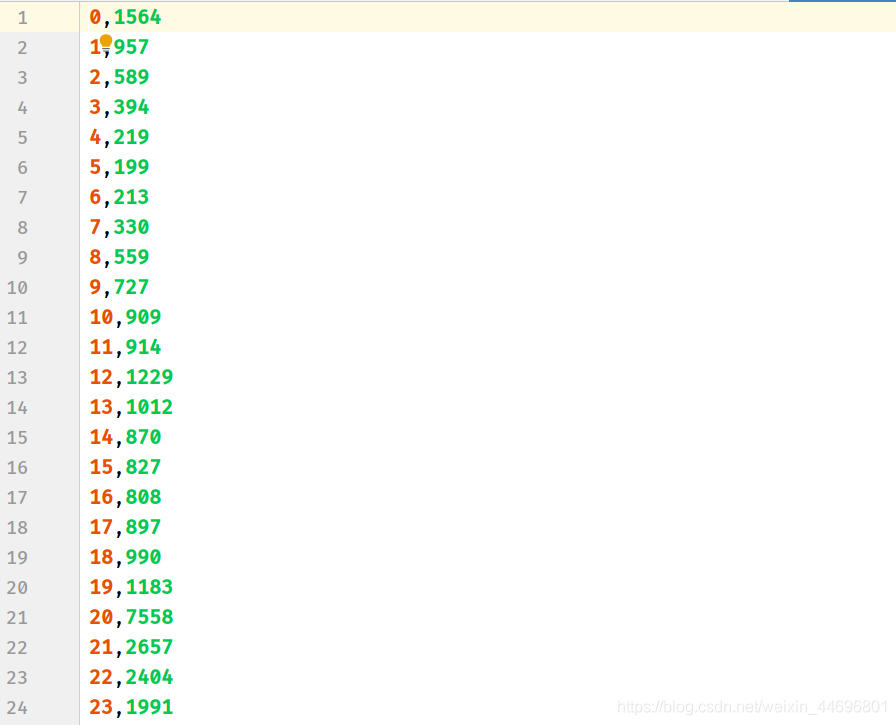
4.統(tǒng)計(jì)最近評(píng)論數(shù) py1.py
# coding=gbk
import csv

from pyecharts import options as opts
from sympy.combinatorics import Subset
from wordcloud import WordCloud

with open('../Spiders/data.csv') as csvfile:
    reader = csv.reader(csvfile)

    data1 = [str(row[0]) for row in reader]
    #print(data1)
print(type(data1))


#先變成集合得到seq中的所有元素,避免重復(fù)遍歷
set_seq = set(data1)
rst = []
for item in set_seq:
    rst.append((item,data1.count(item)))  #添加元素及出現(xiàn)個(gè)數(shù)
rst.sort()
print(type(rst))
print(rst)


with open("time1.csv", "w+", newline='', encoding='utf-8') as f:
    writer = csv.writer(f, delimiter=',')
    for i in rst:                # 對(duì)于每一行的,將這一行的每個(gè)元素分別寫在對(duì)應(yīng)的列中
        writer.writerow(i)

with open('time1.csv') as csvfile:
     reader = csv.reader(csvfile)
     x = [str(row[0]) for row in reader]
     print(x)
with open('time1.csv') as csvfile:
    reader = csv.reader(csvfile)
    y1 = [float(row[1]) for row in reader]

    print(y1)
處理結(jié)果(評(píng)論時(shí)間,評(píng)論數(shù))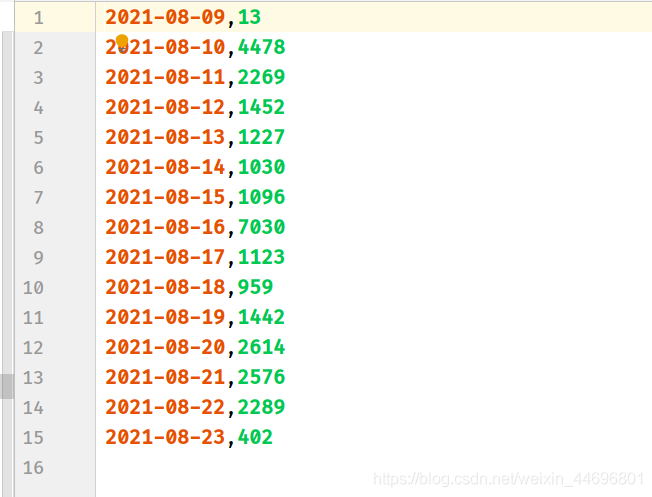
三. 數(shù)據(jù)分析
數(shù)據(jù)分析方面:涉及到了詞云圖,條形,折線,餅圖,后三者是對(duì)評(píng)論時(shí)間與主演占比的分析,然而騰訊的評(píng)論時(shí)間是以時(shí)間戳的形式顯示,所以要進(jìn)行轉(zhuǎn)換,再去統(tǒng)計(jì)出現(xiàn)次數(shù),最后,新加了對(duì)評(píng)論內(nèi)容的情感分析。
1.制作詞云圖
wc.py
import numpy as np
import re
import jieba
from wordcloud import WordCloud
from matplotlib import pyplot as plt
from PIL import Image

# 上面的包自己安裝,不會(huì)的就百度

f = open('../Spiders/content.txt', 'r', encoding='utf-8')  # 這是數(shù)據(jù)源,也就是想生成詞云的數(shù)據(jù)
txt = f.read()  # 讀取文件
f.close()  # 關(guān)閉文件,其實(shí)用with就好,但是懶得改了
# 如果是文章的話,需要用到j(luò)ieba分詞,分完之后也可以自己處理下再生成詞云
newtxt = re.sub("[A-Za-z0-9\!\%\[\]\,\。]", "", txt)
print(newtxt)
words = jieba.lcut(newtxt)

img = Image.open(r'wc.jpg')  # 想要搞得形狀
img_array = np.array(img)

# 相關(guān)配置,里面這個(gè)collocations配置可以避免重復(fù)
wordcloud = WordCloud(
    background_color="white",
    width=1080,
    height=960,
    font_path="../文悅新青年.otf",
    max_words=150,
    scale=10,#清晰度
    max_font_size=100,
    mask=img_array,
    collocations=False).generate(newtxt)

plt.imshow(wordcloud)
plt.axis('off')
plt.show()
wordcloud.to_file('wc.png')
輪廓圖:wc.jpg

詞云圖:result.png (注:這里要把英文字母過濾掉)

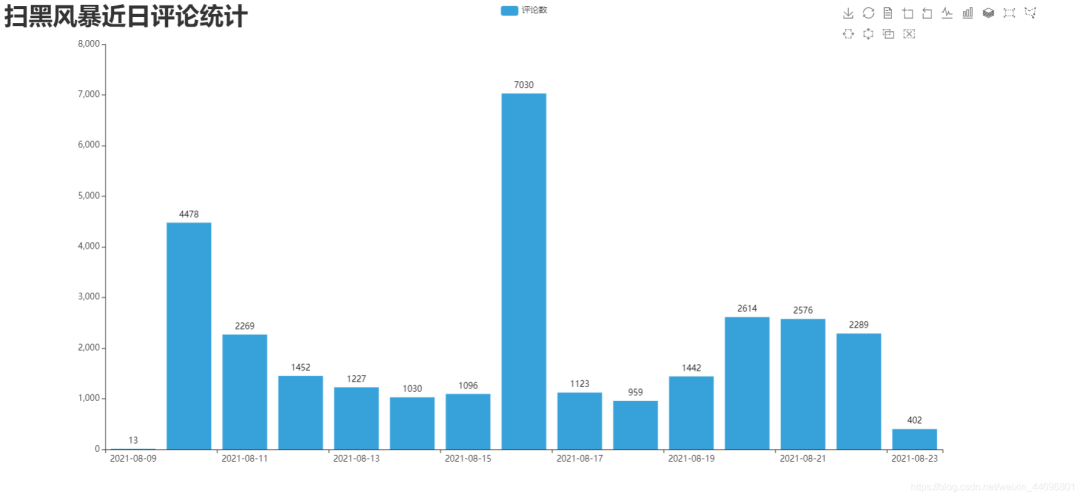
2.制作最近評(píng)論數(shù)條形圖與折線圖 DrawBar.py
# encoding: utf-8
import csv
import pyecharts.options as opts
from pyecharts.charts import Bar
from pyecharts.globals import ThemeType
class DrawBar(object):
"""繪制柱形圖類"""
def __init__(self):
"""創(chuàng)建柱狀圖實(shí)例,并設(shè)置寬高和風(fēng)格"""
self.bar = Bar(init_opts=opts.InitOpts(width='1500px', height='700px', theme=ThemeType.LIGHT))
def add_x(self):
"""為圖形添加X軸數(shù)據(jù)"""
with open('time1.csv') as csvfile:
reader = csv.reader(csvfile)
x = [str(row[0]) for row in reader]
print(x)
self.bar.add_xaxis(
xaxis_data=x,
)
def add_y(self):
with open('time1.csv') as csvfile:
reader = csv.reader(csvfile)
y1 = [float(row[1]) for row in reader]
print(y1)
"""為圖形添加Y軸數(shù)據(jù),可添加多條"""
self.bar.add_yaxis( # 第一個(gè)Y軸數(shù)據(jù)
series_name="評(píng)論數(shù)", # Y軸數(shù)據(jù)名稱
y_axis=y1, # Y軸數(shù)據(jù)
label_opts=opts.LabelOpts(is_show=True,color="black"), # 設(shè)置標(biāo)簽
bar_max_width='100px', # 設(shè)置柱子最大寬度
)
def set_global(self):
"""設(shè)置圖形的全局屬性"""
#self.bar(width=2000,height=1000)
self.bar.set_global_opts(
title_opts=opts.TitleOpts( # 設(shè)置標(biāo)題
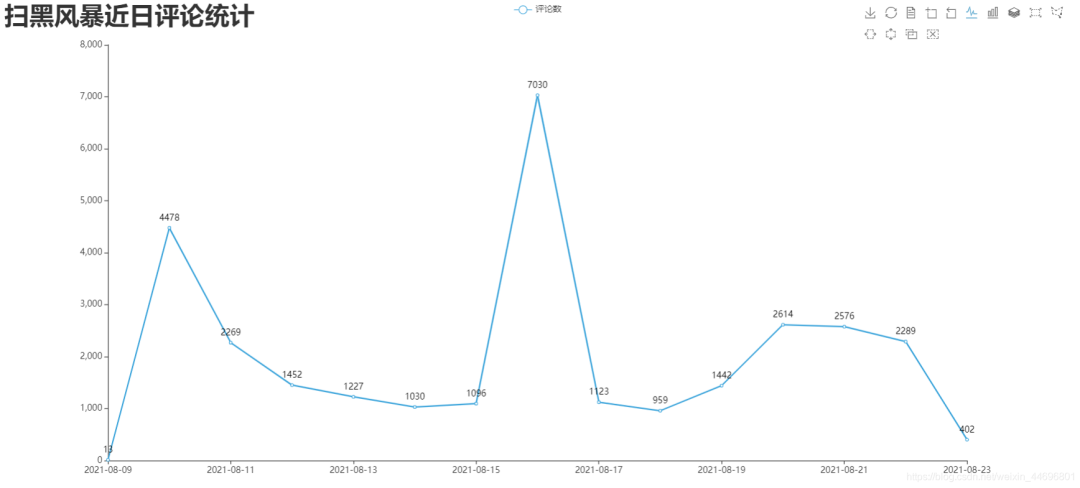
title='掃黑風(fēng)暴近日評(píng)論統(tǒng)計(jì)',title_textstyle_opts=opts.TextStyleOpts(font_size=35)
),
tooltip_opts=opts.TooltipOpts( # 提示框配置項(xiàng)(鼠標(biāo)移到圖形上時(shí)顯示的東西)
is_show=True, # 是否顯示提示框
trigger="axis", # 觸發(fā)類型(axis坐標(biāo)軸觸發(fā),鼠標(biāo)移到時(shí)會(huì)有一條垂直于X軸的實(shí)線跟隨鼠標(biāo)移動(dòng),并顯示提示信息)
axis_pointer_type="cross" # 指示器類型(cross將會(huì)生成兩條分別垂直于X軸和Y軸的虛線,不啟用trigger才會(huì)顯示完全)
),
toolbox_opts=opts.ToolboxOpts(), # 工具箱配置項(xiàng)(什么都不填默認(rèn)開啟所有工具)
)
def draw(self):
"""繪制圖形"""
self.add_x()
self.add_y()
self.set_global()
self.bar.render('../Html/DrawBar.html') # 將圖繪制到 test.html 文件內(nèi),可在瀏覽器打開
def run(self):
"""執(zhí)行函數(shù)"""
self.draw()
if __name__ == '__main__':
app = DrawBar()
app.run()效果圖:DrawBar.html
3.制作每小時(shí)評(píng)論條形圖與折線圖 DrawBar2.py
# encoding: utf-8
# encoding: utf-8
import csv
import pyecharts.options as opts
from pyecharts.charts import Bar
from pyecharts.globals import ThemeType
class DrawBar(object):
"""繪制柱形圖類"""
def __init__(self):
"""創(chuàng)建柱狀圖實(shí)例,并設(shè)置寬高和風(fēng)格"""
self.bar = Bar(init_opts=opts.InitOpts(width='1500px', height='700px', theme=ThemeType.MACARONS))
def add_x(self):
"""為圖形添加X軸數(shù)據(jù)"""
str_name1 = '點(diǎn)'
with open('time2.csv') as csvfile:
reader = csv.reader(csvfile)
x = [str(row[0] + str_name1) for row in reader]
print(x)
self.bar.add_xaxis(
xaxis_data=x
)
def add_y(self):
with open('time2.csv') as csvfile:
reader = csv.reader(csvfile)
y1 = [int(row[1]) for row in reader]
print(y1)
"""為圖形添加Y軸數(shù)據(jù),可添加多條"""
self.bar.add_yaxis( # 第一個(gè)Y軸數(shù)據(jù)
series_name="評(píng)論數(shù)", # Y軸數(shù)據(jù)名稱
y_axis=y1, # Y軸數(shù)據(jù)
label_opts=opts.LabelOpts(is_show=False), # 設(shè)置標(biāo)簽
bar_max_width='50px', # 設(shè)置柱子最大寬度
)
def set_global(self):
"""設(shè)置圖形的全局屬性"""
#self.bar(width=2000,height=1000)
self.bar.set_global_opts(
title_opts=opts.TitleOpts( # 設(shè)置標(biāo)題
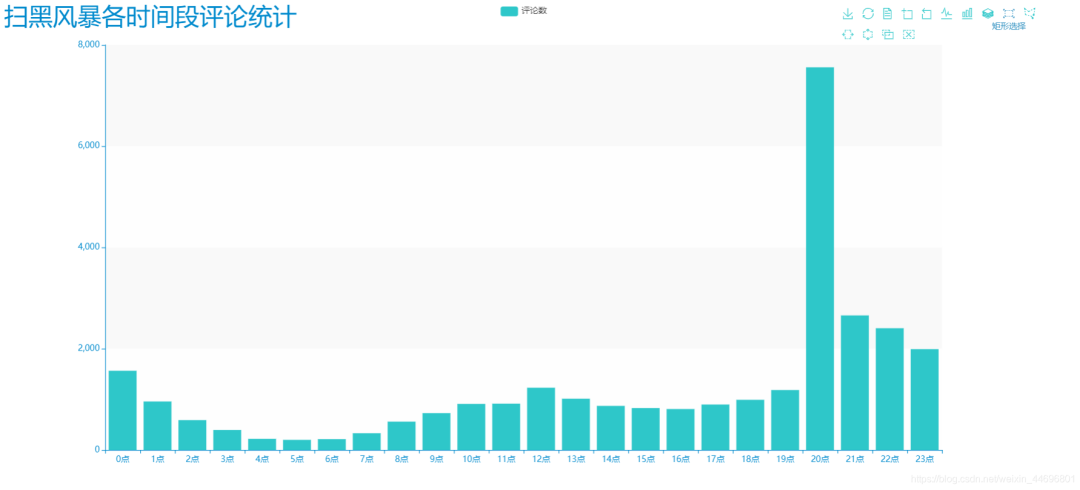
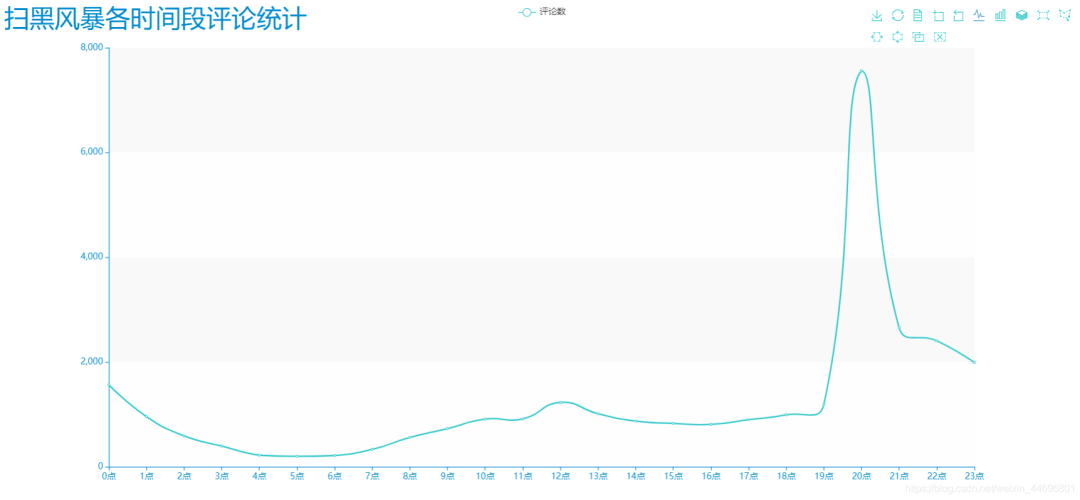
title='掃黑風(fēng)暴各時(shí)間段評(píng)論統(tǒng)計(jì)',title_textstyle_opts=opts.TextStyleOpts(font_size=35)
),
tooltip_opts=opts.TooltipOpts( # 提示框配置項(xiàng)(鼠標(biāo)移到圖形上時(shí)顯示的東西)
is_show=True, # 是否顯示提示框
trigger="axis", # 觸發(fā)類型(axis坐標(biāo)軸觸發(fā),鼠標(biāo)移到時(shí)會(huì)有一條垂直于X軸的實(shí)線跟隨鼠標(biāo)移動(dòng),并顯示提示信息)
axis_pointer_type="cross" # 指示器類型(cross將會(huì)生成兩條分別垂直于X軸和Y軸的虛線,不啟用trigger才會(huì)顯示完全)
),
toolbox_opts=opts.ToolboxOpts(), # 工具箱配置項(xiàng)(什么都不填默認(rèn)開啟所有工具)
)
def draw(self):
"""繪制圖形"""
self.add_x()
self.add_y()
self.set_global()
self.bar.render('../Html/DrawBar2.html') # 將圖繪制到 test.html 文件內(nèi),可在瀏覽器打開
def run(self):
"""執(zhí)行函數(shù)"""
self.draw()
if __name__ == '__main__':
app = DrawBar()
app.run()
效果圖:DrawBar2.html
4.制作最近評(píng)論數(shù)餅圖 pie_pyecharts.py
import csv
from pyecharts import options as opts
from pyecharts.charts import Pie
from random import randint
from pyecharts.globals import ThemeType
with open('time1.csv') as csvfile:
reader = csv.reader(csvfile)
x = [str(row[0]) for row in reader]
print(x)
with open('time1.csv') as csvfile:
reader = csv.reader(csvfile)
y1 = [float(row[1]) for row in reader]
print(y1)
num = y1
lab = x
(
Pie(init_opts=opts.InitOpts(width='1700px',height='450px',theme=ThemeType.LIGHT))#默認(rèn)900,600
.set_global_opts(
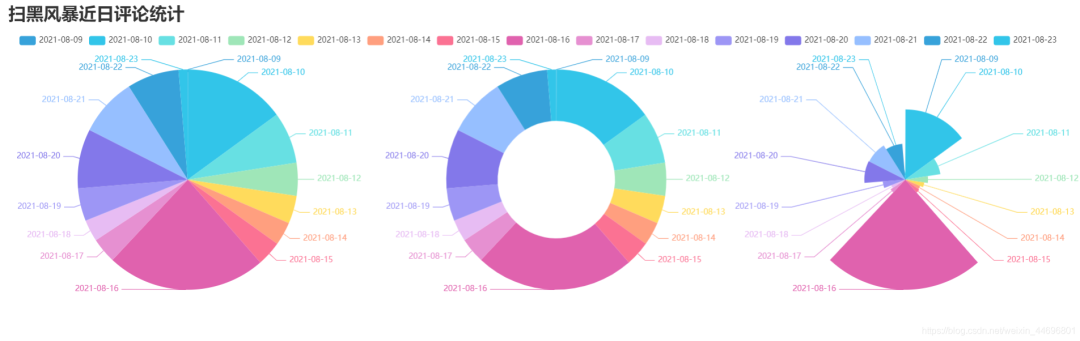
title_opts=opts.TitleOpts(title="掃黑風(fēng)暴近日評(píng)論統(tǒng)計(jì)",
title_textstyle_opts=opts.TextStyleOpts(font_size=27)),legend_opts=opts.LegendOpts(
pos_top="10%", pos_left="1%",# 圖例位置調(diào)整
),)
.add(series_name='',center=[280, 270], data_pair=[(j, i) for i, j in zip(num, lab)])#餅圖
.add(series_name='',center=[845, 270],data_pair=[(j,i) for i,j in zip(num,lab)],radius=['40%','75%'])#環(huán)圖
.add(series_name='', center=[1380, 270],data_pair=[(j, i) for i, j in zip(num, lab)], rosetype='radius')#南丁格爾圖
).render('../Html/pie_pyecharts.html')
效果圖
5.制作每小時(shí)評(píng)論餅圖 pie_pyecharts2.py
import csv

from pyecharts import options as opts
from pyecharts.charts import Pie
from random import randint

from pyecharts.globals import ThemeType

str_name1 = '點(diǎn)'

with open('time2.csv') as csvfile:
    reader = csv.reader(csvfile)
    x = [str(row[0]+str_name1) for row in reader]
    print(x)
with open('time2.csv') as csvfile:
    reader = csv.reader(csvfile)
    y1 = [int(row[1]) for row in reader]

    print(y1)


num = y1
lab = x
(
    Pie(init_opts=opts.InitOpts(width='1650px',height='500px',theme=ThemeType.LIGHT,))#默認(rèn)900,600
     .set_global_opts(
        title_opts=opts.TitleOpts(title="掃黑風(fēng)暴每小時(shí)評(píng)論統(tǒng)計(jì)"
                                  ,title_textstyle_opts=opts.TextStyleOpts(font_size=27)),
        legend_opts=opts.LegendOpts(

            pos_top="8%", pos_left="4%",# 圖例位置調(diào)整
            ),
    )
    .add(series_name='',center=[250, 300], data_pair=[(j, i) for i, j in zip(num, lab)])#餅圖
    .add(series_name='',center=[810, 300],data_pair=[(j,i) for i,j in zip(num,lab)],radius=['40%','75%'])#環(huán)圖
    .add(series_name='', center=[1350, 300],data_pair=[(j, i) for i, j in zip(num, lab)], rosetype='radius')#南丁格爾圖
).render('../Html/pie_pyecharts2.html')
效果圖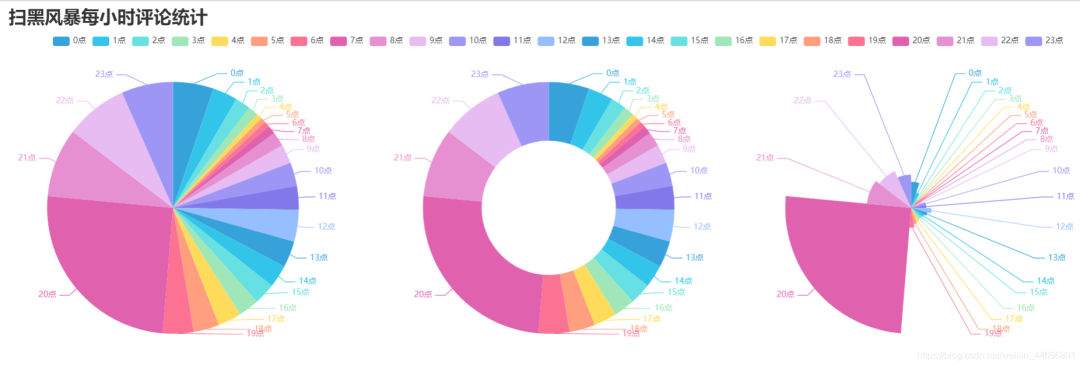
6.制作觀看時(shí)間區(qū)間評(píng)論統(tǒng)計(jì)餅圖 pie_pyecharts3.py
# coding=gbk
import csv

from pyecharts import options as opts
from pyecharts.globals import ThemeType
from sympy.combinatorics import Subset
from wordcloud import WordCloud

with open('../Spiders/data.csv') as csvfile:
    reader = csv.reader(csvfile)

    data2 = [int(row[1].strip('')[0:2]) for row in reader]


    #print(data2)
print(type(data2))

#先變成集合得到seq中的所有元素,避免重復(fù)遍歷
set_seq = set(data2)
list = []
for item in set_seq:
    list.append((item,data2.count(item)))  #添加元素及出現(xiàn)個(gè)數(shù)
list.sort()
print(type(list))
#print(list)


with open("time2.csv", "w+", newline='', encoding='utf-8') as f:
    writer = csv.writer(f, delimiter=',')
    for i in list:                # 對(duì)于每一行的,將這一行的每個(gè)元素分別寫在對(duì)應(yīng)的列中
        writer.writerow(i)


n = 4 #分成n組
m = int(len(list)/n)
list2 = []
for i in range(0, len(list), m):
    list2.append(list[i:i+m])

print("凌晨 : ",list2[0])
print("上午 : ",list2[1])
print("下午 : ",list2[2])
print("晚上 : ",list2[3])

with open('time2.csv') as csvfile:
    reader = csv.reader(csvfile)
    y1 = [int(row[1]) for row in reader]

    print(y1)

n =6
groups = [y1[i:i + n] for i in range(0, len(y1), n)]

print(groups)

x=['凌晨','上午','下午','晚上']
y1=[]
for y1 in groups:
    num_sum = 0
    for groups in y1:
        num_sum += groups

print(x)
print(y1)


import csv

from pyecharts import options as opts
from pyecharts.charts import Pie
from random import randint

str_name1 = '點(diǎn)'

num = y1
lab = x
(
    Pie(init_opts=opts.InitOpts(width='1500px',height='450px',theme=ThemeType.LIGHT))#默認(rèn)900,600
        .set_global_opts(
        title_opts=opts.TitleOpts(title="掃黑風(fēng)暴觀看時(shí)間區(qū)間評(píng)論統(tǒng)計(jì)"
                                  , title_textstyle_opts=opts.TextStyleOpts(font_size=30)),
        legend_opts=opts.LegendOpts(

            pos_top="8%",  # 圖例位置調(diào)整
        ),
    )
    .add(series_name='',center=[260, 270], data_pair=[(j, i) for i, j in zip(num, lab)])#餅圖
   .add(series_name='',center=[1230, 270],data_pair=[(j,i) for i,j in zip(num,lab)],radius=['40%','75%'])#環(huán)圖
    .add(series_name='', center=[750, 270],data_pair=[(j, i) for i, j in zip(num, lab)], rosetype='radius')#南丁格爾圖
).render('../Html/pie_pyecharts3.html')
效果圖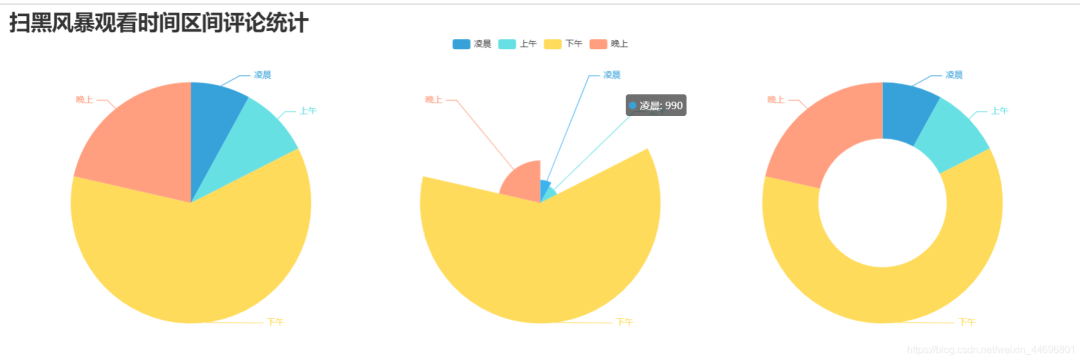
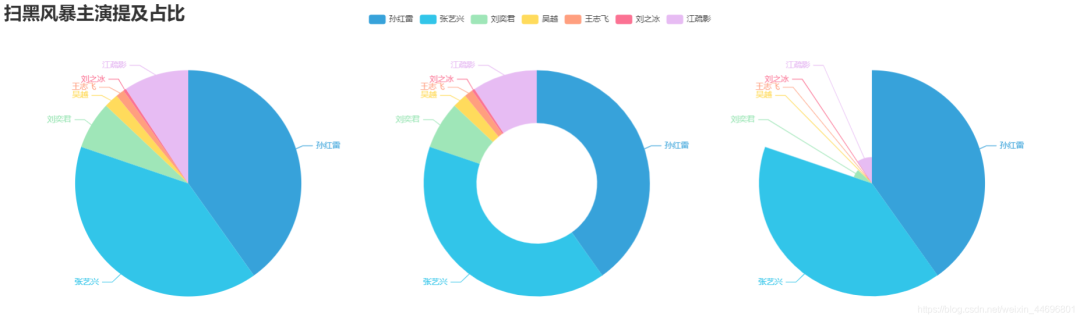
7.制作掃黑風(fēng)暴主演提及占比餅圖 pie_pyecharts4.py
import csv

import numpy as np
import re
import jieba
from matplotlib.pyplot import scatter
from wordcloud import WordCloud
from matplotlib import pyplot as plt
from PIL import Image

# 上面的包自己安裝,不會(huì)的就百度

f = open('../Spiders/content.txt', 'r', encoding='utf-8')  # 這是數(shù)據(jù)源,也就是想生成詞云的數(shù)據(jù)
words = f.read()  # 讀取文件
f.close()  # 關(guān)閉文件,其實(shí)用with就好,但是懶得改了

name=["孫紅雷","張藝興","劉奕君","吳越","王志飛","劉之冰","江疏影"]

print(name)
count=[float(words.count("孫紅雷")),
      float(words.count("藝興")),
      float(words.count("劉奕君")),
      float(words.count("吳越")),
      float(words.count("王志飛")),
      float(words.count("劉之冰")),
      float(words.count("江疏影"))]
print(count)

import csv

from pyecharts import options as opts
from pyecharts.charts import Pie
from random import randint

from pyecharts.globals import ThemeType

num = count
lab = name
(
    Pie(init_opts=opts.InitOpts(width='1650px',height='450px',theme=ThemeType.LIGHT))#默認(rèn)900,600
    .set_global_opts(
        title_opts=opts.TitleOpts(title="掃黑風(fēng)暴主演提及占比",
                                               title_textstyle_opts=opts.TextStyleOpts(font_size=27)),legend_opts=opts.LegendOpts(

            pos_top="3%", pos_left="33%",# 圖例位置調(diào)整
            ),)
    .add(series_name='',center=[280, 270], data_pair=[(j, i) for i, j in zip(num, lab)])#餅圖
   .add(series_name='',center=[800, 270],data_pair=[(j,i) for i,j in zip(num,lab)],radius=['40%','75%'])#環(huán)圖
    .add(series_name='', center=[1300, 270],data_pair=[(j, i) for i, j in zip(num, lab)], rosetype='radius')#南丁格爾圖
).render('../Html/pie_pyecharts4.html')
效果圖
8.評(píng)論內(nèi)容情感分析 SnowNLP.py
import numpy as np
from snownlp import SnowNLP
import matplotlib.pyplot as plt

f = open('../Spiders/content.txt', 'r', encoding='UTF-8')
list = f.readlines()
sentimentslist = []
for i in list:
    s = SnowNLP(i)

    print(s.sentiments)
    sentimentslist.append(s.sentiments)
plt.hist(sentimentslist, bins=np.arange(0, 1, 0.01), facecolor='g')
plt.xlabel('Sentiments Probability')
plt.ylabel('Quantity')
plt.title('Analysis of Sentiments')
plt.show()
效果圖(情感各分?jǐn)?shù)段出現(xiàn)頻率)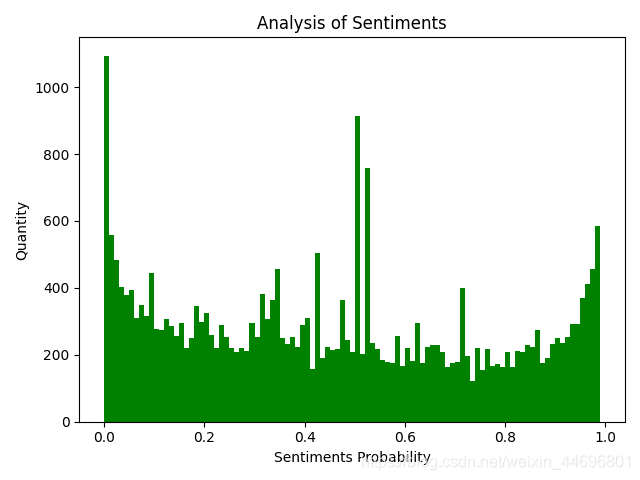 SnowNLP情感分析是基于情感詞典實(shí)現(xiàn)的,其簡(jiǎn)單的將文本分為兩類,積極和消極,返回值為情緒的概率,也就是情感評(píng)分在[0,1]之間,越接近1,情感表現(xiàn)越積極,越接近0,情感表現(xiàn)越消極。