
【Python基礎(chǔ)】使用統(tǒng)計函數(shù)繪制簡單圖形
@公眾號原創(chuàng)專欄作者 馮夏沖
學(xué)校 |?哈工大SCIR實驗室在讀博士生
# -*- coding:utf-8 -*-import matplotlib as mplimport matplotlib.pyplot as pltimport numpy as np%matplotlib inline%config InlineBackend.figure_format = 'svg'# https://blog.csdn.net/minixuezhen/article/details/81516949plt.rcParams['font.sans-serif'] = ['Arial Unicode MS']mpl.rcParams["axes.unicode_minus"]=False
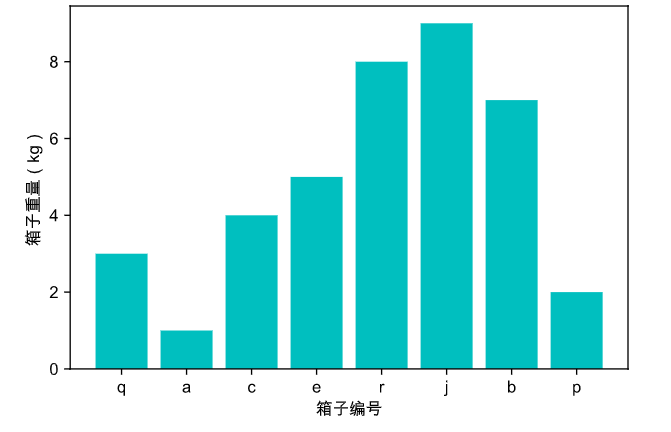
2.1 函數(shù)bar 用于繪制柱狀圖
# some simple datax = [1,2,3,4,5,6,7,8]y = [3,1,4,5,8,9,7,2]# create barplt.bar(x,y,align='center',color="c",tick_label=["q","a","c","e","r","j","b","p"])# labelplt.xlabel("箱子編號")plt.ylabel("箱子重量(kg)")plt.show()
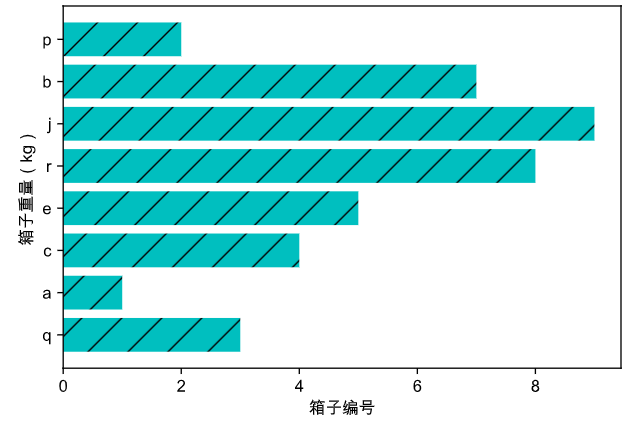
2.2 函數(shù)barh 用于繪制條形圖
# some simple datax = [1,2,3,4,5,6,7,8]y = [3,1,4,5,8,9,7,2]# create barplt.barh(x,y,align='center',color="c",tick_label=["q","a","c","e","r","j","b","p"],hatch="/")# labelplt.xlabel("箱子編號")plt.ylabel("箱子重量(kg)")plt.show()
2.3 函數(shù)hist 用于繪制直方圖
直方圖與柱狀圖的區(qū)別
# set test scoresboxWeight = np.random.randint(0,10,100)x = boxWeight # 對該數(shù)據(jù)集進行統(tǒng)計# plot histogrambins = range(0,11,1) # 設(shè)置連續(xù)的邊界值,即直方圖的分布區(qū)間[0,1],[1,2]......plt.hist(x, bins=bins, histtype="bar", rwidth=1, alpha=0.6)# labelplt.xlabel("箱子重量(kg)")plt.ylabel("銷售數(shù)量(個)")plt.show()

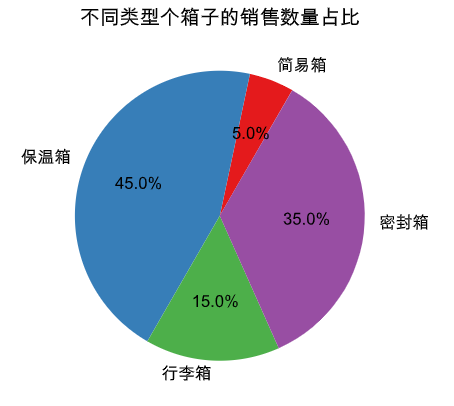
函數(shù)pie 用于繪制餅圖
kinds = "簡易箱","保溫箱","行李箱","密封箱"colors = "#e41a1c", "#377eb8", "#4daf4a", "#984ea3"soldsNums = [0.05,0.45,0.15,0.35]# pie chartplt.pie(soldsNums,labels=kinds,autopct="%3.1f%%", startangle=60, colors=colors)plt.title("不同類型個箱子的銷售數(shù)量占比")plt.show()
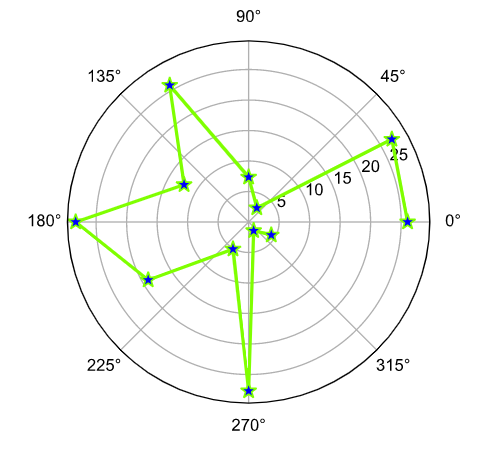
2.5 函數(shù)polor 用于繪制極線圖
極線圖是在極坐標(biāo)系上繪出的一種圖。在極坐標(biāo)系中,要確定一個點,需要指明這個點距原點的角度和半徑。將這些點連在一起,就構(gòu)成了極線圖。
barSlices = 12theta = np.linspace(0.0, 2*np.pi, barSlices, endpoint=False)r = 30*np.random.rand(barSlices)# theta 角度 r 距離原點的距離 mfc點的顏色 ms點的大小plt.polar(theta, r, color="chartreuse", linewidth=2, marker="*",mfc="b",ms=10)plt.show()
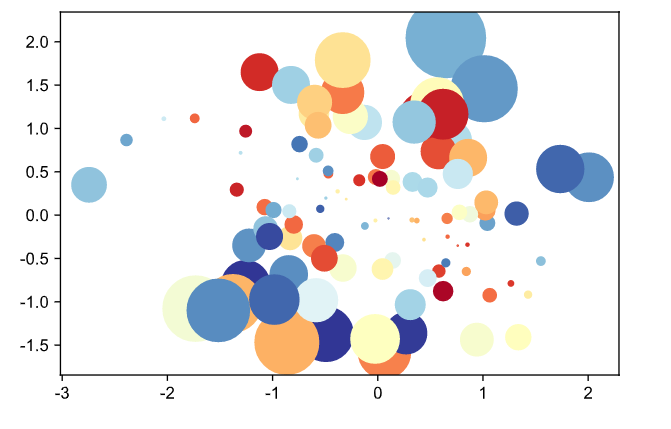
2.6 函數(shù)scatter 用于繪制氣泡圖
二維數(shù)據(jù)借助氣泡大小展示三維數(shù)據(jù)
a = np.random.randn(100)b = np.random.randn(100)# s 散點標(biāo)記的大小 c 散點標(biāo)記的顏色 cmap 講浮點數(shù)映射為顏色的映射表plt.scatter(a, b, s=np.power(10*a+20*b,2),c=np.random.rand(100),cmap=mpl.cm.RdYlBu,marker="o")plt.show()
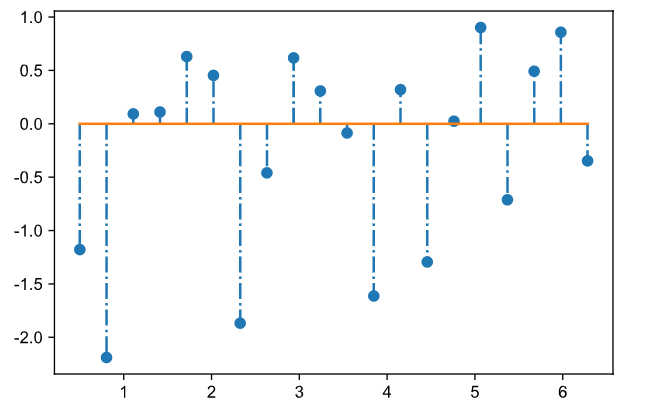
2.7 函數(shù)stem 用于繪制棉棒圖
x = np.linspace(0.5, 2*np.pi,20)y = np.random.randn(20)# y棉棒長度 linefmt棉棒樣式 markerfmt棉棒末端樣式 basefmt基線樣式plt.stem(x,y,linefmt="-.",markerfmt="o",basefmt="-", use_line_collection=True)plt.show()
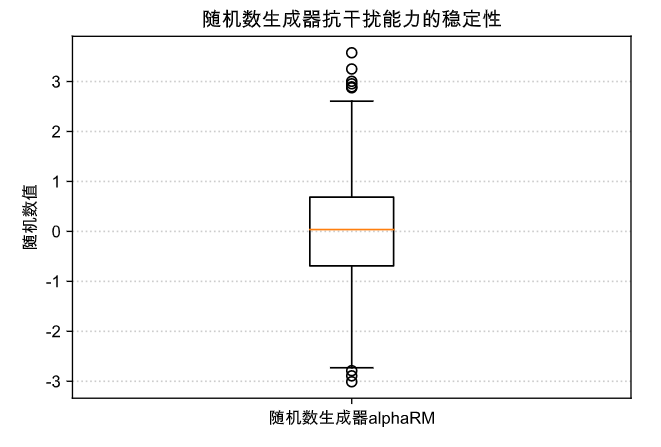
2.8 函數(shù)boxplot 用于繪制箱線圖
箱線圖是一個能夠通過5個數(shù)字來描述數(shù)據(jù)的分布的標(biāo)準(zhǔn)方式,這5個數(shù)字包括:最小值,第一分位,中位數(shù),第三分位數(shù),最大值,箱線圖能夠明確的展示離群點的信息。箱子的中間一條線,是數(shù)據(jù)的中位數(shù),代表了樣本數(shù)據(jù)的平均水平。箱子的上下限,分別是數(shù)據(jù)的上四分位數(shù)和下四分位數(shù)。這意味著箱子包含了50%的數(shù)據(jù)。
x = np.random.randn(1000)plt.boxplot(x)plt.xticks([1],["隨機數(shù)生成器alphaRM"])plt.ylabel("隨機數(shù)值")plt.title("隨機數(shù)生成器抗干擾能力的穩(wěn)定性")plt.grid(axis="y",ls=":",lw=1,color="gray",alpha=0.4)plt.show()
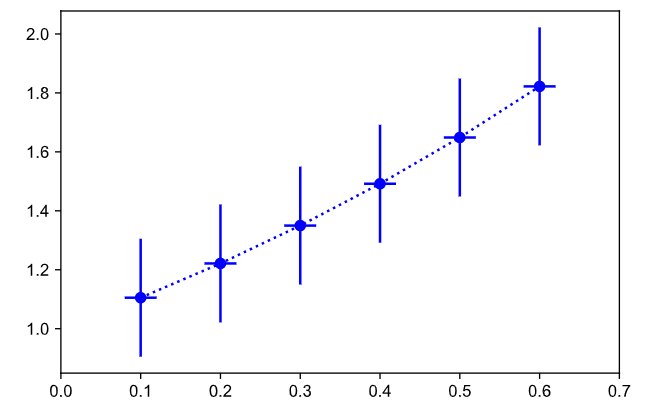
2.9 函數(shù)errorbar 用于繪制誤差棒圖
x= np.linspace(0.1,0.6,6)y = np.exp(x)# yerr y軸方向誤差 xerr x軸方向誤差plt.errorbar(x, y, fmt="bo:", yerr=0.2, xerr=0.02)plt.xlim(0,0.7)plt.show()
往期精彩回顧
獲取一折本站知識星球優(yōu)惠券,復(fù)制鏈接直接打開:
https://t.zsxq.com/662nyZF
本站qq群1003271085。
加入微信群請掃碼進群(如果是博士或者準(zhǔn)備讀博士請說明):
評論
圖片
表情