
大數(shù)據(jù)告訴你,你為什么會(huì)跳槽?
本文分析數(shù)據(jù)科學(xué)家求職情況數(shù)據(jù)集,運(yùn)用常見EDA方法分析每個(gè)特征情況及他們與目標(biāo)變量之間的關(guān)系。使用seaborn進(jìn)行數(shù)據(jù)可視化輔助分析數(shù)據(jù)科學(xué)家們更換工作都有哪些特征。
若你需要了解本數(shù)據(jù)集中每個(gè)特征變量情況,可參見《數(shù)據(jù)科學(xué)家們更換工作都有哪些特征上》。本篇將繼續(xù)探索分析,看看跳槽的人群都有哪些特征。
你打算換工作嗎?
0 - Not looking for job change
1 - Looking for a job change
target = df_train['target']
percent_nan(target)
| Total | % | |
|---|---|---|
| 0.0 | 14381 | 75.1 |
| 1.0 | 4777 | 24.9 |
sns.countplot(x='target',
              data=df_train,
              palette="Set1").set_title('Train')
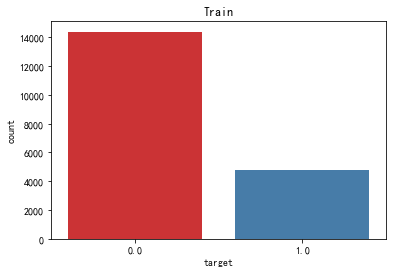
從求職人數(shù)角度看,求職人數(shù)明顯低于未求職人數(shù),僅占總?cè)藬?shù)的1/4。你是否打算跳槽?可見從事數(shù)據(jù)分析工作的工作者還算是比較穩(wěn)定的職業(yè)。從正負(fù)樣本數(shù)量看,此數(shù)據(jù)集為不平衡數(shù)據(jù)集。對于樣本不平衡,我們有較多處理方法,不在本文范圍內(nèi),下篇將為介紹不平衡數(shù)據(jù)集的常規(guī)處理方法。
人群畫像--求職者們都有哪些特征
大城市更能留住人才
with sns.axes_style():
    g = sns.displot(data=df_train,
            x='city_development_index',
            hue='target',
            kind='kde',
            legend=True,
            height=6,
            aspect=2)
    g.set_ylabels(fontsize=15)
    g.set_xlabels(fontsize=15)
    g.set_xticklabels(fontsize=15)
    g.set_yticklabels(fontsize=15)
plt.figure(figsize=(10,6))
sns.boxplot(x="target",y="city_development_index",data=df_train,palette="Set2")
plt.title("Distribution of city development index",fontsize=15)
plt.xlabel("looking for job change",fontsize=15)
plt.ylabel("city_development_index",fontsize=15)
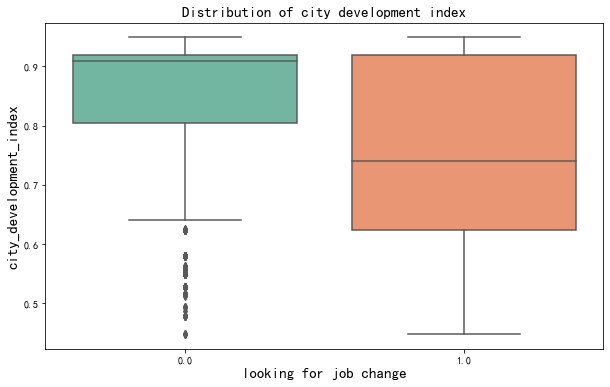
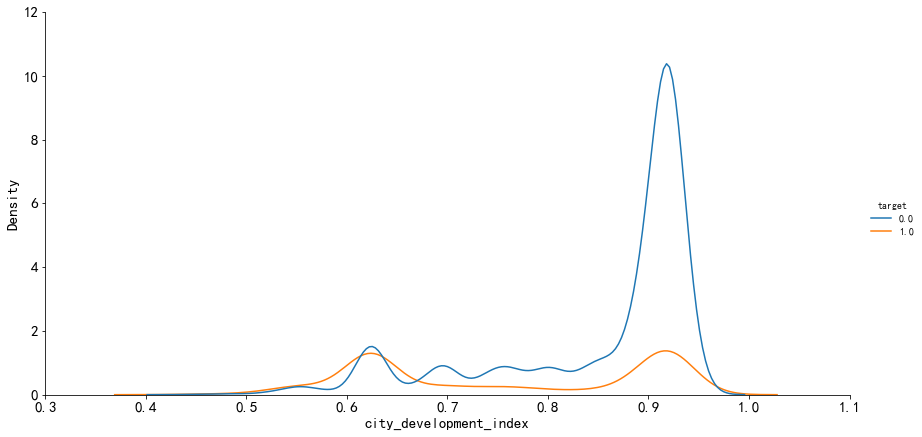
平均城市發(fā)展指數(shù)越高的城市,更換工作的人越少。也就是說大城市的人更加傾向越扎根穩(wěn)定工作。在大城市中可以得到更好的發(fā)展機(jī)會(huì),得到更高的薪酬,人們更加愿意長久地服務(wù)一家企業(yè)。
相比之下,城市發(fā)展指數(shù)較低的城市并不能夠很好地留住人才。
男性女性是否有差異?
def draw_countplot(hue,palette="Set1"):
    plt.figure(figsize=(10,6))
    ax = sns.countplot(x="target",data=df_train, hue=hue,palette=palette)
    total =float(len(df_train))

    plt.title("looking for Job change or not ?",fontsize=15)
    plt.xlabel("looking for job change",fontsize=15)
    plt.ylabel("Count",fontsize=15)

    for p in ax.patches:
        percentage = '{:.1f}%'.format(100 * p.get_height()/total)
        x = p.get_x() + p.get_width()
        y = p.get_height() + 50
        ax.annotate(percentage, (x, y),ha='right',fontsize=15)
    plt.show()
draw_countplot(hue="gender")
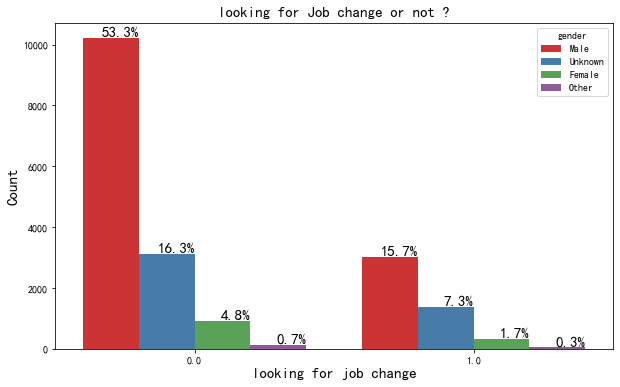
從事數(shù)據(jù)科學(xué)工作的男性居多,而女性僅占有不到10個(gè)點(diǎn)。 沒有跳槽需求的男女比例約11%,比正在尋求工作的男女比例9.2%高出約兩個(gè)百分點(diǎn),或許從事數(shù)據(jù)科學(xué)工作的男性更加傾向穩(wěn)定,又獲取更換工作的成本更高,你是屬于哪類呢? 目前約有80%的人不希望換工作。
具有相關(guān)經(jīng)驗(yàn)的人更加傾向穩(wěn)定工作
draw_countplot("relevent_experience","Set2")
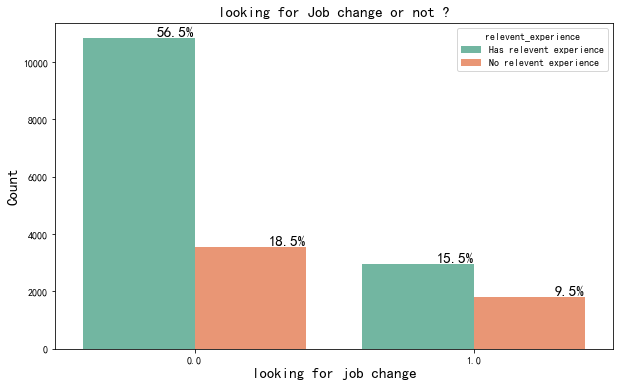
在求職者中,有相關(guān)經(jīng)驗(yàn)和沒有相關(guān)經(jīng)驗(yàn)的人相差不大。而穩(wěn)定就業(yè)人群中,大部分人都是有一定的相關(guān)經(jīng)驗(yàn),且較沒有相關(guān)經(jīng)驗(yàn)的人明顯較多。
由此也可以看出,有相關(guān)經(jīng)驗(yàn)的人更能夠更好駕馭當(dāng)前工作,更不易更換工作。
沒有相關(guān)經(jīng)驗(yàn)的人群,一般為剛畢業(yè)的應(yīng)屆生,而應(yīng)屆生離職率高達(dá)20%-30%,如此高的離職率追根究底是什么原因,是薪酬待遇不到位?是發(fā)展機(jī)會(huì)不夠多?是工作強(qiáng)度過高?是與同事或老板相處不融洽?這是個(gè)值得深思的問題。
繼續(xù)教育是離職主要原因嗎?
plt.figure(figsize=(10,6))
ax = sns.countplot(x="enrolled_university",data=df_train[df_train['target']==1],palette="Set3")
total_1 =float(len(df_train[df_train['target']==1]))
plt.title("University enrollment status of persons looking for job change",fontsize=15)
plt.xlabel("University enrollment status",fontsize=15)
plt.ylabel("count",fontsize=12)

for p in ax.patches:
    percentage = '{:.1f}%'.format(100 * p.get_height()/total_1)
    x = p.get_x() + p.get_width()
    y = p.get_height()+ 50
    ax.annotate(percentage, (x, y),ha='right',fontsize=15)
ax.set_xticklabels(df_train['enrolled_university'].unique(),fontsize=15)
ax.set_ylim(top=3300)
plt.show()
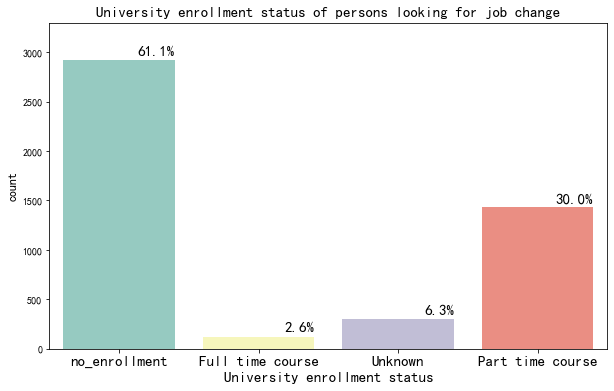
大約37%的人離職是由于離職后繼續(xù)高等教育。 大約61%的人并沒有沒有登記需要任何繼續(xù)教育。 所以,他們離職可能是由于其他原因,比如薪水問題,工作滿意度等等。
跳槽的人群中的學(xué)歷情況是怎樣的?
g = sns.catplot(x="target",
            hue='education_level',
            data=df_train,
            palette="Set1",
            kind="count",
            height=8,
            aspect=1.5)
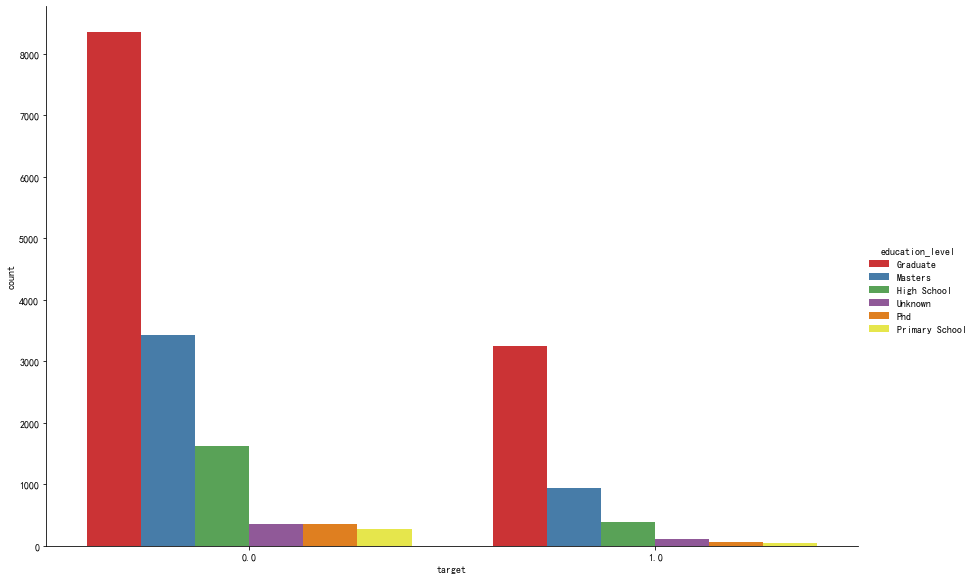
從事數(shù)據(jù)科學(xué)工作的人群中,大學(xué)本科畢業(yè)生居多,高達(dá)60.5%,而碩士研究生人數(shù)也較高,占比22.8%.
而大學(xué)本科學(xué)歷人群比具有碩士學(xué)歷的人群更易跳槽。學(xué)歷較高,意味著有相對較高的機(jī)會(huì)拿到更高的待遇,對工作滿意度更高,更易受公司重視。當(dāng)然,這都不是絕對的。
在本單位服務(wù)一年的人更易跳槽
plt.figure(figsize=(10,6))
ax = sns.countplot(x="last_new_job",data=df_train[df_train['target']==1])
total_1 =float(len(df_train[df_train['target']==1]))
plt.title("Difference in years between current job and previous job",fontsize=15)
plt.xlabel("Difference in years",fontsize=15)
plt.ylabel("count",fontsize=15)
for p in ax.patches:
    percentage = '{:.1f}%'.format(100 * p.get_height()/total_1)
    x = p.get_x() + p.get_width()
    y = p.get_height()+50
    ax.annotate(percentage, (x, y),ha='right',fontsize=15)
ax.set_ylim(top=2300)
plt.show()
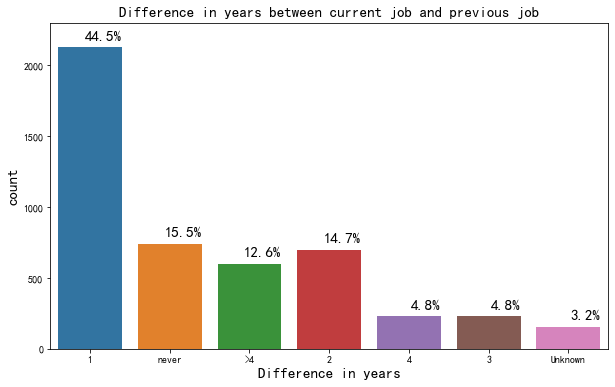
與上一份工作相差一年的人占比高達(dá)44.5%,即此工作不到一年的人更易尋求更換工作。一年基本成為一個(gè)時(shí)限,大部分人在一個(gè)單位工作能堅(jiān)持一年,其穩(wěn)定性將會(huì)更好。
理工科人群更易選擇跳槽
major_discipline = df_train[df_train['target'] == 1]['major_discipline']
values = major_discipline.value_counts()
labels = values.keys()
fig,ax = plt.subplots(figsize=(8,8))
plt.pie(x = values, labels = labels , autopct="%.2f%%",pctdistance=0.8,explode =[0.1,0,0,0,0,0,0])
plt.title('looking for job change (major discipline wise)', fontsize=18)
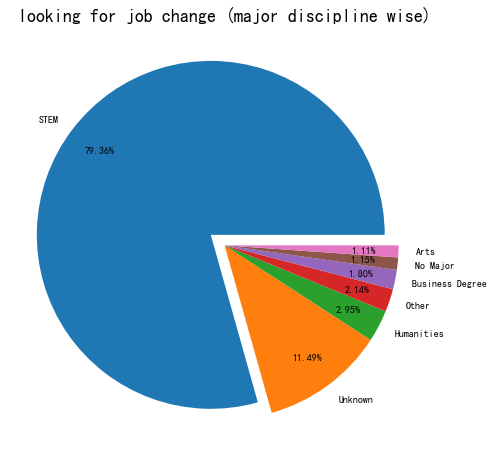
跳槽人群中,理工科占比約80%。作為一個(gè)理工科,更加傾向技術(shù)含量較高的工作,但大部分崗位并不能滿足他們但需求。再加上理工科的崗位較其他學(xué)科的崗位更多,選擇面更加廣泛,這也助長了很多從業(yè)者跳槽的意愿。
畢業(yè)后工作多少年是跳槽高峰期?
order_experience = df_train[df_train['target']==1].experience.value_counts().index
plt.figure(figsize=(10,6))
ax = sns.countplot(x="experience",data=df_train[df_train['target']==1], order=order_experience)
total_1 =float(len(df_train[df_train['target']==1]))
plt.title("Work experience")
plt.xlabel("Work experience")

for p in ax.patches:
    percentage = '{:.1f}%'.format(100 * p.get_height()/total_1)
    x = p.get_x() + p.get_width()
    y = p.get_height()
    ax.annotate(percentage, (x, y),ha='center')
plt.show()
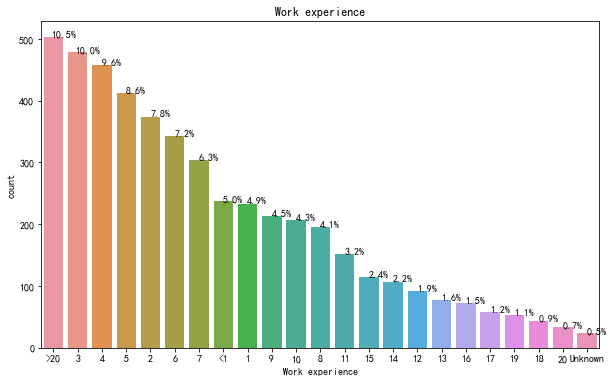
有3、4、5、2和>20經(jīng)驗(yàn)的人更有可能尋求換工作。工作大于20年基本面臨退休。
跳槽高峰期在工作3-5年,在大部分招聘崗位的招聘需求也是在這個(gè)年限。除了市場需求大外,另一個(gè)重要原因是,此年限內(nèi)的上班族在職場里,無論是專業(yè)知識、工作激情、還是經(jīng)驗(yàn)閱歷相比于近年限段的人群,都是屬于高峰期。
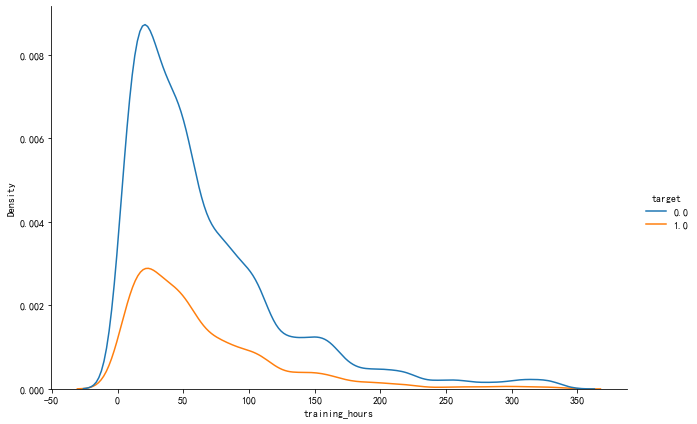
培訓(xùn)時(shí)長與目標(biāo)變量
sns.displot(data=df_train,
            x='training_hours',
            hue='target',
            kind='kde',
            height=6,
            aspect=1.5)
plt.figure(figsize=(10,6))
sns.boxplot(x="target",y="training_hours",data=df_train,palette="Set3")
plt.title("Distribution of training hours",fontsize=15)
plt.xlabel("looking for job change",fontsize=15)
plt.ylabel("training_hours",fontsize=15)
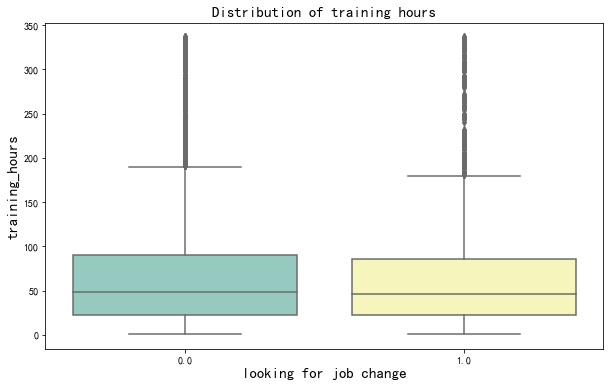
對于找工作的人來說,平均完成的培訓(xùn)時(shí)間幾乎是一樣的。這意味著訓(xùn)練時(shí)間在這里沒有影響。
pandas_profiling 教你一行代碼生成數(shù)據(jù)分析報(bào)告。
import pandas_profiling as pp
report = pp.ProfileReport(train)
report.to_file('report.html')
得到的報(bào)告,基本包含本篇所分析的每個(gè)特征變量及變量之間的關(guān)系。如下??所示。

相關(guān)閱讀: