
Thanos Ruler 組件的使用
Thano Ruler 組件是用于評估 Prometheus 的記錄規(guī)則和報警規(guī)則的組件,其本身不會抓取 metrics 接口數(shù)據(jù),而是通過 Query API 從 query 組件定期地獲取指標數(shù)據(jù),如果配置了多個 query 地址,則會采用輪詢方式獲取。

其中記錄規(guī)則評估生成的數(shù)據(jù)會保存在本地,并且定期地掃描本地生成的 TSDB 數(shù)據(jù)塊上傳到對象存儲桶中作為歷史數(shù)據(jù)長期保存。同時也實現(xiàn)了 Store API 可用于查詢本地保存的數(shù)據(jù)。與 Prometheus 節(jié)點類似,每個 ruler 節(jié)點都使用獨立的存儲,可以同時運行多個副本,而且需要為每個副本實例分配不同的標簽以作區(qū)分,因為 store 組件在查詢對象存儲中的歷史數(shù)據(jù)時是以該標簽進行分組查詢的。
安裝
由于 ruler 組件也實現(xiàn)了 Store API,所以我們也可以直接將該組件對接到 store 組件中去,只需要給創(chuàng)建的 Pod 帶上 thanos-store-api: "true" 這個標簽即可(Service 會進行自動關聯(lián))被 query 組件服務發(fā)現(xiàn)。
整體上我們可以把 ruler 節(jié)點理解為一個簡單的 Prometheus 節(jié)點,只是不需要 thanos sidecar,不抓取指標數(shù)據(jù),只負責執(zhí)行 PromQL 查詢,由于本身會保留獨立的存儲,所以同樣這里我們需要做數(shù)據(jù)的持久化。
然后可以通過部署兩個副本來實現(xiàn)高可用,這里我們添加了一個 --label=rule_replica 標簽來給數(shù)據(jù)添加一個 rule_replica 的標簽, 同時指定 --alert.label-drop 為 rule_replica,這樣在觸發(fā)告警發(fā)送通知給 AlertManager 時可以去掉這個 label,以便讓 AlertManager 自動去重,可以避免重復告警。
然后通過 --query 參數(shù)指定 query 組件地址,我們這里還是使用 DNS SRV 來做服務發(fā)現(xiàn),這樣就可以從查詢組件中獲取指標數(shù)據(jù)了。
ruler 同樣也需要對象存儲的配置,用于上傳計算出的數(shù)據(jù)到對象存儲,所以要掛載對象存儲的配置文件。--rule-file 參數(shù)可以用來指定掛載的 rule 配置,ruler 組件會根據(jù)配置來生成數(shù)據(jù)和觸發(fā)報警。
完整的資源清單文件如下所示:
#?thanos-ruler.yaml
apiVersion:?apps/v1
kind:?StatefulSet
metadata:
??name:?thanos-ruler
??namespace:?kube-mon
??labels:
????app:?thanos-ruler
spec:
??replicas:?2
??selector:
????matchLabels:
??????app:?thanos-ruler
??serviceName:?thanos-rule
??podManagementPolicy:?Parallel
??template:
????metadata:
??????labels:
????????app:?thanos-ruler
????????thanos-store-api:?"true"
????spec:
??????affinity:
????????podAntiAffinity:
??????????preferredDuringSchedulingIgnoredDuringExecution:
????????????-?weight:?100
??????????????podAffinityTerm:
????????????????topologyKey:?kubernetes.io/hostname
????????????????labelSelector:
??????????????????matchExpressions:
????????????????????-?key:?app
??????????????????????operator:?In
??????????????????????values:
????????????????????????-?thanos-ruler
??????containers:
??????-?name:?thanos-ruler
????????image:?thanosio/thanos:v0.25.1
????????args:
????????-?rule
????????-?--grpc-address=0.0.0.0:10901
????????-?--http-address=0.0.0.0:10902
????????-?--rule-file=/etc/thanos/rules/*rules.yaml
????????-?--objstore.config-file=/etc/secret/thanos.yaml
????????-?--data-dir=/var/thanos/rule
????????-?--label=rule_replica="$(NAME)"
????????-?--alert.label-drop=rule_replica
????????-?--query=dnssrv+_http._tcp.thanos-querier.kube-mon.svc.cluster.local
????????ports:
????????-?containerPort:?10901
??????????name:?grpc
????????-?containerPort:?10902
??????????name:?http
????????env:
????????-?name:?NAME
??????????valueFrom:
????????????fieldRef:
??????????????fieldPath:?metadata.name
????????livenessProbe:
??????????httpGet:
????????????path:?/-/healthy
????????????port:?10902
????????????scheme:?HTTP
????????readinessProbe:
??????????httpGet:
????????????path:?/-/ready
????????????port:?10902
????????????scheme:?HTTP
????????volumeMounts:
????????-?mountPath:?/var/thanos/rule
??????????name:?data
??????????readOnly:?false
????????-?name:?object-storage-config
??????????mountPath:?/etc/secret
??????????readOnly:?false
????????-?name:?thanos-rules
??????????mountPath:?/etc/thanos/rules
??????volumes:
??????-?name:?object-storage-config
????????secret:
??????????secretName:?thanos-objectstorage
??????-?name:?thanos-rules
????????configMap:
??????????name:?thanos-rules
??volumeClaimTemplates:
??-?metadata:
??????name:?data
????spec:
??????accessModes:
??????-?ReadWriteOnce
??????storageClassName:?longhorn
??????resources:
????????requests:
??????????storage:?1Gi
要注意上面掛載的對象存儲配置的 Secret,另外還需要通過一個 ConfigMap 來配置 rules 規(guī)則:
#?thanos-rules-config.yaml
apiVersion:?v1
kind:?ConfigMap
metadata:
??name:?thanos-rules
??namespace:?kube-mon
data:
??record.rules.yaml:?|-
????groups:
????-?name:?k8s.rules
??????rules:
??????-?expr:?|
??????????sum(rate(container_cpu_usage_seconds_total{job="cadvisor",?image!="",?container!=""}[5m]))?by?(namespace)
????????record:?namespace:container_cpu_usage_seconds_total:sum_rate
??????-?expr:?|
??????????sum(container_memory_usage_bytes{job="cadvisor",?image!="",?container!=""})?by?(namespace)
????????record:?namespace:container_memory_usage_bytes:sum
??????-?expr:?|
??????????sum?by?(namespace,?pod,?container)?(
????????????rate(container_cpu_usage_seconds_total{job="cadvisor",?image!="",?container!=""}[5m])
??????????)
????????record:?namespace_pod_container:container_cpu_usage_seconds_total:sum_rate
這里我們簡單配置了幾個記錄規(guī)則,配置方式和之前的規(guī)則一樣的。然后直接創(chuàng)建上面的資源對象即可:
????kubectl?apply?-f?https://p8s.io/docs/thanos/manifests/thanos-rules-config-0.yaml?
????kubectl?apply?-f?https://p8s.io/docs/thanos/manifests/thanos-ruler-0.yaml?
????kubectl?get?pods?-n?kube-mon?-l?app=thanos-ruler
NAME?????????????READY???STATUS????RESTARTS???AGE
thanos-ruler-0???1/1?????Running???0??????????16m
thanos-ruler-1???1/1?????Running???0??????????16m
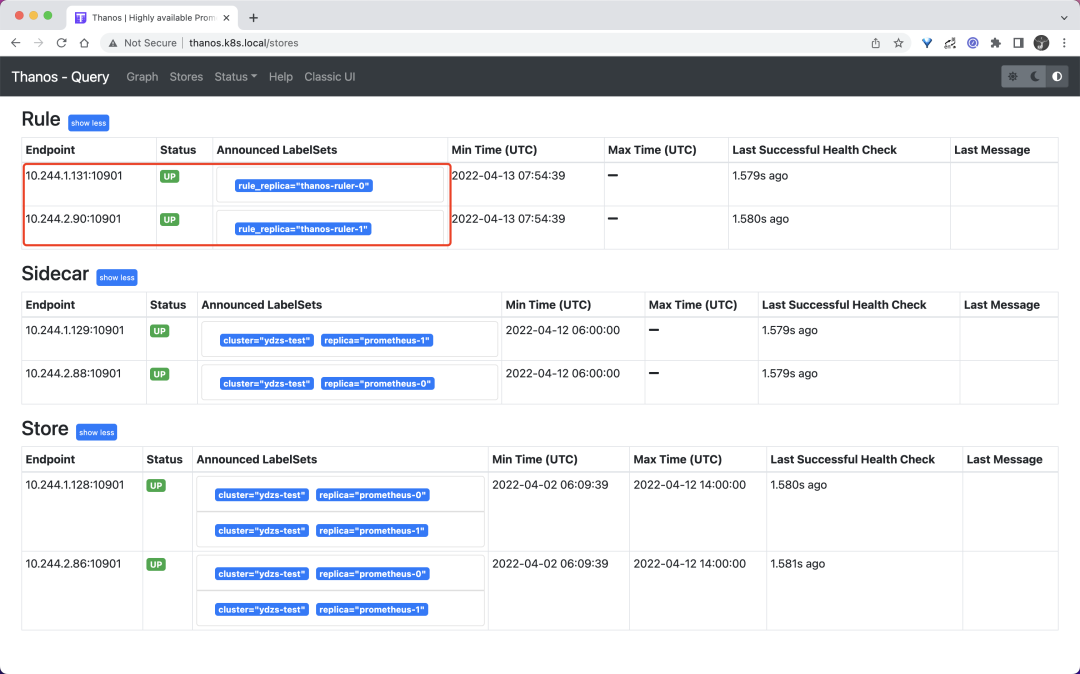
部署完成后我們可以去查看 query 組件頁面的 store 信息是否包含上面的 ruler 實例:
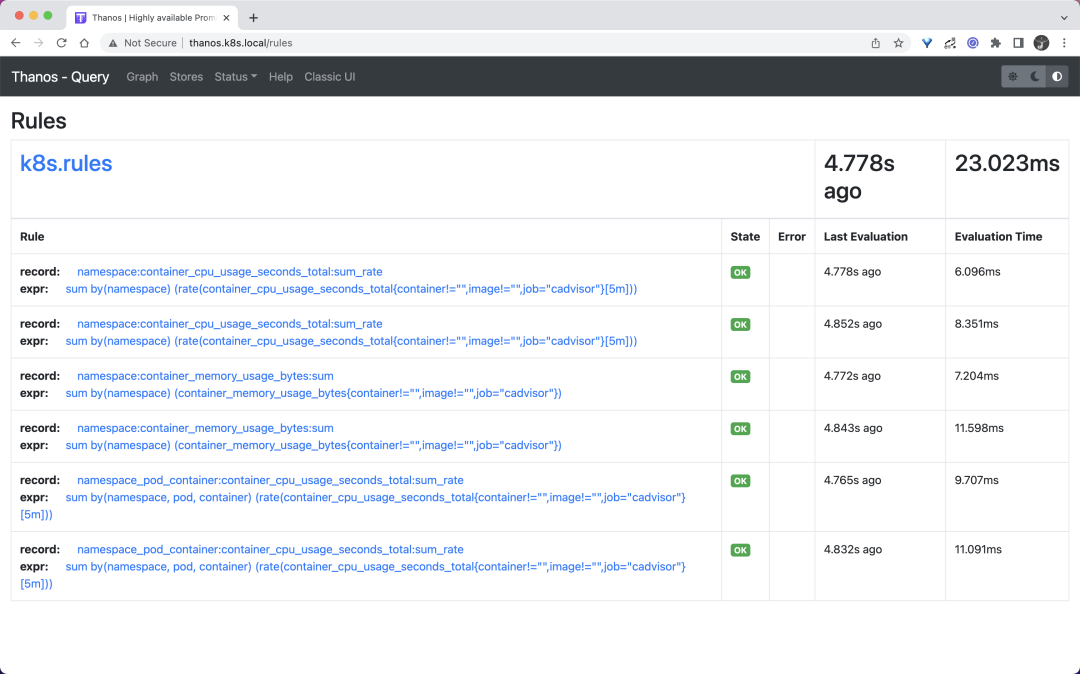
同樣在 rules 頁面可以看到我們定義的記錄規(guī)則信息:
現(xiàn)在我們可以嘗試去查詢下上面的記錄規(guī)則,比如查詢 namespace:container_cpu_usage_seconds_total:sum_rate:
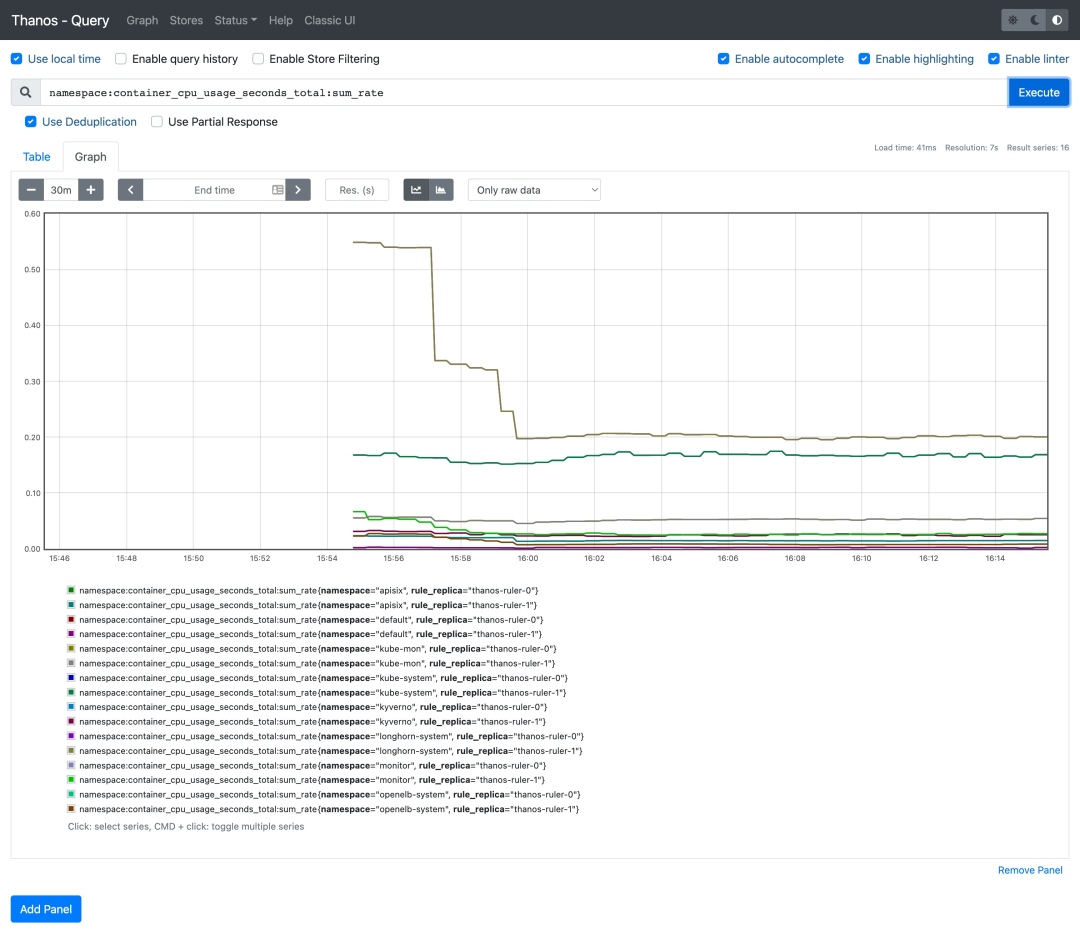
可以看到可以正常獲取到這條記錄規(guī)則的數(shù)據(jù)。
對接告警
如果要進行報警,首先我們需要通過啟動參數(shù) --alertmanagers.url 來指定 Alertmanager 的地址,如果需要更高級的配置,可以通過啟動參數(shù) --alertmanagers.config 或者 --alertmanagers.config-file 來指定對接 Alertmanager 的配置,格式如下所示:
alertmanagers:
-?http_config:
????basic_auth:
??????username:?""
??????password:?""
??????password_file:?""
????bearer_token:?""
????bearer_token_file:?""
????proxy_url:?""
????tls_config:
??????ca_file:?""
??????cert_file:?""
??????key_file:?""
??????server_name:?""
??????insecure_skip_verify:?false
??static_configs:?[]
??file_sd_configs:
??-?files:?[]
????refresh_interval:?0s
??scheme:?http
??path_prefix:?""
??timeout:?10s
??api_version:?v1
比如我們這里對接前面章節(jié)中的 Alertmanager,則直接這上面的資源對象容器啟動參數(shù)中增加 - --alertmanagers.url=http://alertmanager:9093 即可。然后在上面的 thanos-rules 的 ConfigMap 中新增一個 alert.rules.yaml 的配置,用來配置報警規(guī)則,如下所示:
#?thanos-rules-config.yaml
apiVersion:?v1
kind:?ConfigMap
metadata:
??name:?thanos-rules
??namespace:?kube-mon
data:
??record.rules.yaml:?|-
??#?......
??alert.rules.yaml:?|-
????groups:
????-?name:?test-node-mem
??????rules:??
??????-?alert:?NodeMemoryUsage??
????????expr:?(node_memory_MemTotal_bytes?-?(node_memory_MemFree_bytes?+?node_memory_Buffers_bytes?+?node_memory_Cached_bytes))?/?node_memory_MemTotal_bytes?*?100?>?30
????????for:?1m
????????labels:
??????????team:?node
??????????severity:?critical
????????annotations:
??????????summary:?"{{$labels.instance}}:?High?Memory?usage?detected"
??????????description:?"{{$labels.instance}}:?Memory?usage?is?above?30%?(current?value?is:?{{?$value?}})"
直接更新上面的兩個資源對象即可:
????kubectl?apply?-f?https://p8s.io/docs/thanos/manifests/thanos-rules-config.yaml?
????kubectl?apply?-f?https://p8s.io/docs/thanos/manifests/thanos-ruler.yaml
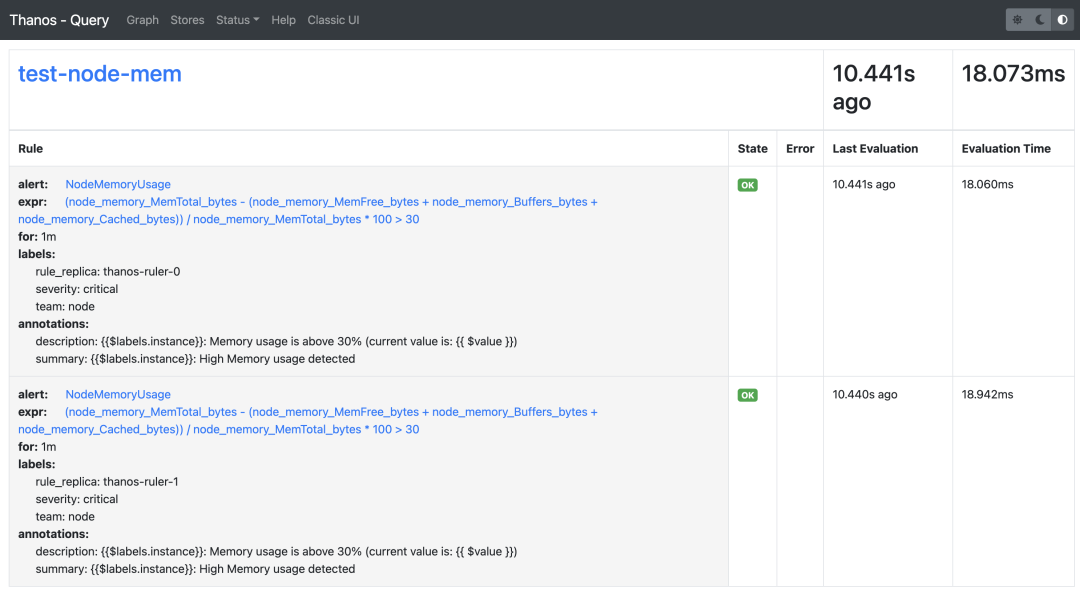
更新完成后這 query 的 rules 頁面也可以看到上面新增的報警規(guī)則了,因為我們部署的是兩個副本,所以能看到兩條一樣的規(guī)則:
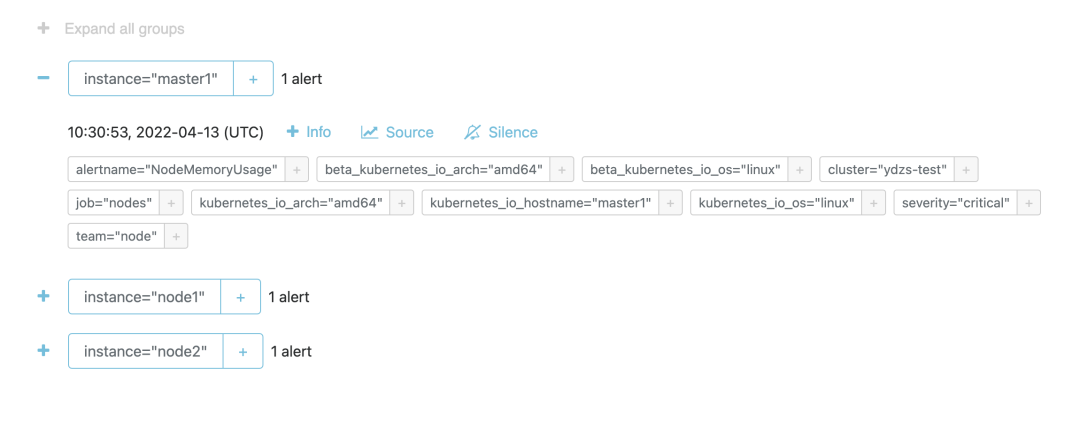
由于我們這 ruler 組件啟動參數(shù)中配置了參數(shù) - --alert.label-drop=rule_replica,所以 Alertmanager 中不會收到重復報警,不過需要注意的是經(jīng)測試這里的 rule_replica 不能加引號,加上引號會去重失效,我們可以前往 Alertmanager 查看觸發(fā)的報警信息:
由于 ruler 組件獲取評估數(shù)據(jù)的路徑是 ruler --> query --> sidecar --> prometheus,需要經(jīng)整個查詢鏈條,這也提升了發(fā)生故障的風險,而且評估原本就可以在 Prometheus 中進行,所以在非必要的情況下更加推薦使用原本的 Prometheus 方式來做報警和記錄規(guī)則的評估。