用Python制作酷炫的可視化報(bào)表。
在數(shù)據(jù)展示中使用圖表來分享自己的見解,是個(gè)非常常見的方法。
這也是Tableau、Power BI這類商業(yè)智能儀表盤持續(xù)流行的原因之一,這些工具為數(shù)據(jù)提供了精美的圖形解釋。
當(dāng)然了,這些工具也有著不少缺點(diǎn),比如不夠靈活,無法讓你自己創(chuàng)建設(shè)計(jì)。
當(dāng)你對(duì)圖表展示要求定制化時(shí),編程也許就比較適合你,比如Echarts、D3.js。
今天給大家介紹一個(gè)用Python制作可視化報(bào)表的案例,主要是使用到Dash+Tailwindcss。
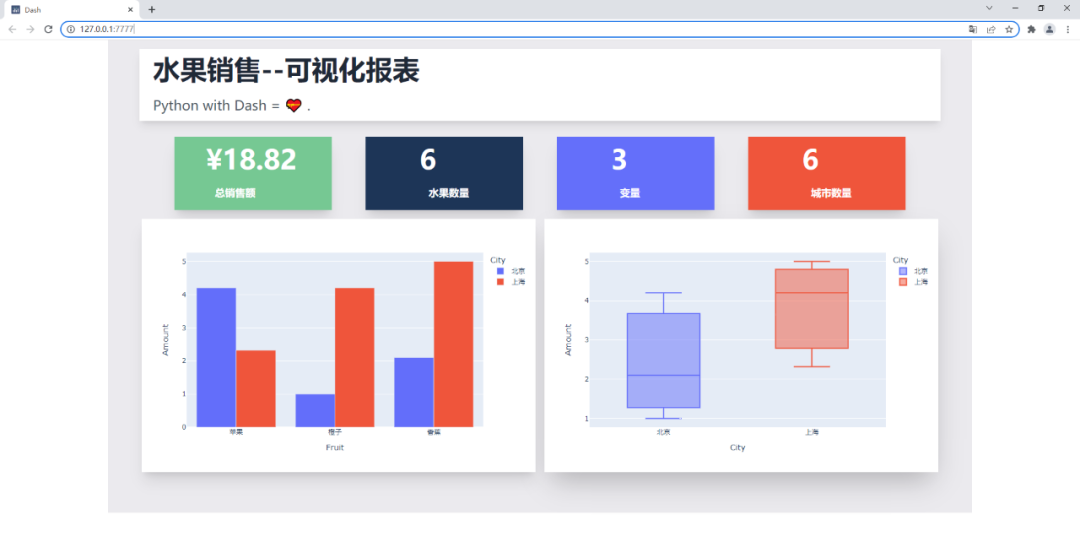
可視化報(bào)表效果如下,水果銷售情況一覽~
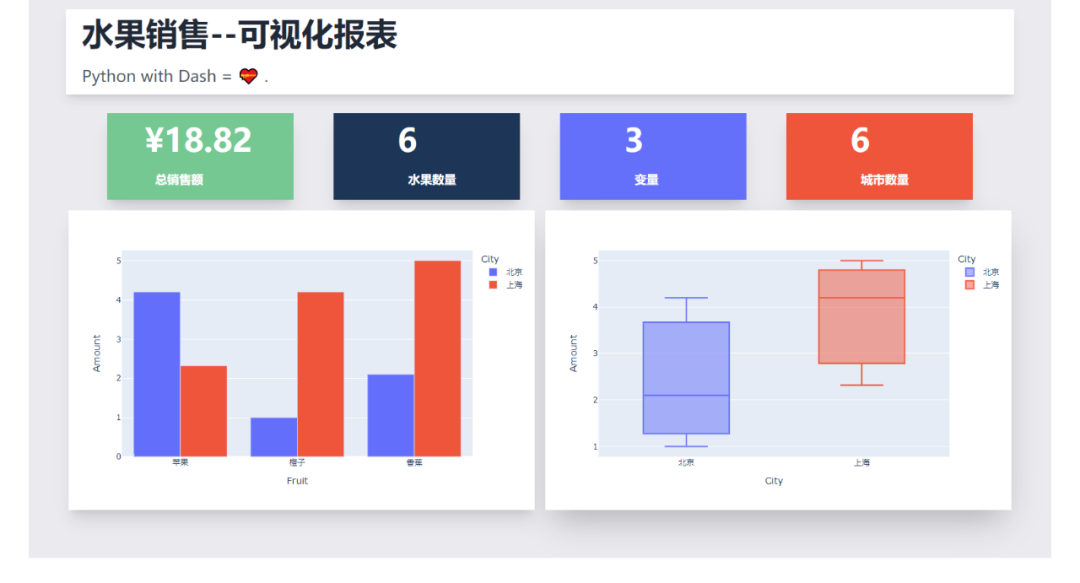
Dash是基于Plotly搭建的Dashbord框架,支持Python、R和Julia。使用Dash,你可以創(chuàng)建自定義響應(yīng)式儀表板。

相關(guān)文檔
說明:https://dash.plotly.com/introduction
案例:https://dash.gallery/Portal/
源碼:https://github.com/plotly/dash-sample-apps/
Tailwindcss則是一個(gè)實(shí)用程序優(yōu)先的CSS框架,用于快速構(gòu)建自定義界面。

“這種框架只適用于那種只會(huì)實(shí)現(xiàn)頁面布局美化元素而不關(guān)心實(shí)現(xiàn)業(yè)務(wù)邏輯的前端”。
看看別人對(duì)它的評(píng)價(jià),對(duì)于無交互的圖表,完全足夠了。
相關(guān)文檔
說明:https://www.tailwindcss.cn/docs
GitHub:https://github.com/tailwindlabs/tailwindcss
下面就給大家講解下如何通過Dash+Tailwindcss搭建可視化報(bào)表~
首先安裝相關(guān)的Python庫,然后導(dǎo)入。
import?dash
import?pandas?as?pd
import?plotly.express?as?px
from?dash?import?dcc,?html
使用到了Pandas、Plotly、dash這三個(gè)Python庫。
我們需要把Tailwindcss的CDN作為external_script,并將其傳遞給我們的應(yīng)用程序?qū)嵗@樣我們才可以成功使用Tailwindcss。
#?導(dǎo)入tailwindcss的CDN
external_script?=?["https://tailwindcss.com/",?{"src":?"https://cdn.tailwindcss.com"}]

#?創(chuàng)建Dash實(shí)例
app?=?dash.Dash(
????__name__,
????external_scripts=external_script,
)
app.scripts.config.serve_locally?=?True
使用Pandas創(chuàng)建水果銷售數(shù)據(jù),隨便虛構(gòu)了一個(gè)。
#?創(chuàng)建數(shù)據(jù)
df?=?pd.DataFrame(
????{
????????"Fruit":?["蘋果",?"橙子",?"香蕉",?"蘋果",?"橙子",?"香蕉"],
????????"Amount":?[4.2,?1.0,?2.1,?2.32,?4.20,?5.0],
????????"City":?["北京",?"北京",?"北京",?"上海",?"上海",?"上海"],
????}
)
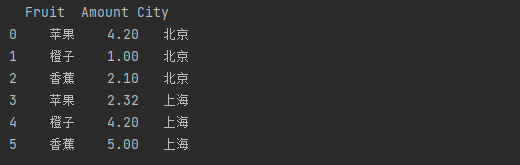
print(df)
結(jié)果如下,3列6行,包含水果、銷售額、城市列。
處理一下相關(guān)的數(shù)據(jù),水果單數(shù)、銷售總額、城市單數(shù)、變量數(shù)。
#?水果單數(shù)
fruit_count?=?df.Fruit.count()
#?銷售總額
total_amt?=?df.Amount.sum()
#?城市單數(shù)
city_count?=?df.City.count()
#?變量數(shù)
variables?=?df.shape[1]
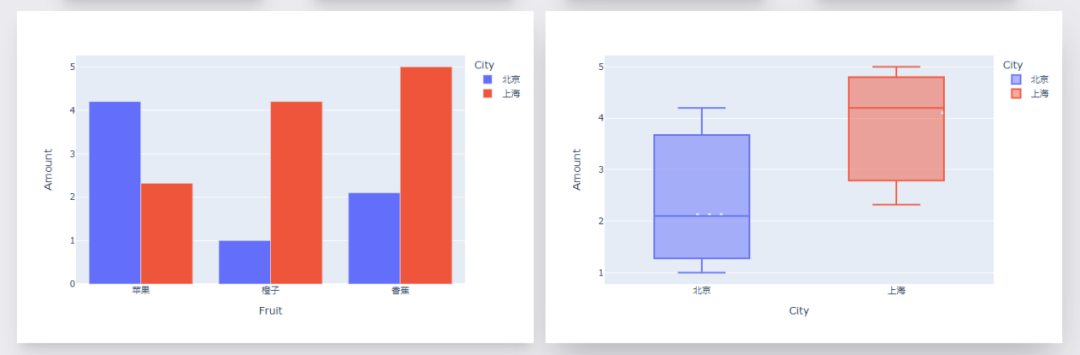
創(chuàng)建圖表實(shí)例,一個(gè)柱狀圖、一個(gè)箱型圖。
#?柱狀圖1,?不同水果不同城市的銷售額
fig?=?px.bar(df,?x="Fruit",?y="Amount",?color="City",?barmode="group")

#?箱型圖1,?不同城市的銷售額分布情況
fig1?=?px.box(df,?x="City",?y="Amount",?color="City")
效果如下。
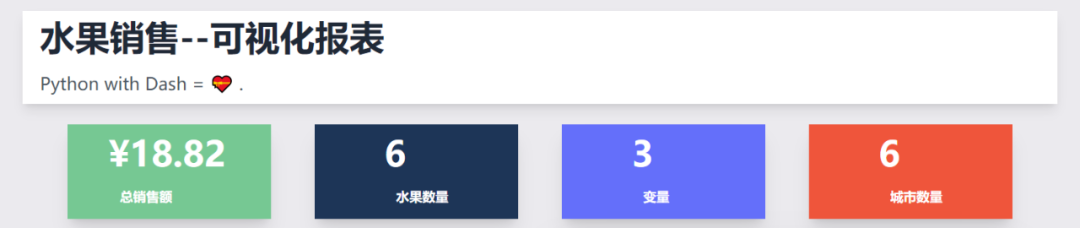
剩下就是文字模塊啦,文字+CSS樣式。
其中排版布局美化,通過Tailwindcss來實(shí)現(xiàn)。
app.layout?=?html.Div(
????html.Div(
????????children=[
????????????html.Div(
????????????????children=[
????????????????????html.H1(children="水果銷售--可視化報(bào)表",?className="?py-3?text-5xl?font-bold?text-gray-800"),
????????????????????html.Div(
????????????????????????children="""Python?with?Dash?=??.""",
????????????????????????className="text-left?prose?prose-lg?text-2xl??py-3?text-gray-600",
????????????????????),
????????????????],
????????????????className="w-full?mx-14?px-16?shadow-lg?bg-white?-mt-14?px-6?container?my-3?",
????????????),
????????????html.Div(
????????????????html.Div(
????????????????????children=[
????????????????????????html.Div(
????????????????????????????children=[
????????????????????????????????f"¥{total_amt}",
????????????????????????????????html.Br(),
????????????????????????????????html.Span("總銷售額",?className="text-lg?font-bold?ml-4"),
????????????????????????????],
????????????????????????????className="?shadow-xl?py-4?px-14?text-5xl?bg-[#76c893]?text-white??font-bold?text-gray-800",
????????????????????????),
????????????????????????html.Div(
????????????????????????????children=[
????????????????????????????????fruit_count,
????????????????????????????????html.Br(),
????????????????????????????????html.Span("水果數(shù)量",?className="text-lg?font-bold?ml-4"),
????????????????????????????],
????????????????????????????className="?shadow-xl?py-4?px-24?text-5xl?bg-[#1d3557]?text-white??font-bold?text-gray-800",
????????????????????????),
????????????????????????html.Div(
????????????????????????????children=[
????????????????????????????????variables,
????????????????????????????????html.Br(),
????????????????????????????????html.Span("變量",?className="inline-flex?items-center?text-lg?font-bold?ml-4"),
????????????????????????????],
????????????????????????????className="?shadow-xl?py-4?px-24?text-5xl?bg-[#646ffa]?text-white??font-bold?text-gray-800",
????????????????????????),
????????????????????????html.Div(
????????????????????????????children=[
????????????????????????????????city_count,
????????????????????????????????html.Br(),
????????????????????????????????html.Span("城市數(shù)量",?className="text-lg?font-bold?ml-4"),
????????????????????????????],
????????????????????????????className="w-full?shadow-xl?py-4?px-24?text-5xl?bg-[#ef553b]?text-white??font-bold?text-gray-800",
????????????????????????),
????????????????????],
????????????????????className="my-4?w-full?grid?grid-flow-rows?grid-cols-1?lg:grid-cols-4?gap-y-4?lg:gap-[60px]",
????????????????),
????????????????className="flex?max-w-full?justify-between?items-center?",
????????????),
????????????html.Div(
????????????????children=[
????????????????????html.Div(
????????????????????????children=[
????????????????????????????dcc.Graph(id="example-graph",?figure=fig),
????????????????????????],
????????????????????????className="shadow-xl?w-full?border-3?rounded-sm",
????????????????????),
????????????????????html.Div(
????????????????????????children=[
????????????????????????????dcc.Graph(id="example-graph1",?figure=fig1),
????????????????????????],
????????????????????????className="w-full?shadow-2xl?rounded-sm",
????????????????????),
????????????????],
????????????????className="grid?grid-cols-1?lg:grid-cols-2?gap-4",
????????????),
????????],
????????className="bg-[#ebeaee]??flex?py-14?flex-col?items-center?justify-center?",
????),
????className="bg-[#ebeaee]?container?mx-auto?px-14?py-4",
)
效果如下。
最后啟動(dòng)程序代碼。
if?__name__?==?'__main__':
????#?debug模式,?端口7777
????app.run_server(debug=True,?threaded=True,?port=7777)
????#?正常模式,?網(wǎng)頁右下角的調(diào)試按鈕將不會(huì)出現(xiàn)
????#?app.run_server(port=7777)
這樣就能在本地看到可視化大屏頁面,瀏覽器打開如下地址。
http://127.0.0.1:7777
以后制作的圖表不僅能在線展示,還能實(shí)時(shí)更新,屬實(shí)不錯(cuò)~
好了,今天的分享到此結(jié)束,大家可以自行去動(dòng)手練習(xí)。
對(duì)比Excel系列圖書累積銷量達(dá)15w冊(cè),讓你輕松掌握數(shù)據(jù)分析技能,可以在全網(wǎng)搜索書名進(jìn)行了解: