
點(diǎn)云:Python版本的點(diǎn)云數(shù)據(jù)處理庫
最近在搞點(diǎn)云DL,順便看了看python版本的點(diǎn)云數(shù)據(jù)處理庫,記錄一下。
python我用得少,不喜勿噴,歡迎探討,為文明和諧的社會(huì)主義事業(yè)增磚添瓦。
測試數(shù)據(jù)是這樣的。
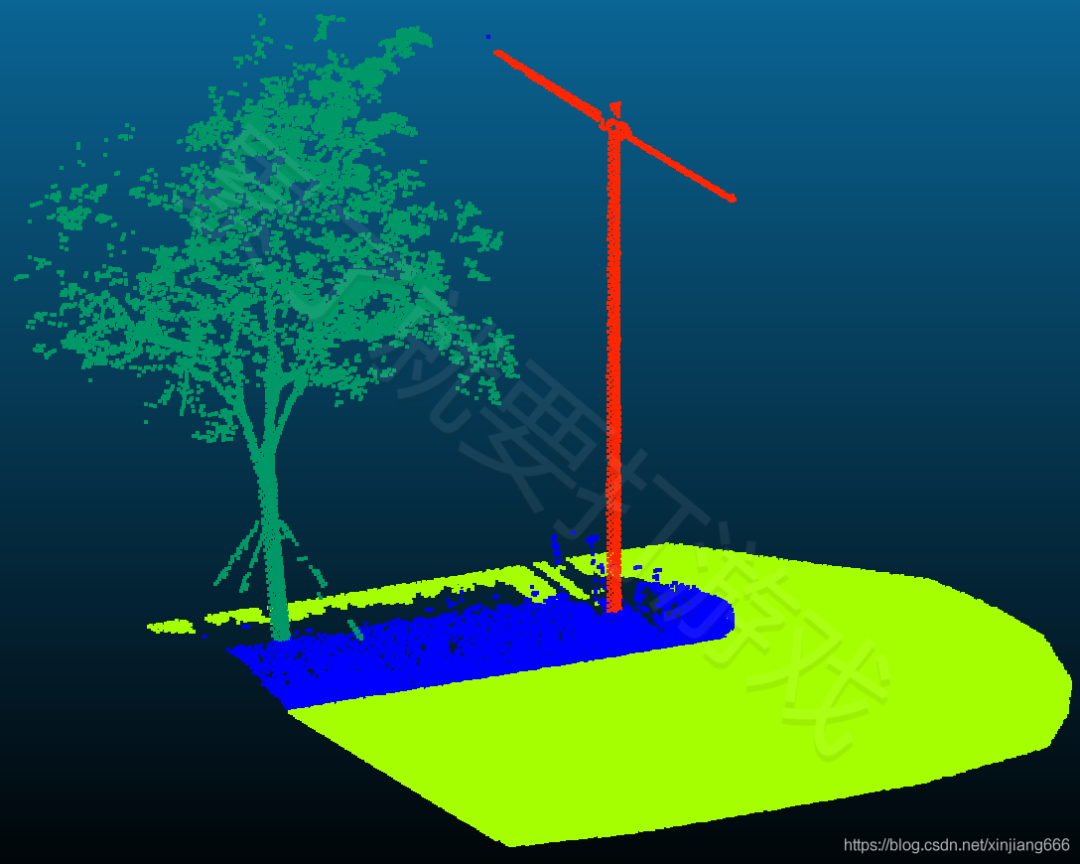
一、Open3D
A Modern Library for 3D Data Processing,Intel出品,MIT協(xié)議。
Open3D是一個(gè)支持3D數(shù)據(jù)處理軟件快速開發(fā)的開源庫。Open3D使用C++和Python公開了一組精心選擇的數(shù)據(jù)結(jié)構(gòu)和算法。后端經(jīng)過高度優(yōu)化,并設(shè)置為并行化。Open3D的依賴項(xiàng)較少,可在不同的平臺(tái)上編譯與布置。
Open3D側(cè)重于三維數(shù)據(jù)的可視化與整體處理算法。想學(xué)習(xí)的同學(xué)可百度“Open3D學(xué)習(xí)計(jì)劃”。
官網(wǎng):Open3D – A Modern Library for 3D Data Processing
GitHub:https://github.com/intel-isl/Open3D
安裝:pip install open3d 或者 pip3 install -i https://pypi.tuna.tsinghua.edu.cn/simple open3d
分享給有需要的人,代碼質(zhì)量勿噴。
import open3d as o3d
import numpy as np
from matplotlib import pyplot as plt
# read PC
pcd = o3d.io.read_point_cloud("F:/test.pcd")
# # write PC
# o3d.io.write_point_cloud("F:/newFile.pcd",pcd)
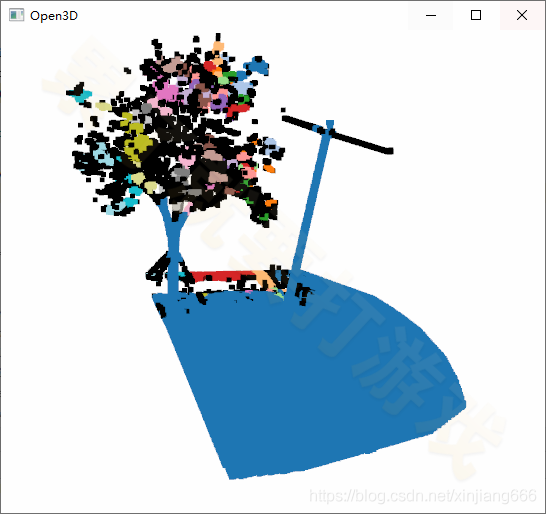
# DBSCAN
with o3d.utility.VerbosityContextManager(o3d.utility.VerbosityLevel.Debug) as cm:
labels = np.array(pcd.cluster_dbscan(eps=0.1, min_points=10, print_progress=True))
max_label = labels.max()
print(f"point cloud has {max_label + 1} clusters")
colors = plt.get_cmap("tab20")(labels / (max_label if max_label > 0 else 1))
colors[labels < 0] = 0
pcd.colors = o3d.utility.Vector3dVector(colors[:, :3])
# 可視化
o3d.visualization.draw_geometries([pcd],width=910,height=540)

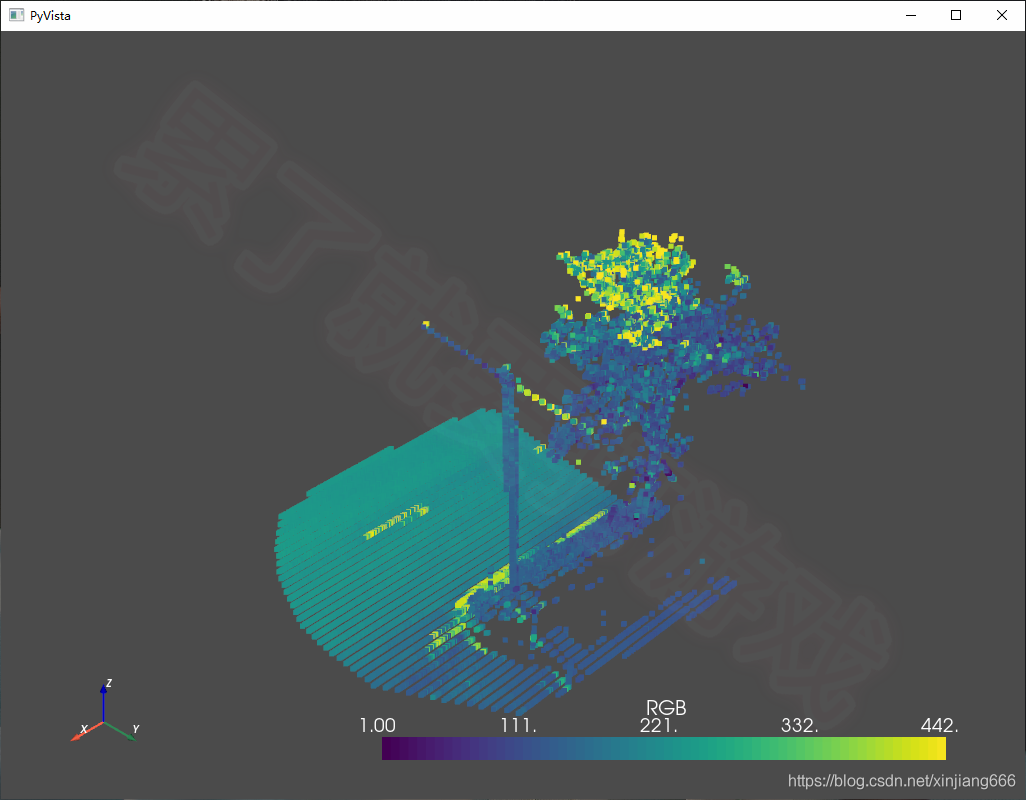
?二、PyVista
3D plotting and mesh analysis through a streamlined interface for the Visualization Toolkit (VTK),MIT協(xié)議。
PyVista具有可視化工具包(VTK)的高級(jí)API,空間數(shù)據(jù)集的網(wǎng)格數(shù)據(jù)結(jié)構(gòu)和過濾方法,使3D繪圖變得簡單,可用于大型/復(fù)雜數(shù)據(jù)幾何.
PyVista(以前稱為vtki)是可視化工具包(VTK)的幫助程序模塊,它通過NumPy和直接數(shù)組訪問采用了與VTK接口不同的方法。該軟件包提供了Pythonic的,文檔齊全的界面,該界面公開了VTK強(qiáng)大的可視化后端,以促進(jìn)對空間參考數(shù)據(jù)集的快速原型制作,分析和可視化集成。該模塊可用于演示文稿和研究論文的科學(xué)繪圖,以及其他與網(wǎng)格相關(guān)的Python模塊的支持模塊。
PyVista側(cè)重于可視化。
官網(wǎng):The PyVista Project
介紹:PyVista — PyVista 0.32.0 documentation
GitHub:https://github.com/pyvista/pyvista
安裝:pip install pyvista 或者 pip3 install -i https://pypi.tuna.tsinghua.edu.cn/simple pyvista
分享給有需要的人,代碼質(zhì)量勿噴。
import pyvista as pv
mesh = pv.read('F:/test.vtk')
mesh.plot(screenshot='F:/test.vtk.png')
/* ************************************************** 挺好的 *************************************************************** */
三、PCL
PCL(Point Cloud Library)是主要用于點(diǎn)云(二三維圖像也可)的獨(dú)立、強(qiáng)大的開源項(xiàng)目,BSD協(xié)議,可免費(fèi)用于商業(yè)和研究用途。
PCL是點(diǎn)云數(shù)據(jù)處理的王者庫,近乎全能,可視化、讀寫、算法(!!!)。
官網(wǎng):Point Cloud Library | The Point Cloud Library (PCL) is a standalone, large scale, open project for 2D/3D image and point cloud processing.
GitHub:https://github.com/PointCloudLibrary
但是,python-pcl安裝較為麻煩!!!建議谷歌或百度。
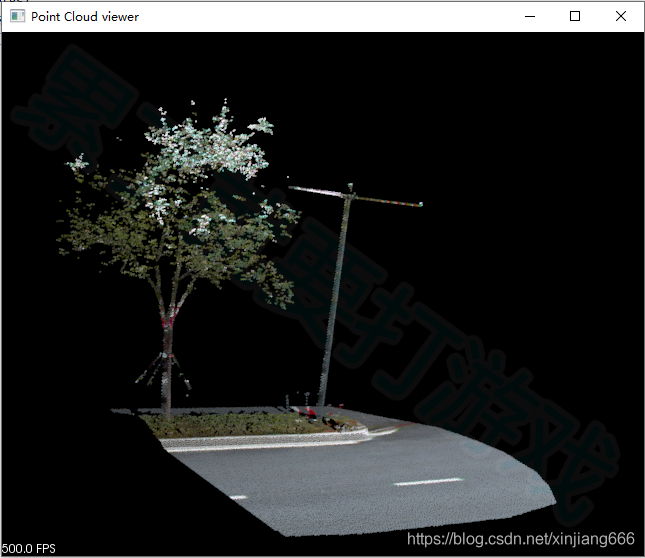
四、pclpy
pclpy是python-pcl的姊妹庫吧,安裝很方便,算法接口啥的也挺全的,而且,支持las。同時(shí)存在某些限制,比如正在開發(fā)中,API和功能測試也許會(huì)不穩(wěn)定,只支持Windows和python 3.6 x64。
介紹:pclpy · PyPI
GitHub:https://github.com/davidcaron/pclpy
安裝:pip install pclpy 或者 pip3 install -i https://pypi.tuna.tsinghua.edu.cn/simple pclpy
分享給有需要的人,代碼質(zhì)量勿噴。
import pclpy
from pclpy import pcl
# 讀
pc=pclpy.pcl.PointCloud.PointXYZRGBA()
pcl.io.loadPCDFile('F:/test.pcd',pc)
# 顯示
viewer=pcl.visualization.PCLVisualizer('Point Cloud viewer')
viewer.addPointCloud(pc)
while(not viewer.wasStopped()):
viewer.spinOnce(100)
五、pyntcloud
pyntcloud是一個(gè)Python 3.x庫,利用Python科學(xué)堆棧的強(qiáng)大功能處理3D點(diǎn)云。
pyntcloud側(cè)重于點(diǎn)云數(shù)據(jù)處理,例如讀寫(支持las)、屬性、濾波、數(shù)據(jù)結(jié)構(gòu)組織、構(gòu)建體素、抽稀、RANSAC等。與Open3D、PyVista等庫銜接較好。
介紹:pyntcloud | Read the Docs
GitHub:https://github.com/daavoo/pyntcloud
安裝:pip install pyntcloud 或者 pip3 install -i https://pypi.tuna.tsinghua.edu.cn/simple pyntcloud
分享給有需要的人,代碼質(zhì)量勿噴。
from pyntcloud import PyntCloud
import open3d as o3d
# io
cloud = PyntCloud.from_file("F:/test.ply")
# structures
kdtree_id = cloud.add_structure("kdtree")
# neighbors
k_neighbors = cloud.get_neighbors(k=5, kdtree=kdtree_id)
# scalar_fields
ev = cloud.add_scalar_field("eigen_values", k_neighbors=k_neighbors)
# filters
f = cloud.get_filter("BBOX", min_x=0.1, max_x=0.8)
# FROM Open3D
original_triangle_mesh = o3d.io.read_triangle_mesh("F:/test.ply")
cloud = PyntCloud.from_instance("open3d", original_triangle_mesh)
# TO Open3D
cloud = PyntCloud.from_file("F:/test.ply")
converted_triangle_mesh = cloud.to_instance("open3d", mesh=True) # mesh=True by default
/* *************************************************? liblas系列? *************************************************** */
六、libLAS
libLAS是一個(gè)C/C++/Python庫(接觸的第一個(gè)點(diǎn)云處理庫),用于讀寫LAS格式的點(diǎn)云。libLAS支持ASPRS LAS格式規(guī)范版本:1.0、1.1、1.2和1.3(基本支持)。雖然libLAS已經(jīng)被 PDAL / Laspy 取代,但不可否認(rèn),它是一個(gè)很nice的庫。
libLAS庫側(cè)重于點(diǎn)云的讀寫、修改編輯處理。
介紹:libLAS - LAS 1.0/1.1/1.2 ASPRS LiDAR data translation toolset — liblas.org
API:Python Class Documentation — liblas.org
GitHub:https://github.com/libLAS
安裝:pip install liblas ?或者? pip install -i https://pypi.tuna.tsinghua.edu.cn/simple liblas
分享給有需要的人,代碼質(zhì)量勿噴。
import liblas
from liblas import file
from liblas import header
# 讀
f=file.File('F:/test.las',mode='r')
# 頭文件
lasHeader = f.header
print('主版本號(hào):' + str(lasHeader.major_version))
print('副版本號(hào):' + str(lasHeader.minor_version))
print('最小值:%f,%f,%f' % (lasHeader.min[0],lasHeader.min[1],lasHeader.min[2]))
print('最大值:%f,%f,%f' % (lasHeader.max[0],lasHeader.max[1],lasHeader.max[2]))
print('比例:%f,%f,%f' % (lasHeader.scale[0],lasHeader.scale[1],lasHeader.scale[2]))
print('偏移量:%f,%f,%f' % (lasHeader.offset[0],lasHeader.offset[1],lasHeader.offset[2]))
print('點(diǎn)云數(shù)量:%d' % (lasHeader.point_records_count))
# 遍歷點(diǎn)
for point in f:
# point = f[0]
print('x=%f, y=%f, z=%f, intensity=%d, PointsourceID=%d, GPStime=%f,
Red=%d, Green=%d, Blue=%d, Classification=%d, UserData=%d'
% (point.x, point.y, point.z,
point.intensity, point.point_source_id, point.raw_time,
point.color.red, point.color.green, point.color.blue,
point.classification, point.user_data))
# 寫
las_header = header.Header()
las_header.dataformat_id = 1
las_header.minor_version = 2
fw = file.File('F:/new.las', mode='w', header=las_header)
pt = liblas.point.Point()
for i in range(10):
pt.x = 118.0+i
pt.y = 532.0+i
pt.z = 112.0+i
fw.write(pt)
fw.close()
print('ok666')
七、PDAL
libLAS的升級(jí)版。PDAL(Point Data Abstraction Library)是一個(gè)C/C ++開源庫,用于轉(zhuǎn)換和處理點(diǎn)云數(shù)據(jù)。盡管庫中許多重點(diǎn)工具源于LiDAR,但它不限于LiDAR數(shù)據(jù)。
介紹:PDAL - Point Data Abstraction Library — pdal.io
API:Python Class Documentation — liblas.org
GitHub:https://github.com/PDAL
安裝:pip install PDAL(沒成功,郁悶)???
八、Laspy
兼容 libLAS 的點(diǎn)云處理python庫,與 libLAS算是一家吧。Laspy是一個(gè)用于讀取、修改和創(chuàng)建LAS LiDAR文件的python庫。對LAZ的支持僅限于1.0-1.3版本。Laspy與Python 2.6+和3.5+兼容。Laspy包含一組命令行工具,可用于執(zhí)行基本文件操作,例如格式轉(zhuǎn)換和驗(yàn)證以及比較LAS文件。
API:Laspy: Documentation — laspy 1.2.5 documentation
API:laspy 2.0
GitHub:https://github.com/grantbrown/laspy
安裝:pip install laspy 或者 pip3 install -i https://pypi.tuna.tsinghua.edu.cn/simple laspy
分享給有需要的人,代碼質(zhì)量勿噴。
import math
import numpy as np
import laspy
# 讀
las = laspy.read('E:/data/test.las')
# 頭
lasHeader = las.header
print('主版本號(hào):' + str(lasHeader.major_version))
print('副版本號(hào):' + str(lasHeader.minor_version))
print('最小值:%f,%f,%f' % (lasHeader.min[0], lasHeader.min[1], lasHeader.min[2]))
print('最大值:%f,%f,%f' % (lasHeader.max[0], lasHeader.max[1], lasHeader.max[2]))
print('比例:%f,%f,%f' % (lasHeader.scale[0], lasHeader.scale[1], lasHeader.scale[2]))
print('偏移量:%f,%f,%f' % (lasHeader.offset[0], lasHeader.offset[1], lasHeader.offset[2]))
print('點(diǎn)云數(shù)量:%d' % (lasHeader.point_records_count))
# 遍歷點(diǎn)
points = las.points
def scaled_x_dimension(las_file):
x_dimension = las_file.X
scale = las_file.header.scale[0]
offset = las_file.header.offset[0]
return (x_dimension * scale + offset)
##################### 遍歷點(diǎn),給GPStime賦新值
gpstime= []
for i in range(lasHeader.point_records_count):
print('x=%f, y=%f, z=%f, intensity=%d, GPStime=%f, PointSourceID=%f, '
'Classification=%d, UserData=%d, Red=%d, Green=%d, Blue=%d'
% (scaled_x_dimension(las)[i], las.y[i],las.z[i],
las.intensity[i], las.gps_time[i],las.point_source_id[i],
las.classification[i],las.user_data[i],
las.red[i],las.green[i], las.blue[i]))
gpstime.append(i)
############################writer:原有XYZ不變
new_las = laspy.LasData(las.header)
new_las.x = las.x
new_las.y = las.y
new_las.z = las.z
new_las.intensity = las.intensity
new_las.gps_time = gpstime
new_las.red = las.red
new_las.green = las.green
new_las.blue = las.blue
new_las.write("E:/new_las.las")
####################################按類別篩選
new_file_c0 = laspy.create(point_format=las.header.point_format,
file_version=las.header.version)
new_file_c0.points = las.points[las.classification == 0]
new_file_c0.write('E:/new_file_c0.las')
#region #################旋轉(zhuǎn)點(diǎn)云,XY變化,頭 變化,添加新的屬性
#旋轉(zhuǎn)參數(shù)
basePx = (lasHeader.min[0]+lasHeader.max[0]) / 2
basePy = (lasHeader.min[1]+lasHeader.max[1]) / 2
cosa = 0.5
sina = math.sqrt(1-cosa*cosa)
#遍歷點(diǎn)
xo = []
yo = []
xj = []
for i in range(lasHeader.point_records_count):
x = las.x[i] - basePx
y = las.y[i] - basePy
xnew = x * cosa - y * sina + basePx
ynew = x * sina + y * cosa + basePy
xo.append(xnew)
yo.append(ynew)
xj.append(i)
#保存新的點(diǎn)云
header = laspy.LasHeader(point_format=3, version="1.2")
header.offsets = [np.min(xo), np.min(yo), las.header.offsets[2]]
header.scales = np.array([0.0001, 0.0001, 0.0001])
header.add_extra_dim(laspy.ExtraBytesParams(name="xj", type=np.int32))
new_las = laspy.LasData(header)
new_las.x = xo
new_las.y = yo
new_las.z = las.z
new_las.intensity = las.intensity
new_las.gps_time = las.gps_time
new_las.point_source_id = las.point_source_id
new_las.classification = las.classification
new_las.red = las.red
new_las.green = las.green
new_las.blue = las.blue
new_las.xj = xj
new_las.write('E:/new_file_rotation.las')
#endregion
/* ************************************************************** 其它 *************************************************** */
九、plyfile
plyfile用于讀寫ply文件。
GitHub:https://github.com/dranjan/python-plyfile
安裝:pip install plyfile 或者 pip3 install -i https://pypi.tuna.tsinghua.edu.cn/simple plyfile
十、point_cloud_utils
Point Cloud Utils (pcu) - A Python library for common tasks on 3D point clouds
挺實(shí)用。
GitHub:https://github.com/fwilliams/point-cloud-utils
安裝:pip install git+git://github.com/fwilliams/point-cloud-utils
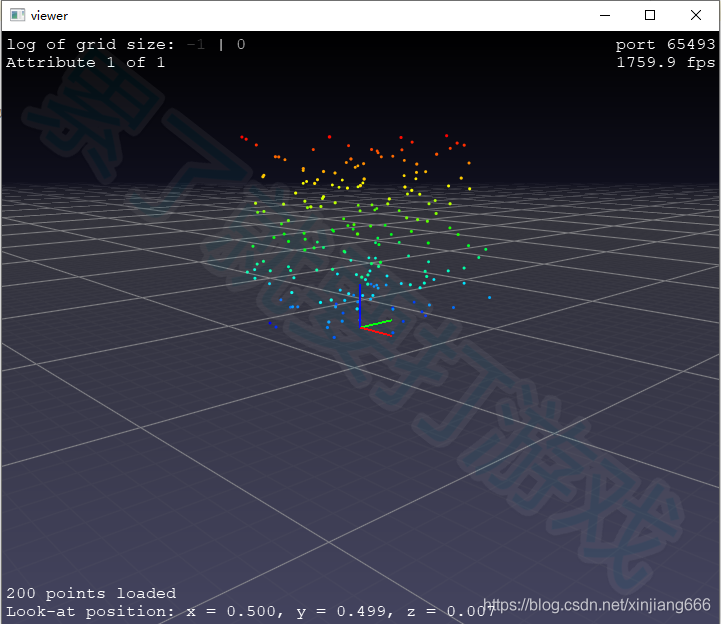
十一、pptk
pptk(Point Processing Toolkit)是用于可視化和處理二三維點(diǎn)云的python包。目前,其具有以下功能:
(1)點(diǎn)云查看,可接受任何3列numpy數(shù)組作為輸入;
(2)基于Octree的LOD點(diǎn)云渲染可視化;
(3)支持點(diǎn)選,用于檢查和注釋點(diǎn)數(shù)據(jù);
(4)并行化的點(diǎn)KD-tree;
(5)基于點(diǎn)云鄰域PCA的法線估計(jì)。
介紹:Contents — pptk 0.1.1 documentation
GitHub:https://github.com/heremaps/pptk
安裝:pip install pptk 或者 pip3 install -i https://pypi.tuna.tsinghua.edu.cn/simple pptk
分享給有需要的人,代碼質(zhì)量勿噴。
import pptk
# Create 100 random points
xyz = pptk.rand(200, 3)
# Visualize points shaded by height
v = pptk.viewer(xyz, xyz[:, 2])
v.set(point_size=0.005)
十二、PyLidar
PyLidar用于從LiDAR設(shè)備中獲取數(shù)據(jù)。其分為PyLidar2和PyLidar3,分別對應(yīng)python2和python3版本。
介紹:PyLidar — Pylidar 0.4.4 documentation
GitHub:https://github.com/lakshmanmallidi/PyLidar3
安裝:pip install PyLidar3
/* ************************************** 以下的已經(jīng)不維護(hù)或者很久沒更新了 ********************************************** */
十三、pylas
This code is no longer maintained.
Originally designed as a proof-of-concept for reading Light Detection and Ranging (LIDAR) data in binary LAS format and converting to GIS point data formats (xyz or shapefile). Today, there are much better tools for using LIDAR in python code - this repo is for archival purposes only.
GitHub:https://github.com/perrygeo/pylas
十四、las
The?las?module implements a reader for LAS (Log ASCII Standard) well log files (LAS 2.0). For more information about this format, see the Canadian Well Logging Society web page (http://www.cwls.org/las/).
GitHub:https://github.com/WarrenWeckesser/las