
如何快速定位當(dāng)前數(shù)據(jù)庫消耗 CPU 最高的 SQL 語句?
點(diǎn)擊下方“IT牧場”,選擇“設(shè)為星標(biāo)”

來源:https://www.toutiao.com/i6923526305795293707?wid=1623686217615
概述
如果是Oracle數(shù)據(jù)庫我們可以很容易通過sql來定位到當(dāng)前數(shù)據(jù)庫中哪些消耗CPU高的語句,而mysql數(shù)據(jù)庫可以怎么定位呢?這里用一個(gè)簡單例子說明下...
主要是了解如何定位的思路,具體看官網(wǎng)介紹..
參考:https://www.percona.com/blog/2020/04/23/a-simple-approach-to-troubleshooting-high-cpu-in-mysql/
One of our customers recently asked whether it is possible to identify, from the MySQL side, the query that is causing high CPU usage on his system. The usage of simple OS tools to find the culprit has been a widely used technique for a long time by PostgreSQL and Oracle DBAs, but it didn’t work for MySQL as historically we’ve lacked the instrumentation to match an OS thread with an internal processlist thread – until recently.
Percona added support to map processlist ids to OS thread ids through column TID of the information_schema.processlist table starting on Percona Server for MySQL 5.6.27. With the release of 5.7, MySQL followed with its own implementation by extending the PERFORMANCE_SCHEMA.THREADS table and adding a new column named THREAD_OS_ID, which Percona Server for MySQL adopted in place of its own, as it usually does remain as close to upstream as possible.
The following approach is useful for cases where there is a query overloading one particular CPU while other cores are performing normally. For cases where it is a general CPU usage issue, different methods can be used, such as the one in this other blog post Reducing High CPU on MySQL: A Case Study.
主要意思是針對(duì)定位CPU的問題,Percona增加了對(duì)通過信息的TID列將processlist ID映射到OS線程ID的支持,而MySQL在5.7版本后在 PERFORMANCE_SCHEMA.THREADS表加了一個(gè)THREAD_OS_ID新列來實(shí)現(xiàn),以下方法適用于在其他內(nèi)核正常運(yùn)行時(shí),某個(gè)特定CPU的查詢過載的情況。
find out which session is using the most CPU resources in my database?
1、定位線程
pidstat -t -p <mysqld_pid> 1 5
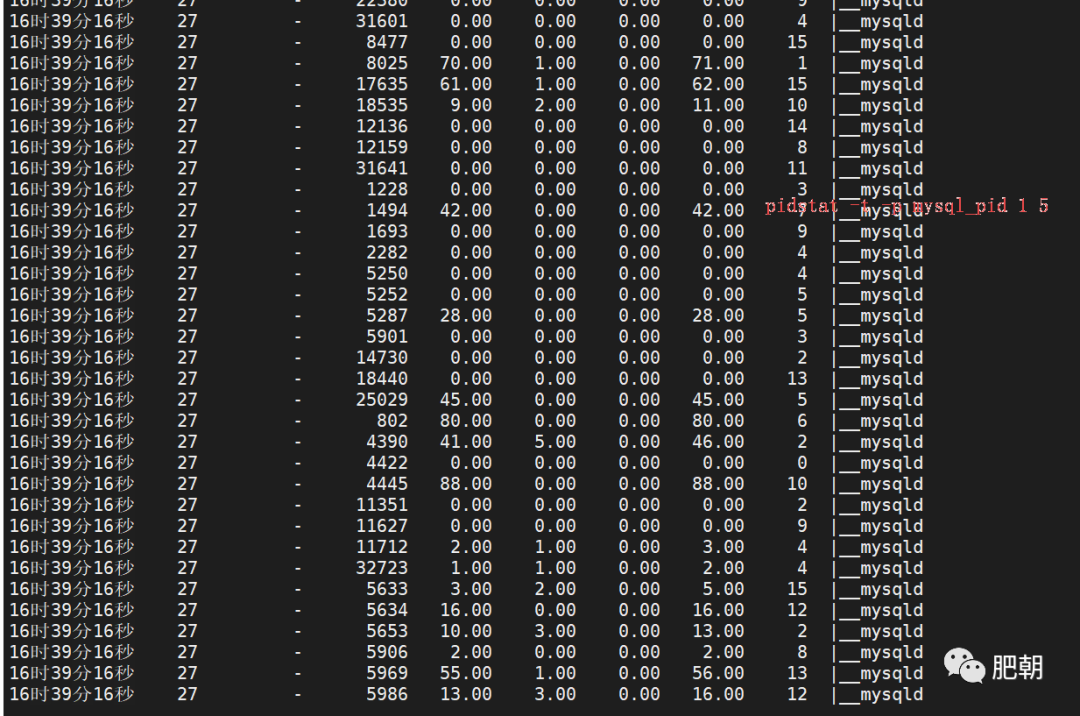
通過該命令我們可以定位到802、4445等線程消耗了大量的CPU,這里盡量確保在pidstat的多個(gè)樣本中驗(yàn)證消耗是恒定的。根據(jù)這些信息,我們可以登錄到數(shù)據(jù)庫,并使用以下查詢找出哪個(gè)MySQL線程是罪魁禍?zhǔn)住?/p>
2、定位問題sql
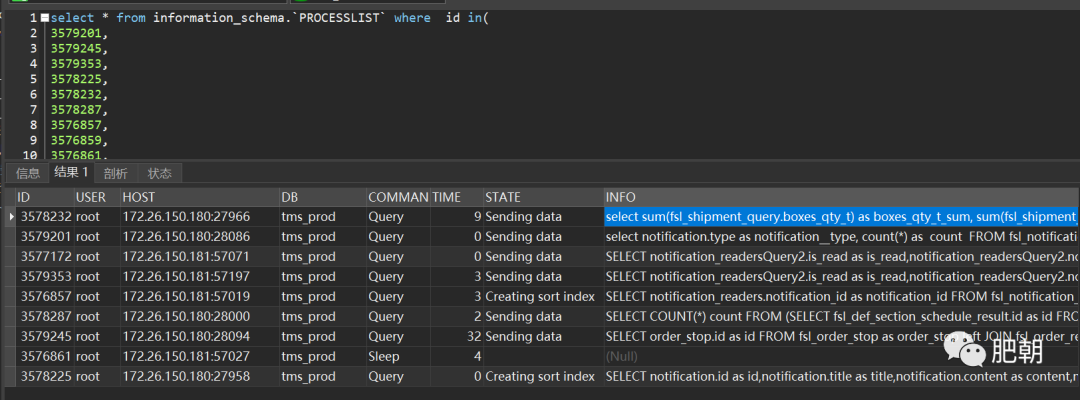
select * from performance_schema.threads where thread_os_id = xx ;
select * from information_schema.`PROCESSLIST` where  id=threads.processlist_id

根據(jù)操作系統(tǒng)id可以到processlist表找到對(duì)應(yīng)的會(huì)話,如下:
3、查看問題sql執(zhí)行計(jì)劃
這里對(duì)應(yīng)看一下執(zhí)行計(jì)劃基本就可以判斷當(dāng)前數(shù)據(jù)庫CPU為什么消耗這么高了...
至于優(yōu)化的點(diǎn)只需要在dock建一個(gè)索引即可,這里就不介紹了。

干貨分享
最近將個(gè)人學(xué)習(xí)筆記整理成冊(cè),使用PDF分享。關(guān)注我,回復(fù)如下代碼,即可獲得百度盤地址,無套路領(lǐng)取!
?001:《Java并發(fā)與高并發(fā)解決方案》學(xué)習(xí)筆記;?002:《深入JVM內(nèi)核——原理、診斷與優(yōu)化》學(xué)習(xí)筆記;?003:《Java面試寶典》?004:《Docker開源書》?005:《Kubernetes開源書》?006:《DDD速成(領(lǐng)域驅(qū)動(dòng)設(shè)計(jì)速成)》?007:全部?008:加技術(shù)群討論
加個(gè)關(guān)注不迷路
喜歡就點(diǎn)個(gè)"在看"唄^_^