
又一款超酷的可視化神器:cutecharts
今天給大家介紹一個很酷的 Python 手繪風(fēng)格可視化神包:cutecharts。和 Matplotlib 、pyecharts 等常見的圖表不同,使用這個包可以生成看起來像手繪的各種圖表,在一些特殊場景下使用效果可能會更好。
安裝
Line——基本示例
def set_options(self,labels: Iterable,x_label: str = "",y_label: str = "",y_tick_count: int = 3,legend_pos: str = "upLeft",colors: Optional[Iterable] = None,font_family: Optional[str] = None,):""":param labels: X 坐標(biāo)軸標(biāo)簽數(shù)據(jù):param x_label: X 坐標(biāo)軸名稱:param y_label: Y 坐標(biāo)軸名稱:param y_tick_count: Y 軸刻度分割段數(shù):param legend_pos: 圖例位置,有 "upLeft", "upRight", "downLeft", "downRight" 可選:param colors: label 顏色數(shù)組:param font_family: CSS font-family"""def add_series(self, name: str, data: Iterable):""":param name: series 名稱:param data: series 數(shù)據(jù)列表"""
基本示例
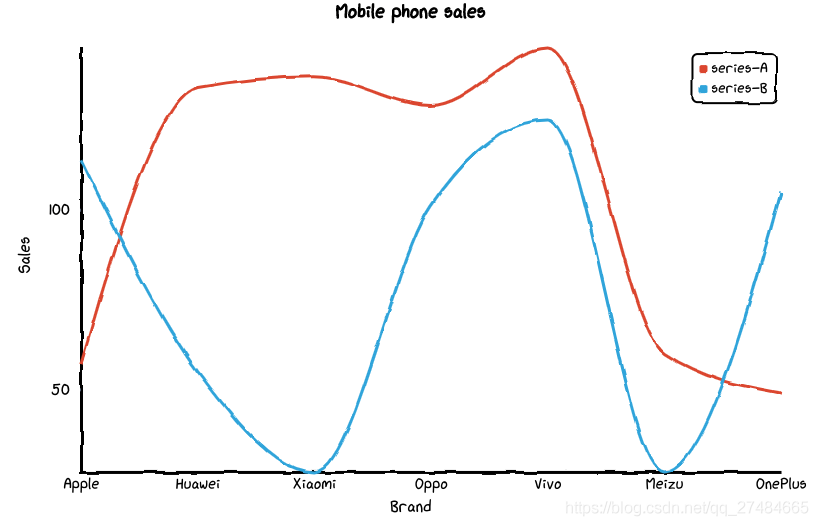
from cutecharts.charts import Line# 虛假數(shù)據(jù)x_data = ['Apple', 'Huawei', 'Xiaomi', 'Oppo', 'Vivo', 'Meizu', 'OnePlus']y_data_1 = [57, 134, 137, 129, 145, 60, 49]y_data_2 = [114, 55, 27, 101, 125, 27, 105]chart = Line("Mobile phone sales")chart.set_options(labels=x_data,x_label="Brand",y_label="Sales",)chart.add_series("series-A", y_data_1)chart.add_series("series-B", y_data_2)chart.render_notebook()
修改圖例位置
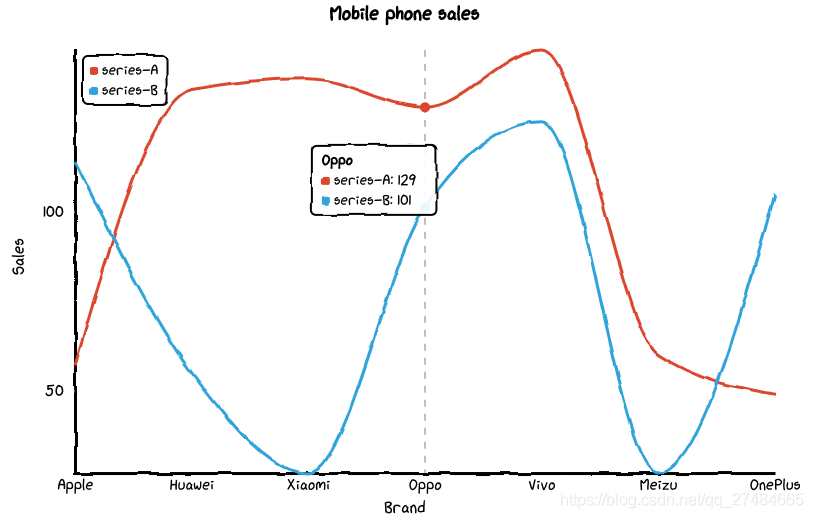
from cutecharts.charts import Line# 虛假數(shù)據(jù)x_data = ['Apple', 'Huawei', 'Xiaomi', 'Oppo', 'Vivo', 'Meizu', 'OnePlus']y_data_1 = [57, 134, 137, 129, 145, 60, 49]y_data_2 = [114, 55, 27, 101, 125, 27, 105]chart = Line("Mobile phone sales")chart.set_options(labels=x_data,x_label="Brand",y_label="Sales",legend_pos="upRight")chart.add_series("series-A", y_data_1)chart.add_series("series-B", y_data_2)chart.render_notebook()
Bar——基本示例
def set_options(self,labels: Iterable,x_label: str = "",y_label: str = "",y_tick_count: int = 3,colors: Optional[Iterable] = None,font_family: Optional[str] = None,):""":param labels: X 坐標(biāo)軸標(biāo)簽數(shù)據(jù):param x_label: X 坐標(biāo)軸名稱:param y_label: Y 坐標(biāo)軸名稱:param y_tick_count: Y 軸刻度分割段數(shù):param colors: label 顏色數(shù)組:param font_family: CSS font-family"""def add_series(self, name: str, data: Iterable):""":param name: series 名稱:param data: series 數(shù)據(jù)列表"""
基本示例
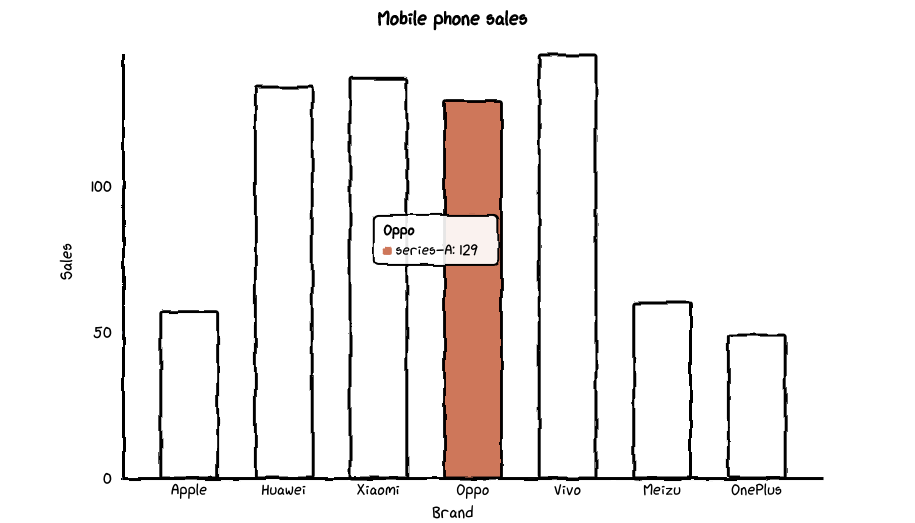
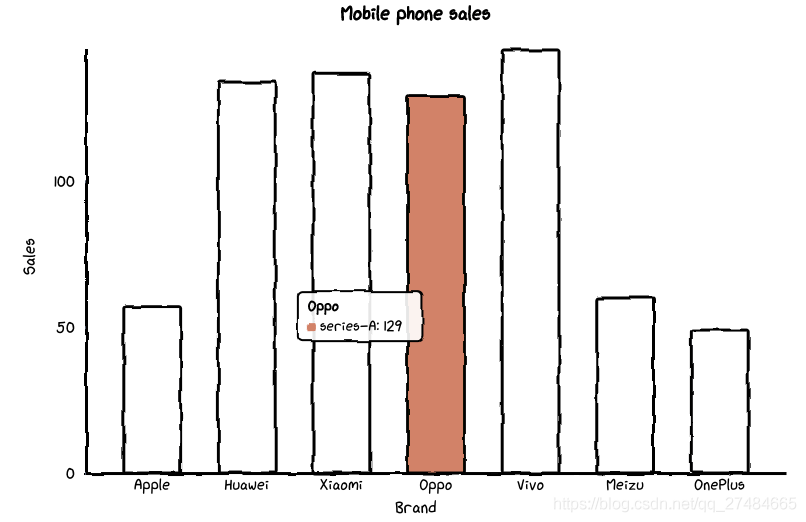
# 虛假數(shù)據(jù)x_data = ['Apple', 'Huawei', 'Xiaomi', 'Oppo', 'Vivo', 'Meizu', 'OnePlus']y_data = [57, 134, 137, 129, 145, 60, 49]chart = Bar("Mobile phone sales")chart.set_options(labels=x_data,x_label="Brand",y_label="Sales",colors=Faker.colors)chart.add_series("series-A", y_data)chart.render_notebook()
Pie——基本示例
def set_options(self,labels: Iterable,inner_radius: float = 0.5,legend_pos: str = "upLeft",colors: Optional[Iterable] = None,font_family: Optional[str] = None,):""":param labels: 數(shù)據(jù)標(biāo)簽列表:param inner_radius: Pie 圖半徑:param legend_pos: 圖例位置,有 "upLeft", "upRight", "downLeft", "downRight" 可選:param colors: label 顏色數(shù)組:param font_family: CSS font-family"""def add_series(self, data: Iterable):""":param data: series 數(shù)據(jù)列表"""
基本示例
# 虛假數(shù)據(jù)x_data = ['Apple', 'Huawei', 'Xiaomi', 'Oppo', 'Vivo', 'Meizu', 'OnePlus']y_data = [57, 134, 137, 129, 145, 60, 49]chart = Pie("Mobile phone sales")chart.set_options(labels=x_data,colors=Faker.colors)chart.add_series(y_data)chart.render_notebook()
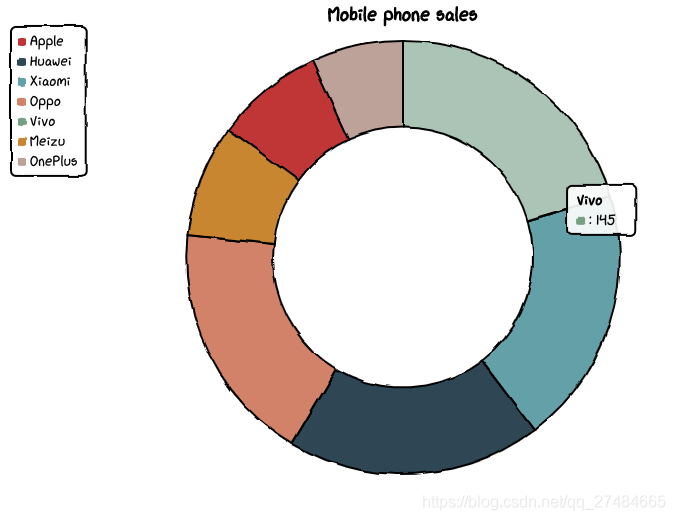
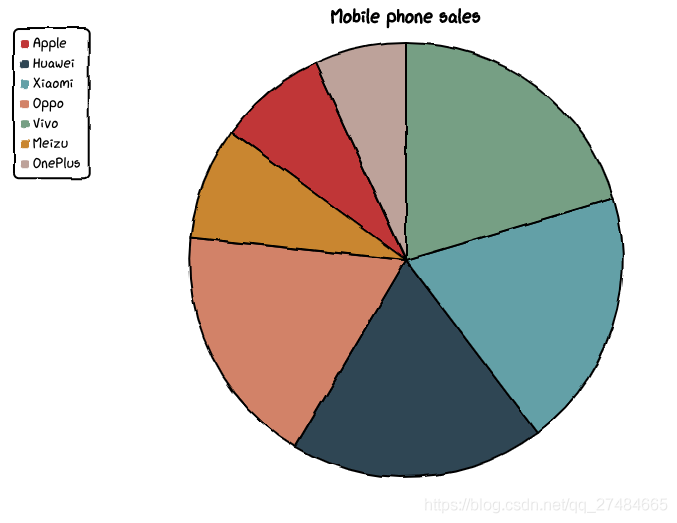
修改內(nèi)圈半徑
# 虛假數(shù)據(jù)x_data = ['Apple', 'Huawei', 'Xiaomi', 'Oppo', 'Vivo', 'Meizu', 'OnePlus']y_data = [57, 134, 137, 129, 145, 60, 49]chart = Pie("Mobile phone sales")chart.set_options(labels=x_data,inner_radius=0,colors=Faker.colors)chart.add_series(y_data)chart.render_notebook()
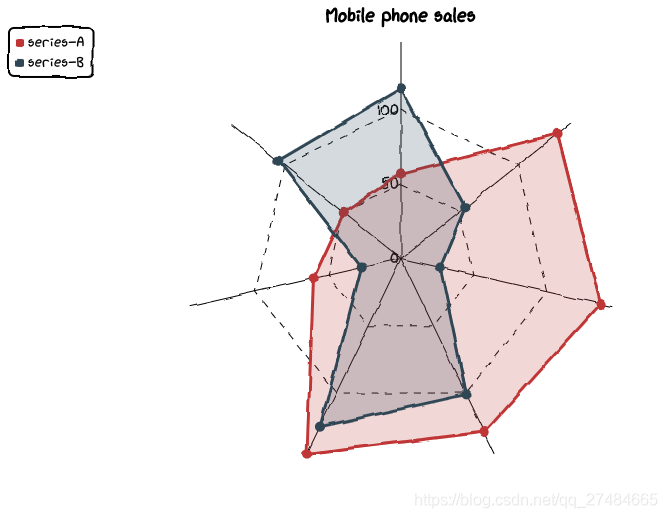
Radar——基本示例
def set_options(self,labels: Iterable,is_show_label: bool = True,is_show_legend: bool = True,tick_count: int = 3,legend_pos: str = "upLeft",colors: Optional[Iterable] = None,font_family: Optional[str] = None,):""":param labels: 數(shù)據(jù)標(biāo)簽列表:param is_show_label: 是否顯示標(biāo)簽:param is_show_legend: 是否顯示圖例:param tick_count: 坐標(biāo)系分割刻度:param legend_pos: 圖例位置,有 "upLeft", "upRight", "downLeft", "downRight" 可選:param colors: label 顏色數(shù)組:param font_family: CSS font-family"""def add_series(self, name: str, data: Iterable):""":param name: series 名稱:param data: series 數(shù)據(jù)列表"""
基本示例
# 虛假數(shù)據(jù)x_data = ['Apple', 'Huawei', 'Xiaomi', 'Oppo', 'Vivo', 'Meizu', 'OnePlus']y_data_1 = [57, 134, 137, 129, 145, 60, 49]y_data_2 = [114, 55, 27, 101, 125, 27, 105]chart = Radar("Mobile phone sales")chart.set_options(labels=x_data,is_show_legend=True,colors=Faker.colors)chart.add_series("series-A", y_data_1)chart.add_series("series-B", y_data_2)chart.render_notebook()
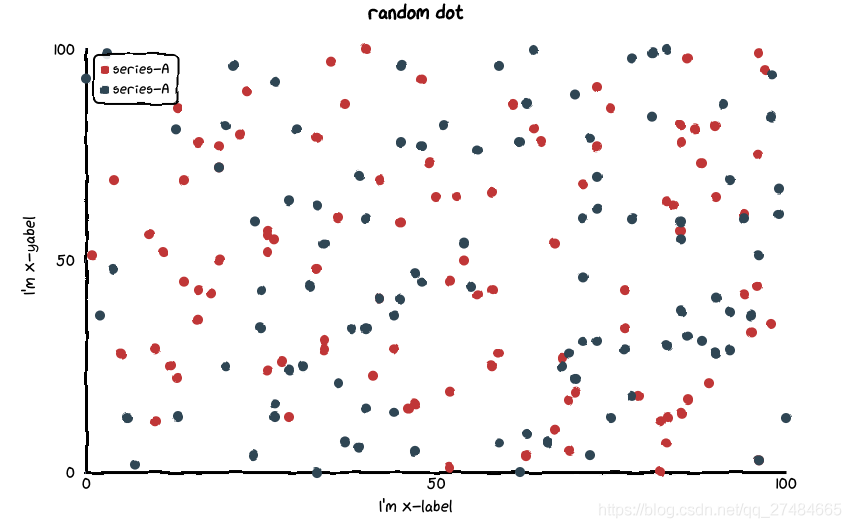
Scatter——基本示例
def set_options(self,x_label: str = "",y_label: str = "",x_tick_count: int = 3,y_tick_count: int = 3,is_show_line: bool = False,dot_size: int = 1,time_format: Optional[str] = None,legend_pos: str = "upLeft",colors: Optional[Iterable] = None,font_family: Optional[str] = None,):""":param x_label: X 坐標(biāo)軸名稱:param y_label: Y 坐標(biāo)軸名稱:param x_tick_count: X 軸刻度分割段數(shù):param y_tick_count: Y 軸刻度分割段數(shù):param is_show_line: 是否將散點連成線:param dot_size: 散點大小:param time_format: 日期格式:param legend_pos: 圖例位置,有 "upLeft", "upRight", "downLeft", "downRight" 可選:param colors: label 顏色數(shù)組:param font_family: CSS font-family"""def add_series(self, name: str, data: Iterable):""":param name: series 名稱:param data: series 數(shù)據(jù)列表,[(x1, y1), (x2, y2)]"""
基本示例
data_1 = [(random.randint(0, 100), random.randint(0, 100)) for _ in range(100)]data_2 = [(random.randint(0, 100), random.randint(0, 100)) for _ in range(100)]chart = Scatter("random dot")chart.set_options(x_label = "I'm x-label",y_label = "I'm x-yabel",x_tick_count = 3,y_tick_count = 3,is_show_line = False,dot_size = 1,legend_pos = "upLeft",colors=Faker.colors)chart.add_series("series-A", data_1)chart.add_series("series-A", data_2)chart.render_notebook()
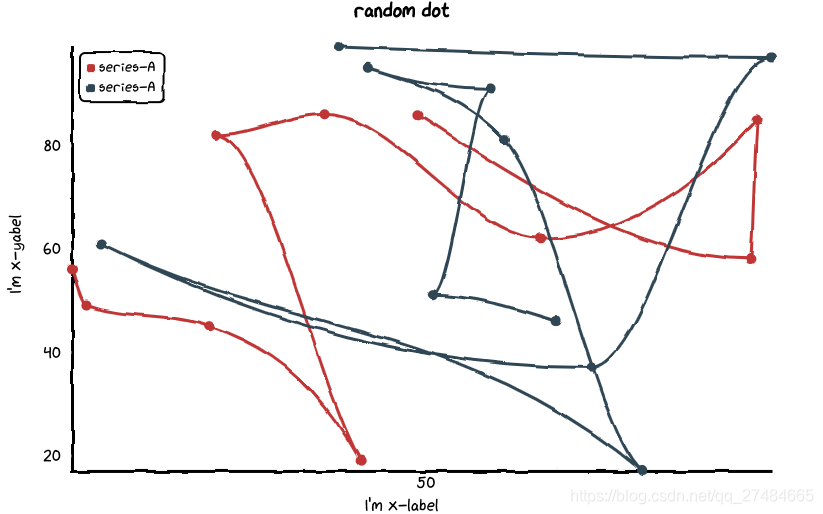
點連線
data_1 = [(random.randint(0, 100), random.randint(0, 100)) for _ in range(10)]data_2 = [(random.randint(0, 100), random.randint(0, 100)) for _ in range(10)]chart = Scatter("random dot")chart.set_options(x_label = "I'm x-label",y_label = "I'm x-yabel",x_tick_count = 3,y_tick_count = 3,is_show_line = True,dot_size = 1,legend_pos = "upLeft",colors=Faker.colors)chart.add_series("series-A", data_1)chart.add_series("series-A", data_2)chart.render_notebook()
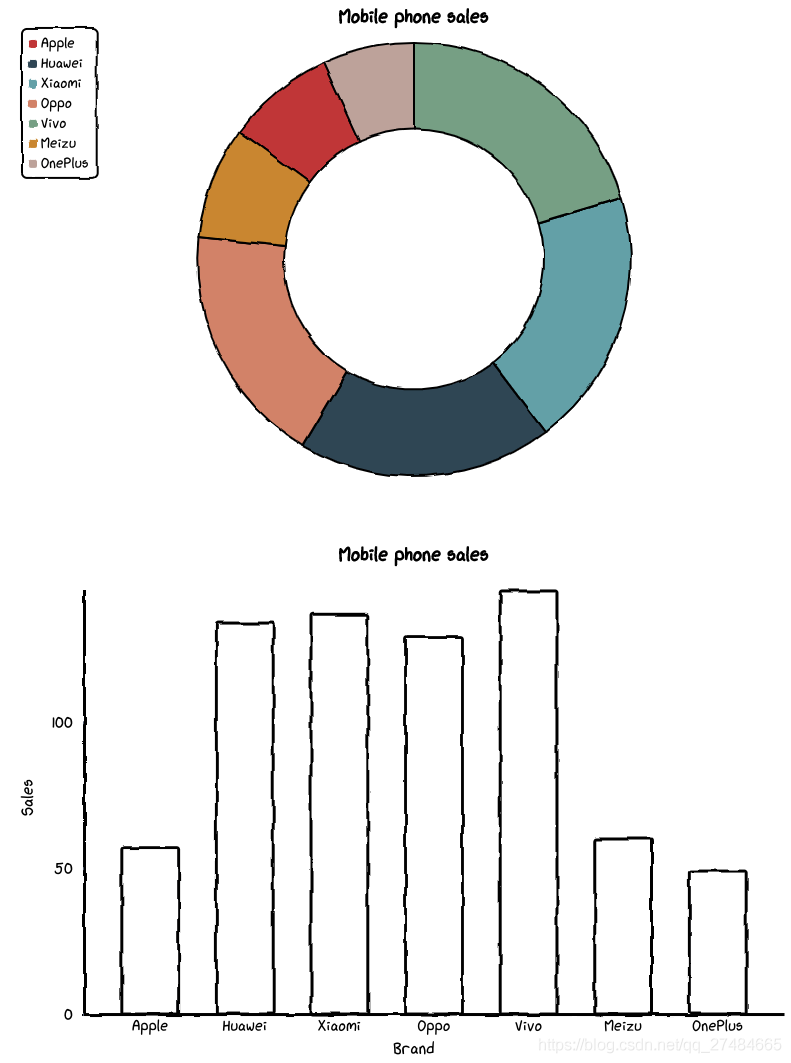
組合圖表——Page
# 虛假數(shù)據(jù)x_data = ['Apple', 'Huawei', 'Xiaomi', 'Oppo', 'Vivo', 'Meizu', 'OnePlus']y_data = [57, 134, 137, 129, 145, 60, 49]chart_1 = Pie("Mobile phone sales")chart_1.set_options(labels=x_data,inner_radius=0.6,colors=Faker.colors)chart_1.add_series(y_data)chart_2 = Bar("Mobile phone sales")chart_2.set_options(labels=x_data,x_label="Brand",y_label="Sales",colors=Faker.colors)chart_2.add_series("series-A", y_data)page = Page()page.add(chart_1, chart_2)page.render_notebook()
原文鏈接:https://blog.csdn.net/qq_27484665/article/details/115472329
- EOF -
回復(fù)關(guān)鍵字“簡明python ”,立即獲取入門必備書籍《簡明python教程》電子版
回復(fù)關(guān)鍵字“爬蟲”,立即獲取爬蟲學(xué)習(xí)資料
點擊關(guān)注【python入門與進(jìn)階】,閱讀更多精彩內(nèi)容 ?????? 推薦

評論
圖片
表情