
Prometheus 監(jiān)控服務(wù)端口、網(wǎng)站狀態(tài)等(黑盒監(jiān)測)
1、blackbox_exporter介紹
blackbox_exporter是Prometheus 官方提供的 exporter 之一,可以提供 http、dns、tcp、icmp 的監(jiān)控?cái)?shù)據(jù)采集。
blackbox_exporter 應(yīng)用場景:
HTTP 測試:?定義 Request Header 信息,判斷 Http status / Http Respones Header / Http Body 內(nèi)容
TCP 測試:業(yè)務(wù)組件端口狀態(tài)監(jiān)聽,?應(yīng)用層協(xié)議定義與監(jiān)聽
ICMP 測試:主機(jī)探活機(jī)制
POST 測試:接口聯(lián)通性
SSL 證書過期時(shí)間
2、安裝blackbox_exporter
# wget https://github.com/prometheus/blackbox_exporter/releases/download/v0.16.0/blackbox_exporter-0.16.0.linux-amd64.tar.gz

#?tar xf blackbox_exporter-0.16.0.linux-amd64.tar.gz -C /usr/local/
#?ln -s /usr/local/blackbox_exporter-0.16.0.linux-amd64/ /usr/local/blackbox_exporter

#?使用systemd管理blackbox_exporter服務(wù)
#?vim /usr/lib/systemd/system/blackbox_exporter.service
[Unit]
Description=blackbox_exporter
After=network.target

[Service]
User=root
Type=simple
ExecStart=/usr/local/blackbox_exporter/blackbox_exporter --config.file=/usr/local/blackbox_exporter/blackbox.yml
Restart=on-failure

[Install]
WantedBy=multi-user.target

#?systemctl daemon-reload
#?systemctl start blackbox_exporter
#?systemctl enable?blackbox_exporter
3、配置Prometheus采集數(shù)據(jù)
# cd?/usr/local/prometheus
# vim?prometheus.yml
global:
??scrape_interval:?15s
??evaluation_interval:?15s
scrape_configs:
??- job_name: 'prometheus'
????static_configs:
????- targets:?['localhost:9090']
? ?# 網(wǎng)站監(jiān)控
??- job_name: 'http_status'
????metrics_path: /probe
????params:
??????module: [http_2xx]
????static_configs:
??????- targets:?['http://www.baidu.com']
????????labels:
??????????instance: http_status
??????????group: web
????relabel_configs:
??????- source_labels:?[__address__]
????????target_label:?__param_target
??????- target_label:?__address__
????????replacement:?192.168.31.63:9115
? ?# ping 檢測
??- job_name: 'ping_status'
????metrics_path: /probe
????params:
??????module: [icmp]
????static_configs:
??????- targets:?['192.168.31.62']
????????labels:
??????????instance: 'ping_status'
??????????group: 'icmp'
????relabel_configs:
??????- source_labels:?[__address__]
????????target_label:?__param_target
??????- target_label:?__address__
????????replacement:?192.168.31.63:9115
? ?# 端口監(jiān)控
??- job_name: 'port_status'
????metrics_path: /probe
????params:
??????module: [tcp_connect]
????static_configs:
??????- targets:?['192.168.31.62:80']
????????labels:
??????????instance: 'port_status'
??????????group: 'port'
????relabel_configs:
??????- source_labels:?[__address__]
????????target_label:?__param_target
??????- target_label:?__address__
????????replacement:?192.168.31.63:9115
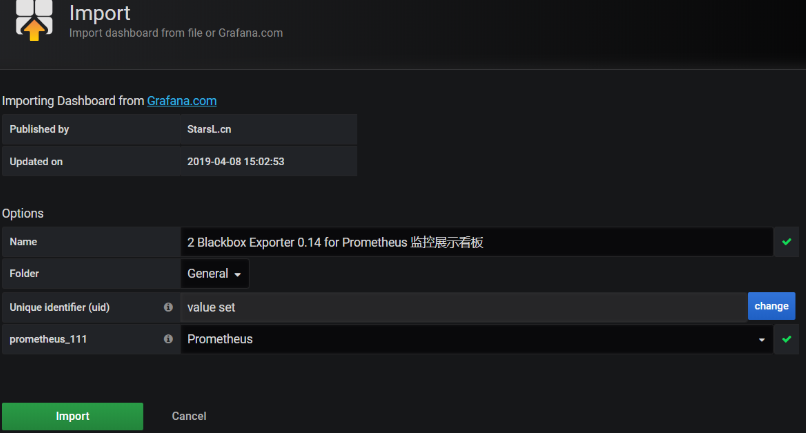
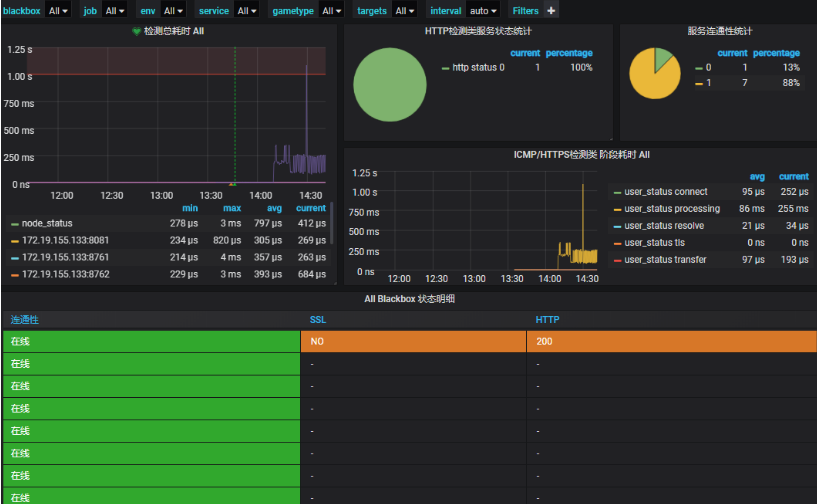
# systemctl restart prometheus4、Grafana可視化展示
需要安裝餅狀態(tài)圖插件,安裝后重啟grafana。
grafana-cli plugins install?grafana-piechart-panel
systemctl restart grafana-server.service
此模板ID為9965,數(shù)據(jù)源選擇Prometheus:
- END -
?推薦閱讀? kubevirt在360的探索之路(K8s接管虛擬化),漲姿勢~ 超詳細(xì)!Kubernetes 學(xué)習(xí)筆記總結(jié) 基于 Nginx+lua+Memcache 實(shí)現(xiàn)灰度發(fā)布 Kubernetes生產(chǎn)環(huán)境最佳實(shí)踐 一文搞懂藍(lán)綠發(fā)布、灰度發(fā)布和滾動發(fā)布 高性能 Nginx HTTPS 調(diào)優(yōu) - 如何為 HTTPS 提速 30% 記一次 Linux服務(wù)器被入侵后的排查思路
點(diǎn)亮,服務(wù)器三年不宕機(jī)

評論
圖片
表情