
【W(wǎng)eb技術(shù)】861- 4000字帶你了解 Web 前端監(jiān)控


前言:為什么需要監(jiān)控
web 的性能一定程度上影響了用戶留存率,Google DoubleClick 研究表明:如果一個移動端頁面加載時長超過 3 秒,用戶就會放棄而離開。BBC 發(fā)現(xiàn)網(wǎng)頁加載時長每增加 1 秒,用戶就會流失 10%。

RAIL?模型來衡量應(yīng)用性能,即:Response、Animation、Idle、Load,分別代表著 web 應(yīng)用生命周期的四個不同方面。并指出最好的性能指標(biāo)是:100ms 內(nèi)響應(yīng)用戶輸入;動畫或者滾動需在 10ms 內(nèi)產(chǎn)生下一幀;最大化空閑時間;頁面加載時長不超過 5 秒。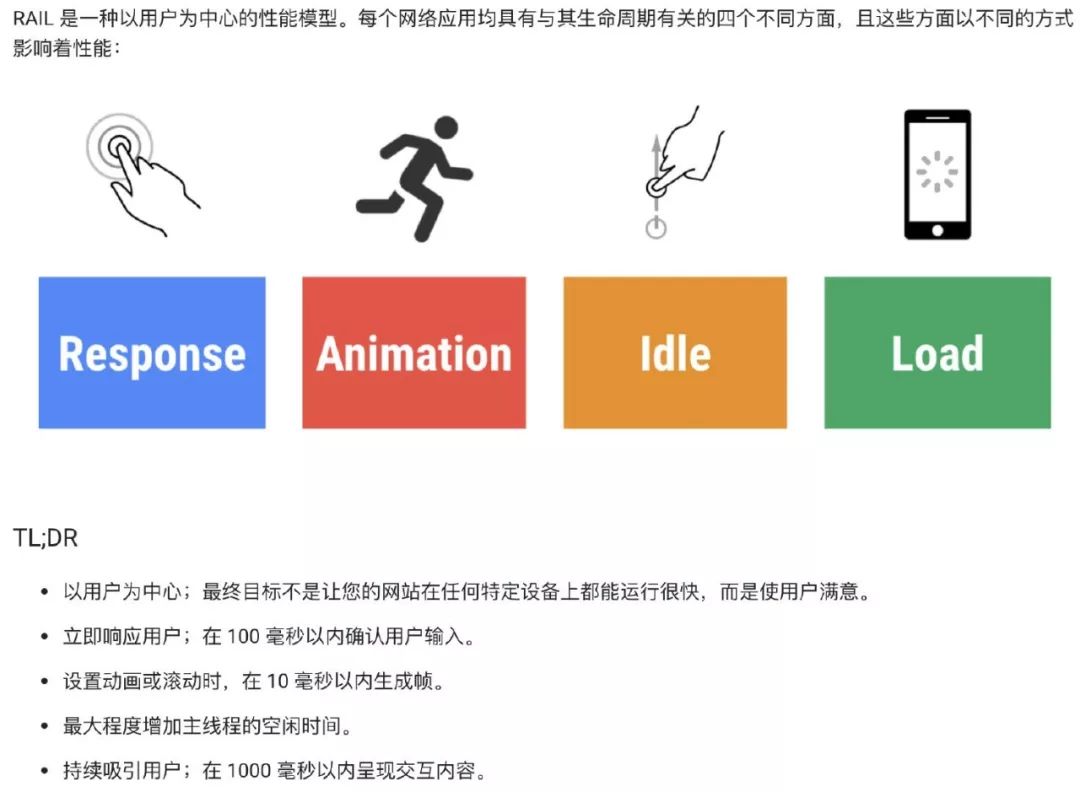
響應(yīng)速度:頁面初始訪問速度 + 交互響應(yīng)速度 頁面穩(wěn)定性:頁面出錯率 外部服務(wù)調(diào)用:網(wǎng)絡(luò)請求訪問速度
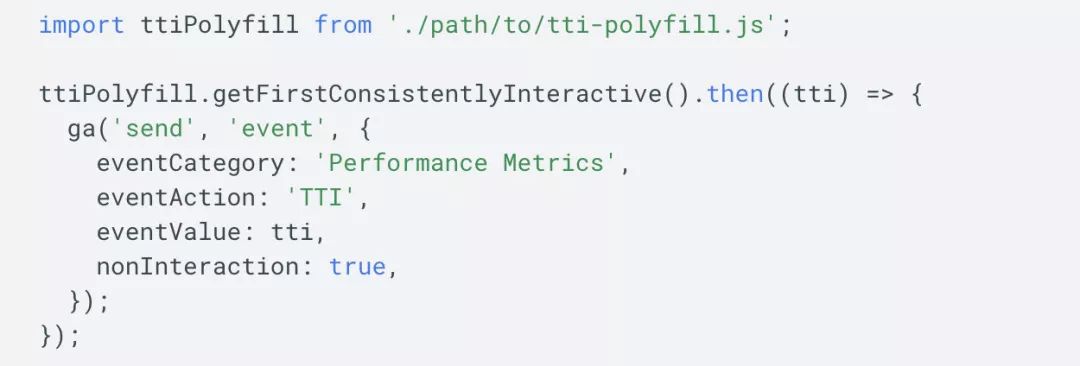
1.頁面訪問速度:白屏、首屏?xí)r間、可交互時間
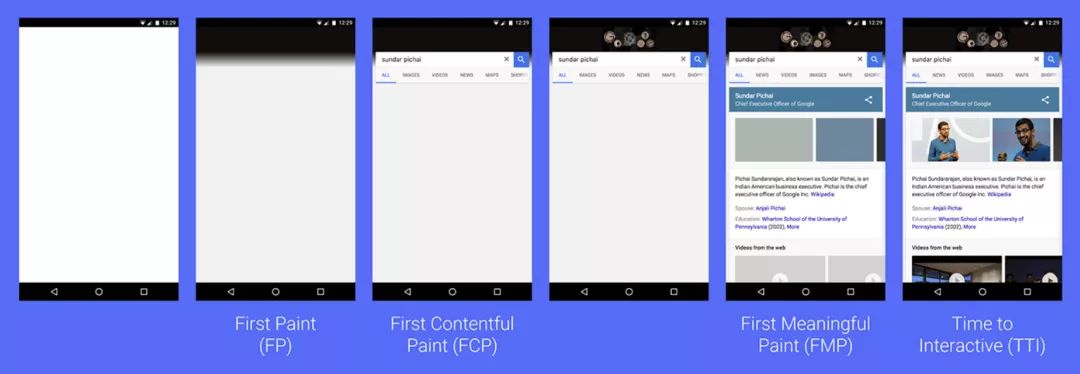
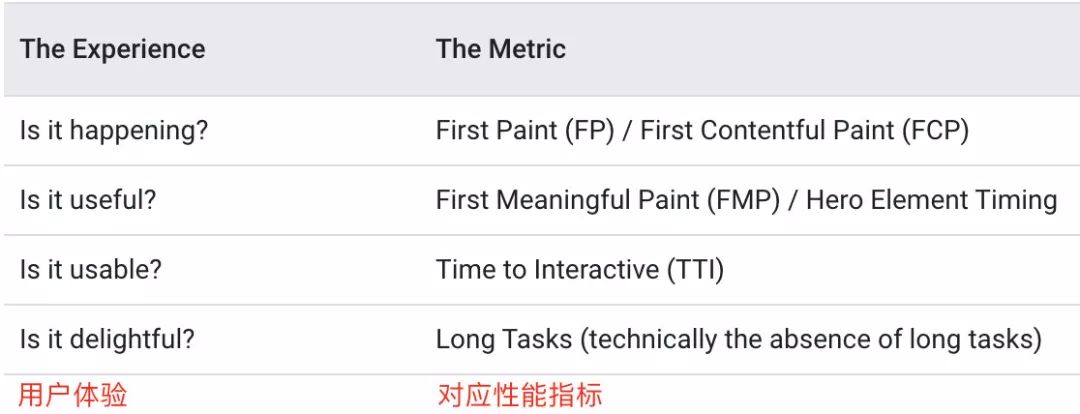
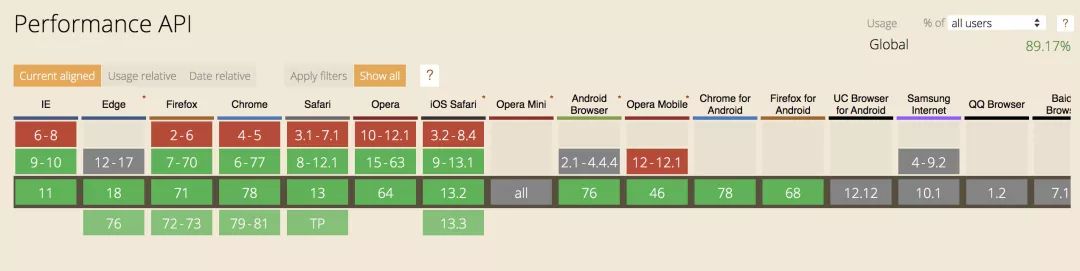
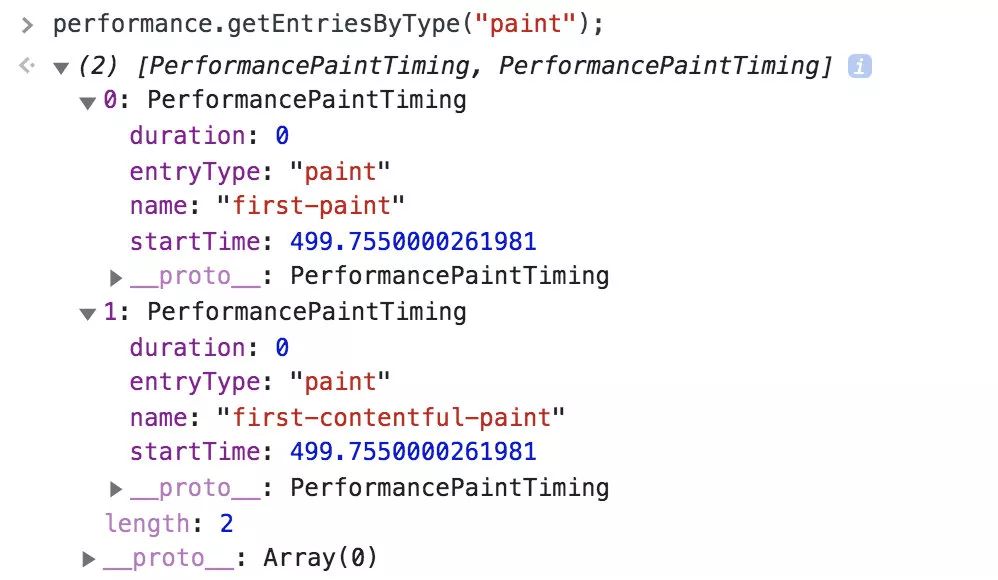
1)first paint (FP) and first contentful paint (FCP)
這兩個指標(biāo)瀏覽器已經(jīng)標(biāo)準(zhǔn)化了,從 performance 的?
The Paint Timing API?可以獲取到,一般來說兩個時間相同,但也有情況下兩者不同。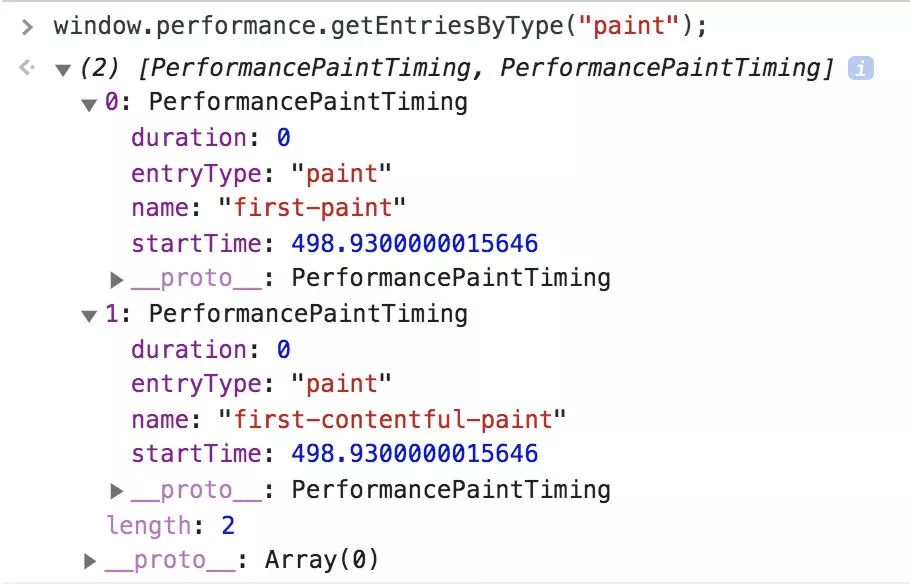
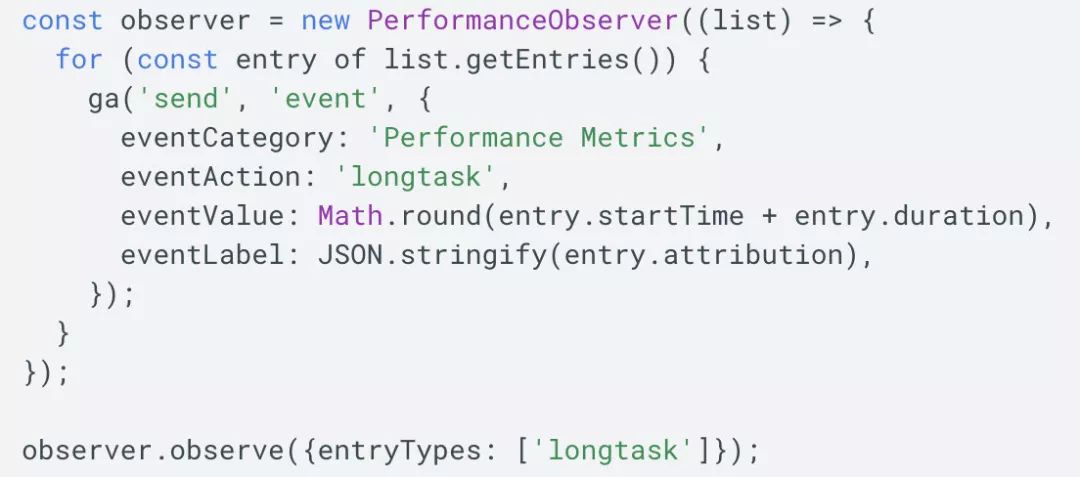
我們假設(shè)當(dāng)一個網(wǎng)頁的 DOM 結(jié)構(gòu)發(fā)生劇烈的變化的時候,就是這個網(wǎng)頁主要內(nèi)容出現(xiàn)的時候,那么在這樣的一個時間點上,就是首次有意義的渲染。這個指標(biāo)瀏覽器還沒有規(guī)范,畢竟很難統(tǒng)一一個標(biāo)準(zhǔn)來定義網(wǎng)站的主體內(nèi)容。
first meaningful paint:https://docs.google.com/document/d/1BR94tJdZLsin5poeet0XoTW60M0SjvOJQttKT-JK8HI/view
2.頁面穩(wěn)定性:頁面出錯情況
資源加載錯誤 JS 執(zhí)行報錯
3.外部服務(wù)調(diào)用
CGI 耗時 CGI 成功率 CDN 資源耗時 監(jiān)控的分類?
合成監(jiān)控
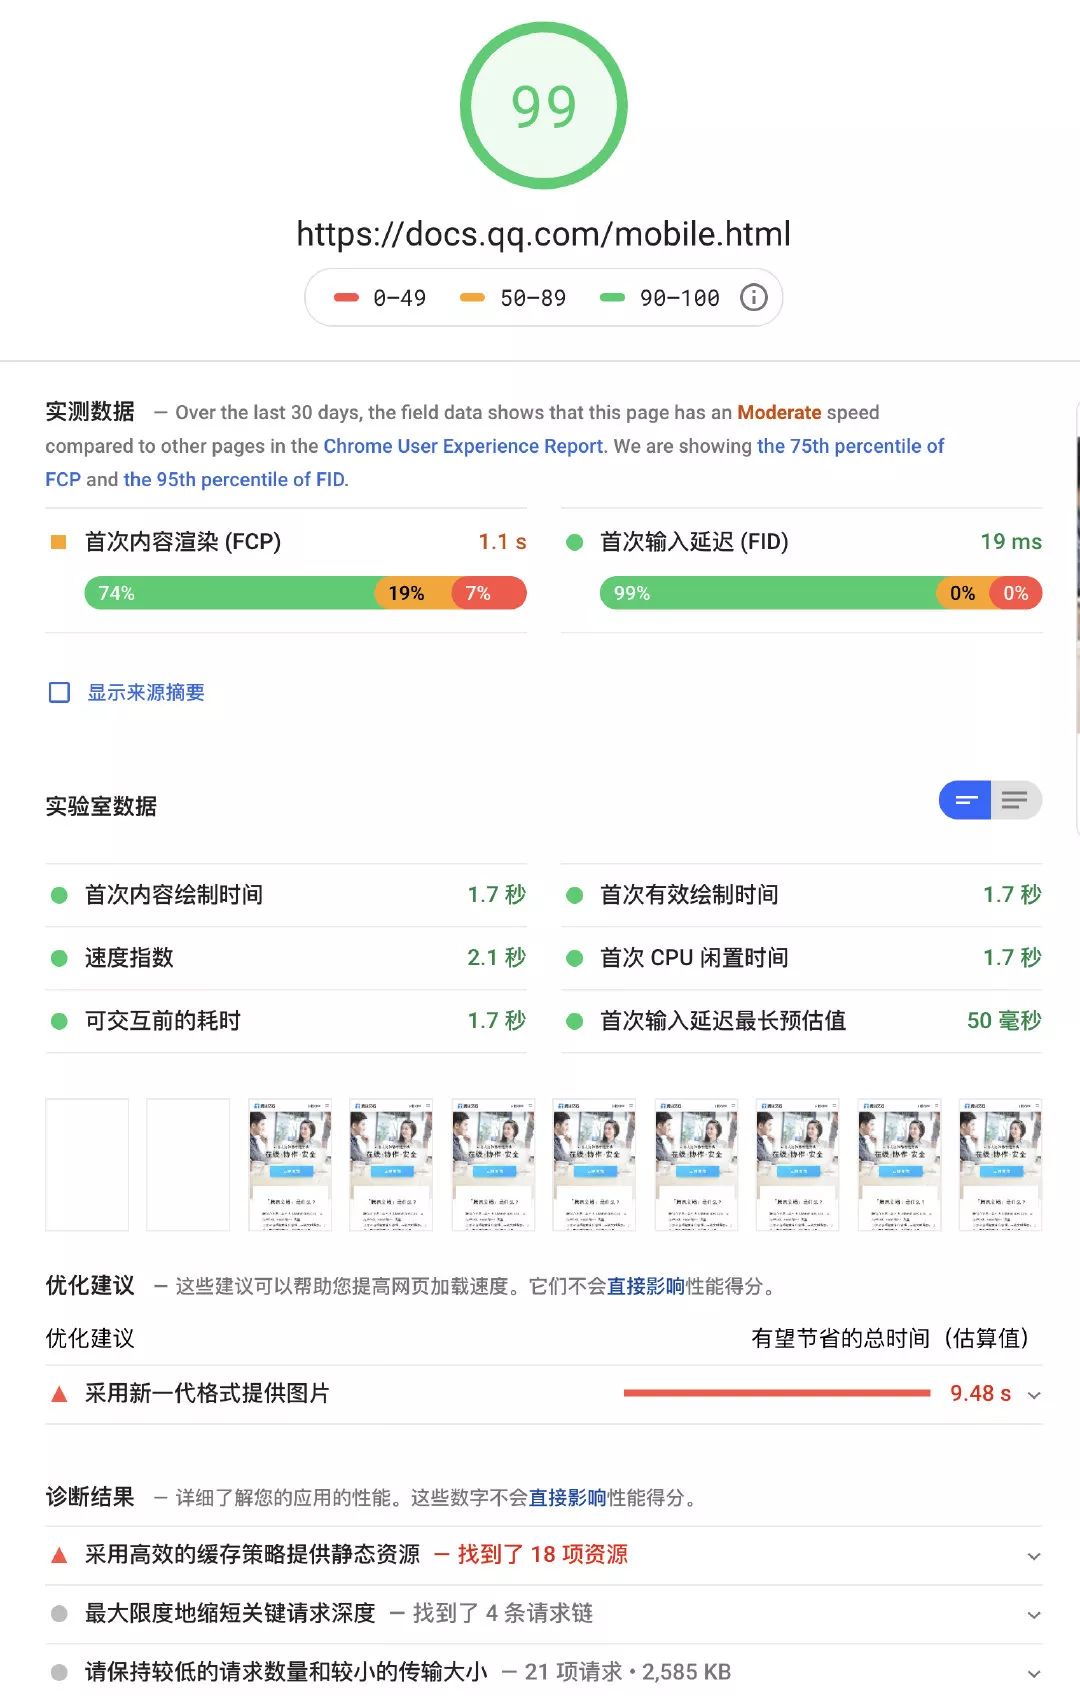
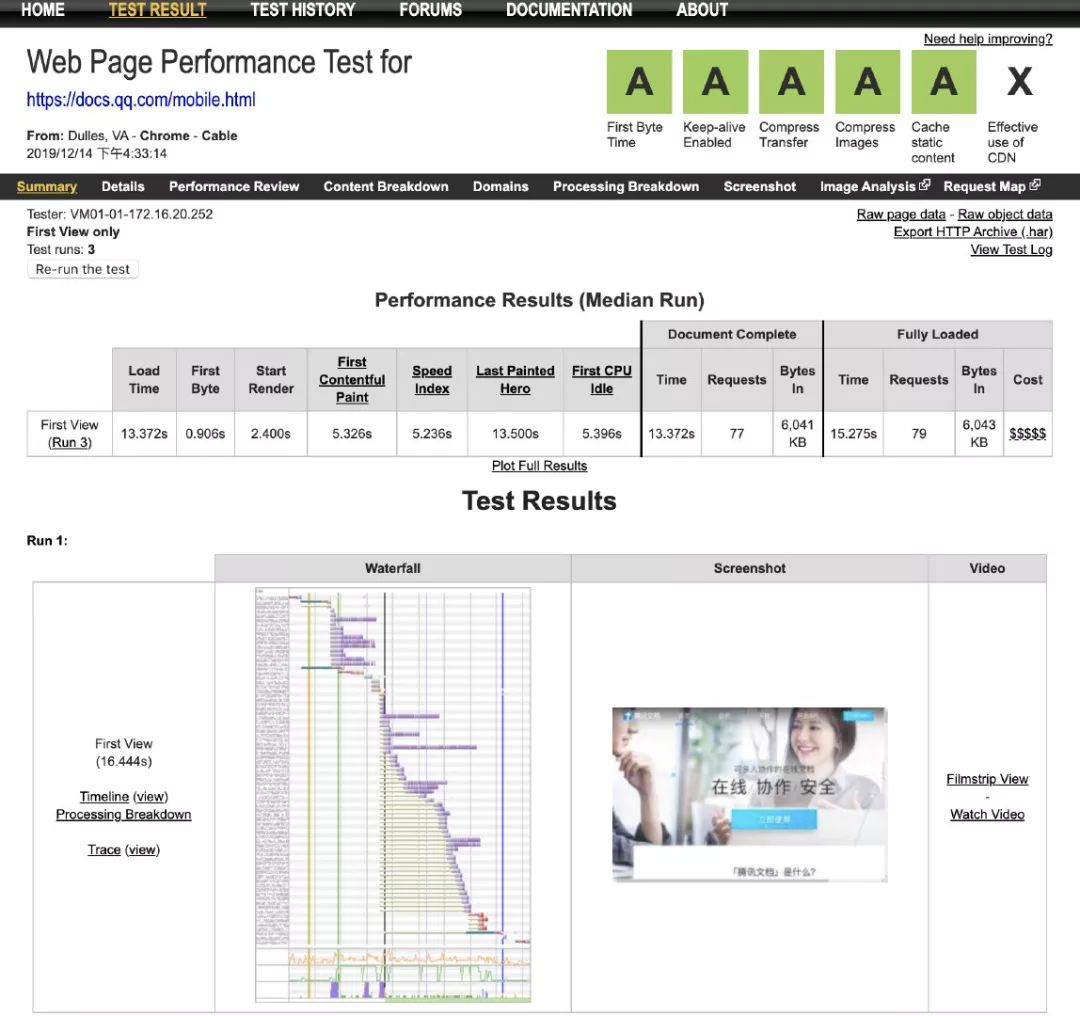
Lighthouse、PageSpeed、WebPageTest、Pingdom、PhantomJS?等。Lighthouse?是 google 一個開源的自動化工具,運行?Lighthouse?的方式有兩種:一種是作為 Chrome 擴展程序運行;另一種作為命令行工具運行。Chrome 擴展程序提供了一個對用戶更友好的界面,方便讀取報告。通過命令行工具可以將 Lighthouse 集成到持續(xù)集成系統(tǒng)。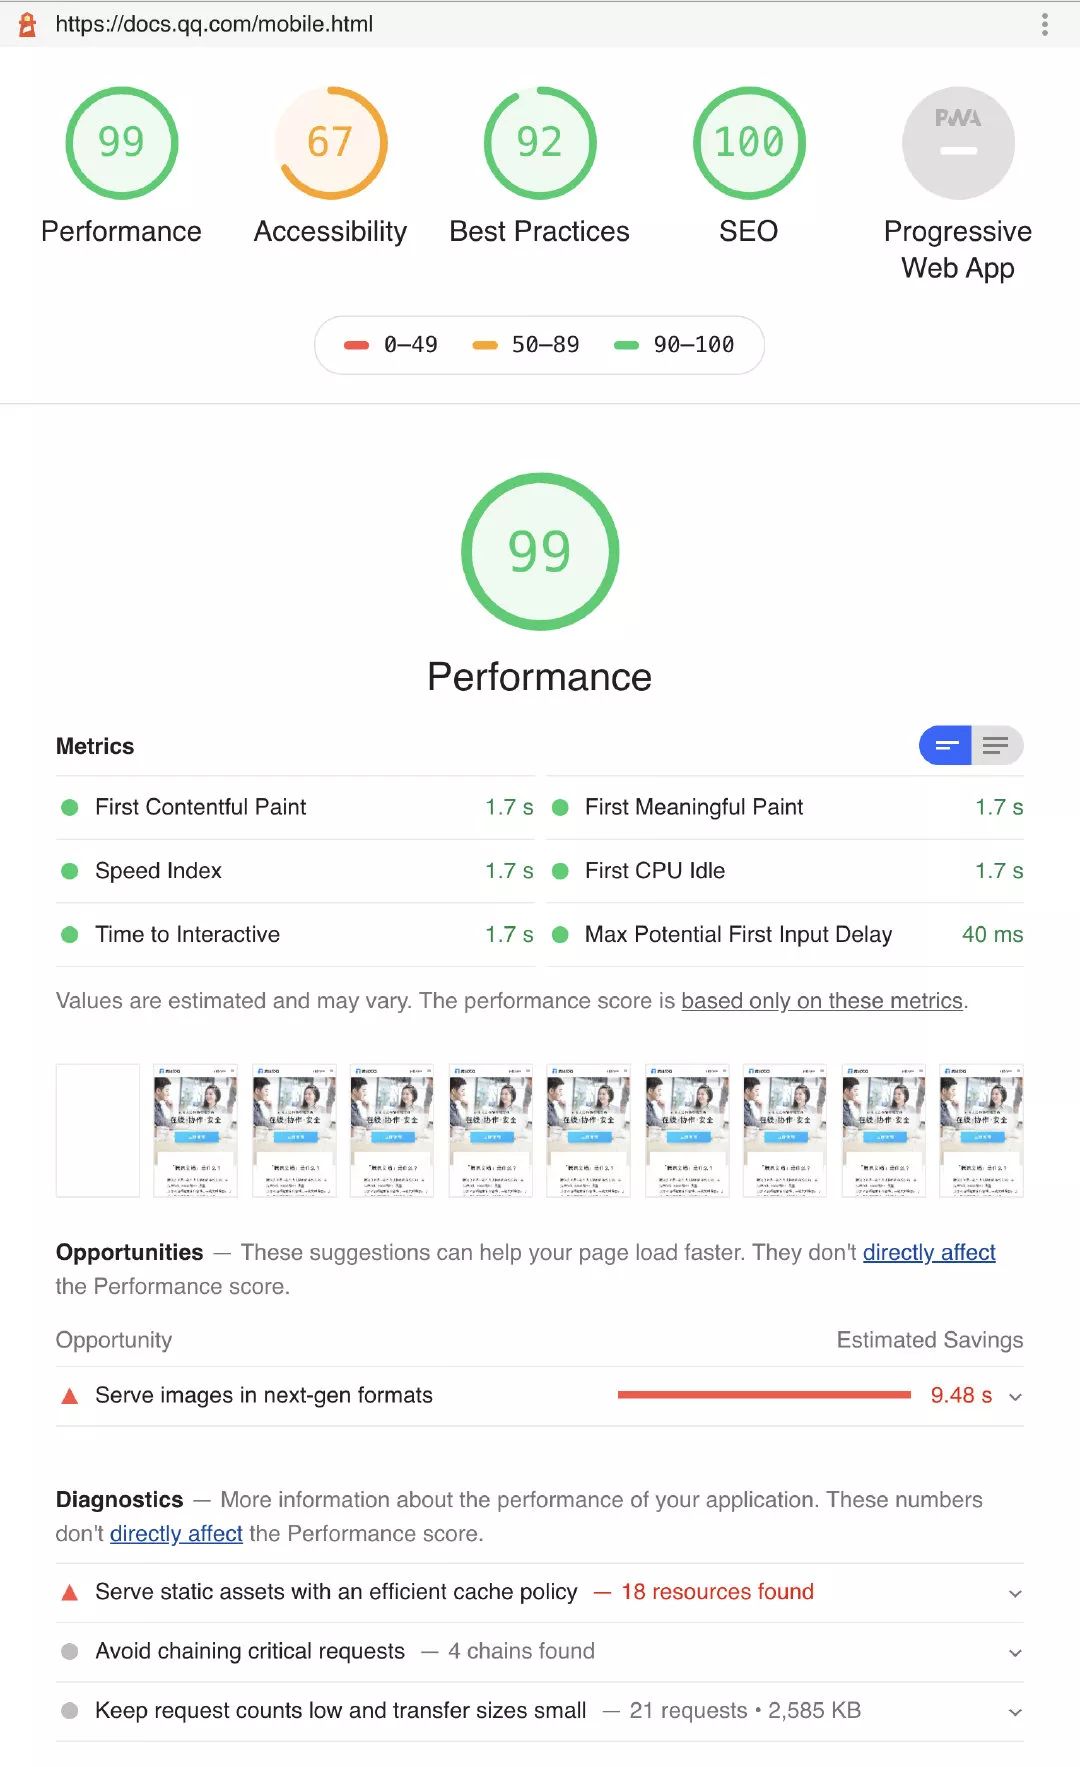
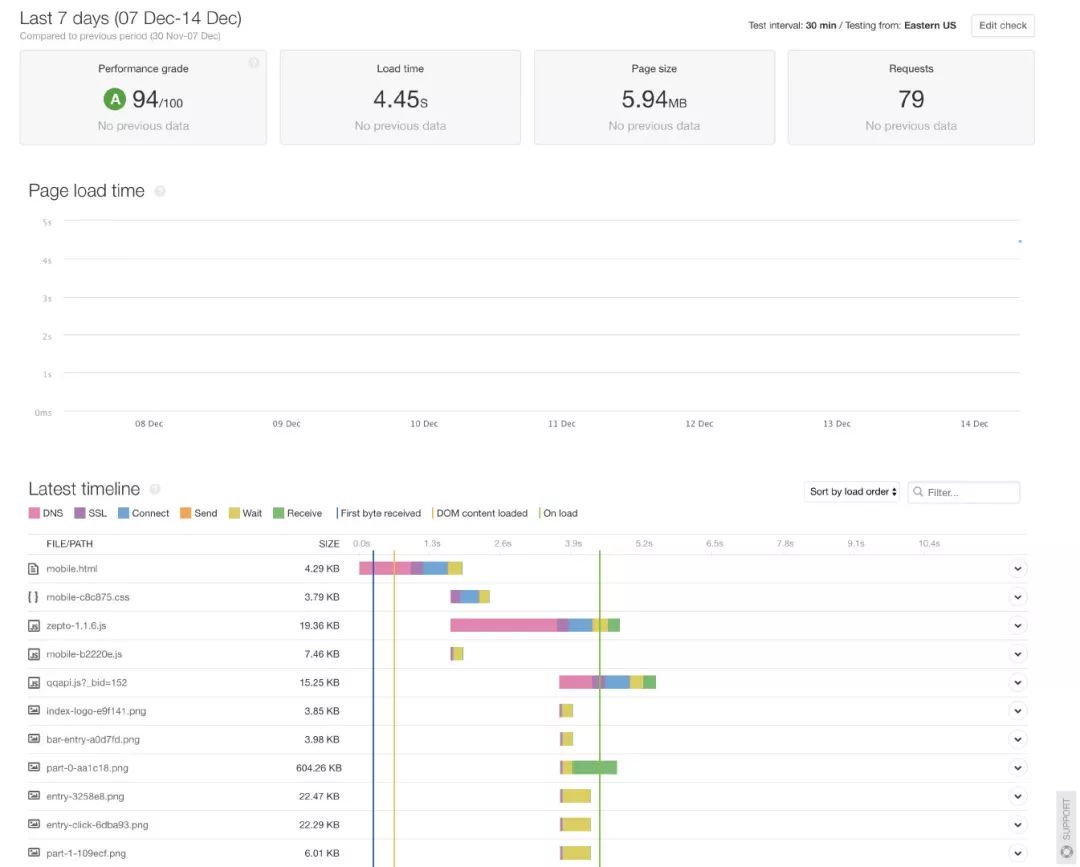
合成監(jiān)控方式的優(yōu)缺點:
無侵入性。 簡單快捷。缺點: 不是真實的用戶訪問情況,只是模擬的。 沒法考慮到登錄的情況,對于需要登錄的頁面就無法監(jiān)控到。
真實用戶監(jiān)控
FrontJs、oneapm、Datadog?等。
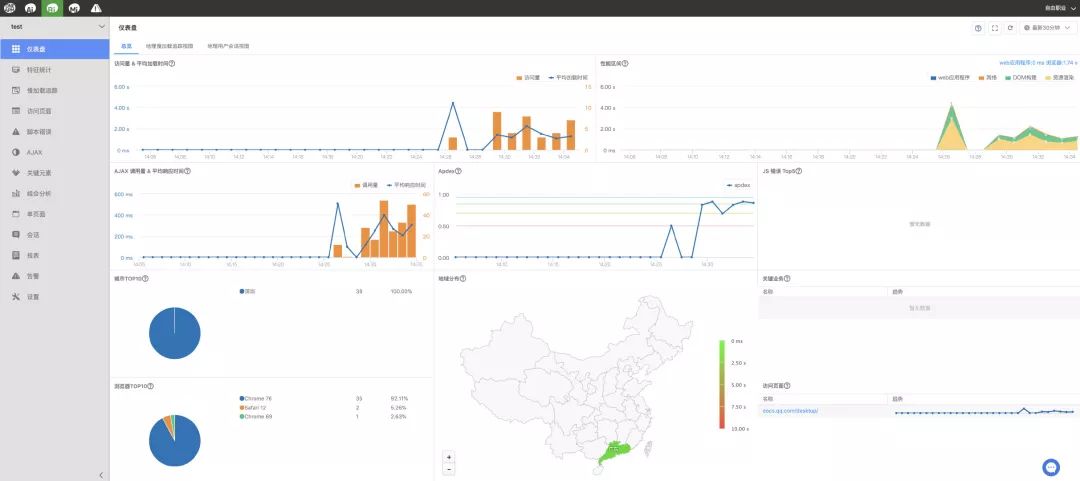
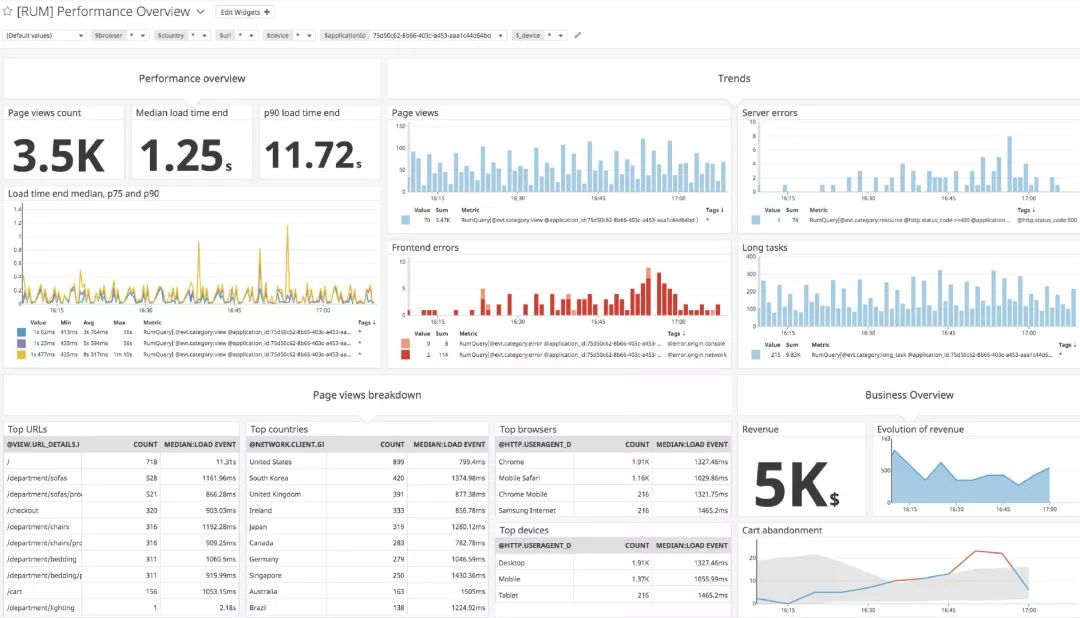
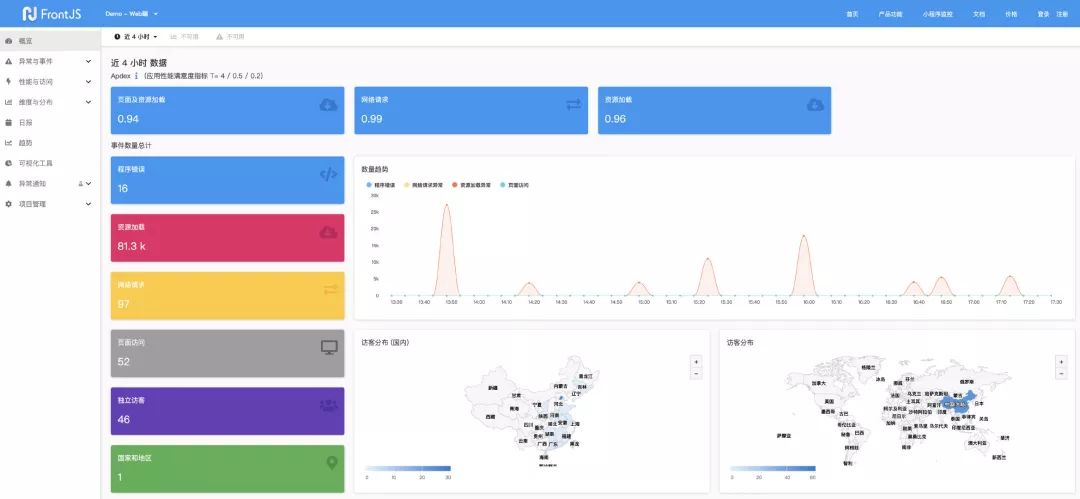
是真實用戶訪問情況。 可以觀察歷史性能趨勢。 有一些額外的功能:報表推送、監(jiān)控告警等等。缺點: 有侵入性,會一定程度上響應(yīng) web 性能。

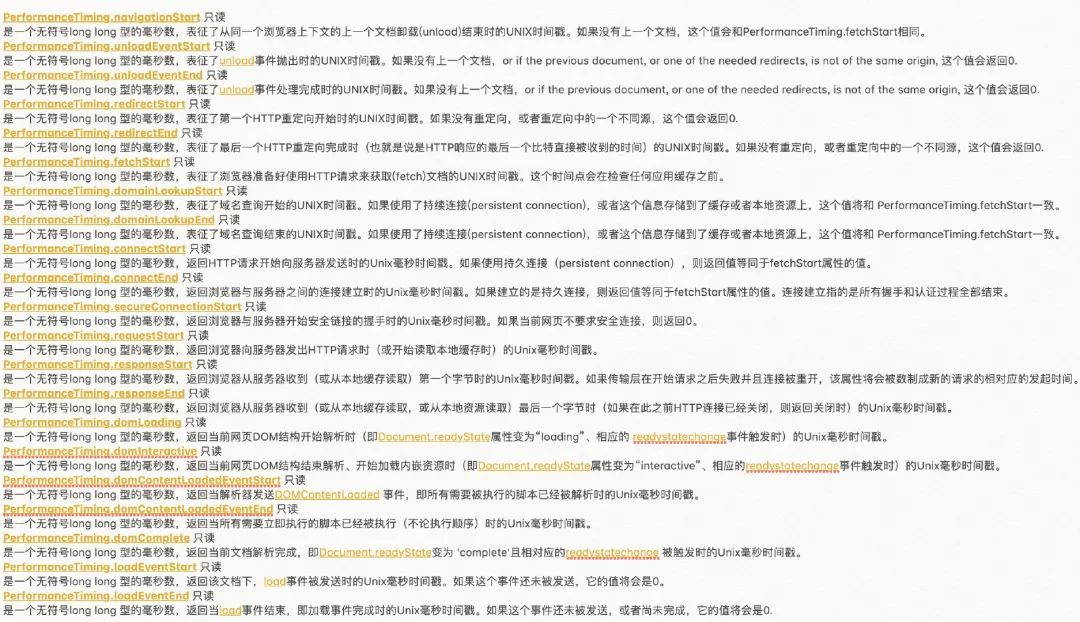
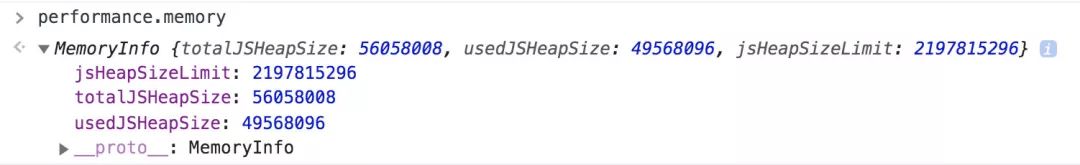
performance 分析
基本屬性
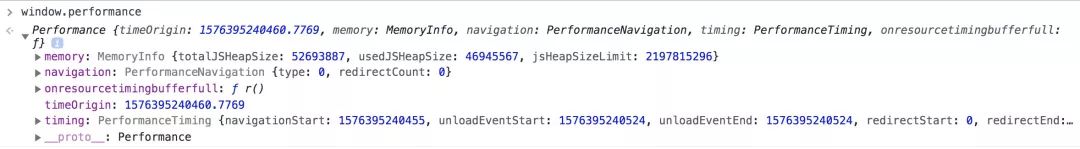

基本方法
performance?實體對象,通過?getEntriesByName?和?getEntriesByType?方法可對所有的?performance?實體對象 進行過濾,返回特定類型的實體。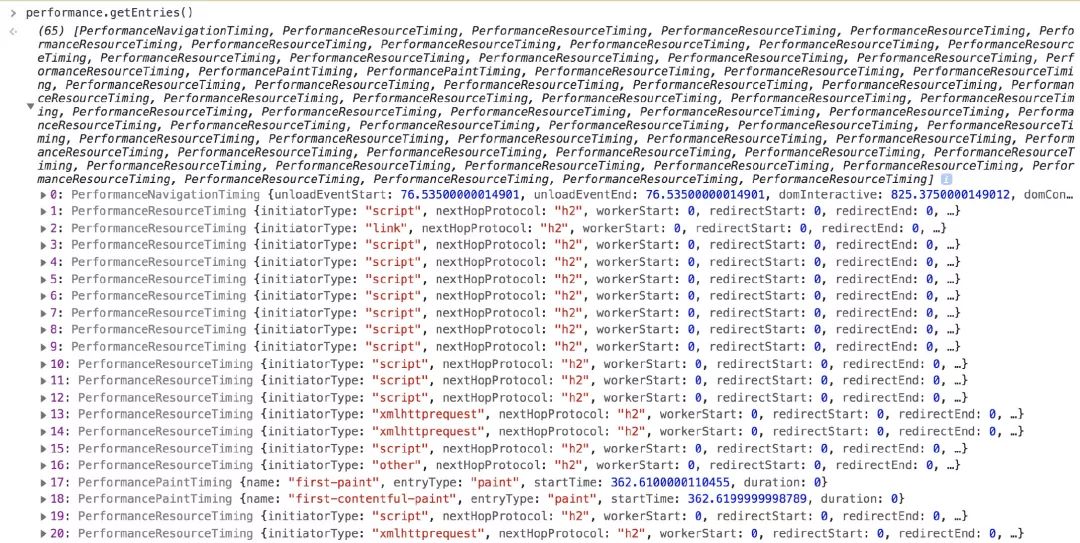
performance.getEntriesByName() performance.getEntriesByType() performance.mark() performance.clearMarks() performance.measure() performance.clearMeasures() performance.now() ...
提供的 API
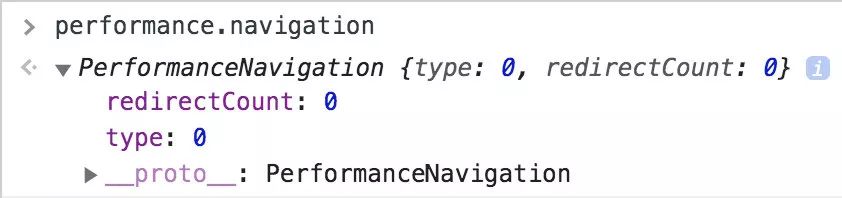
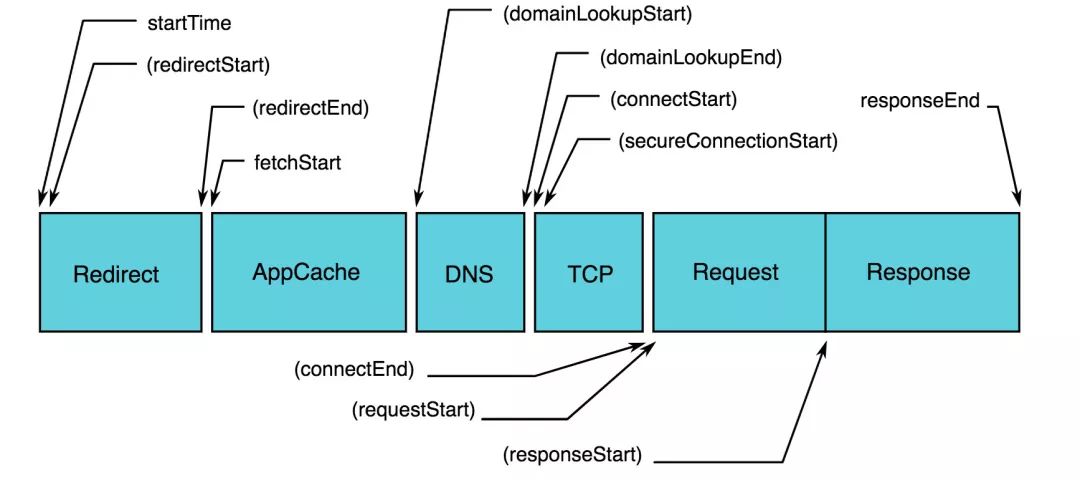
performance.getEntriesByType("navigation");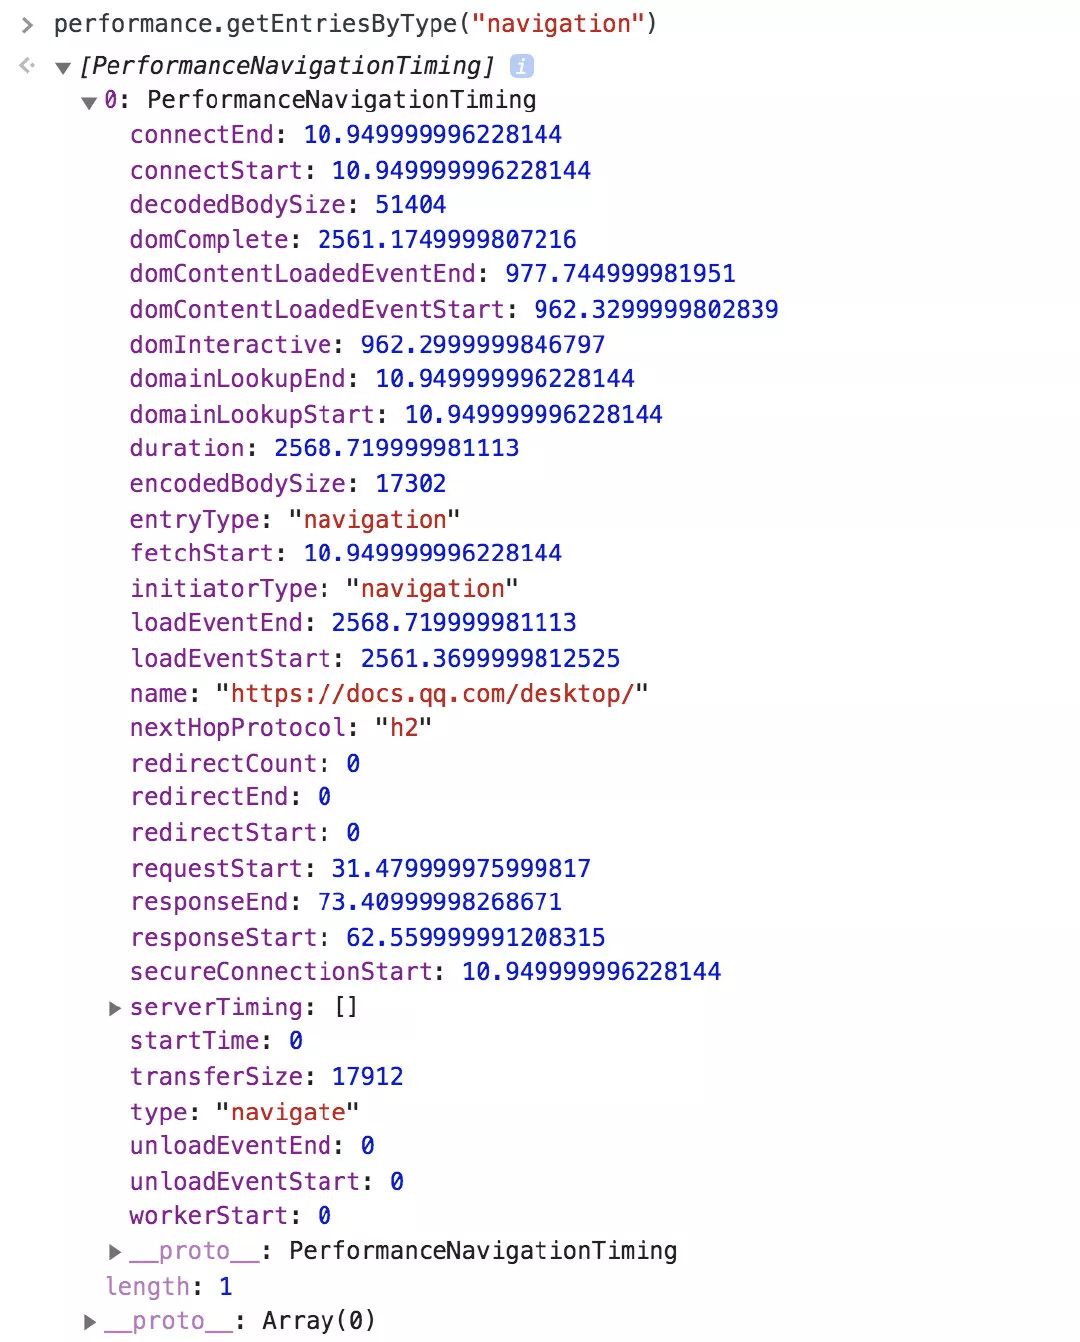
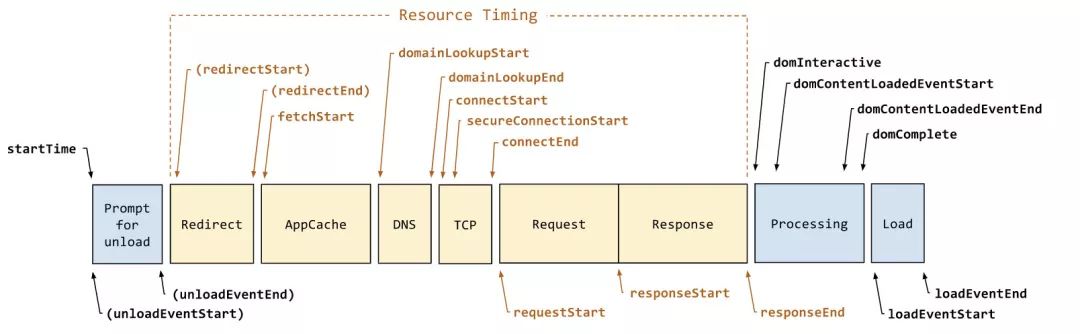
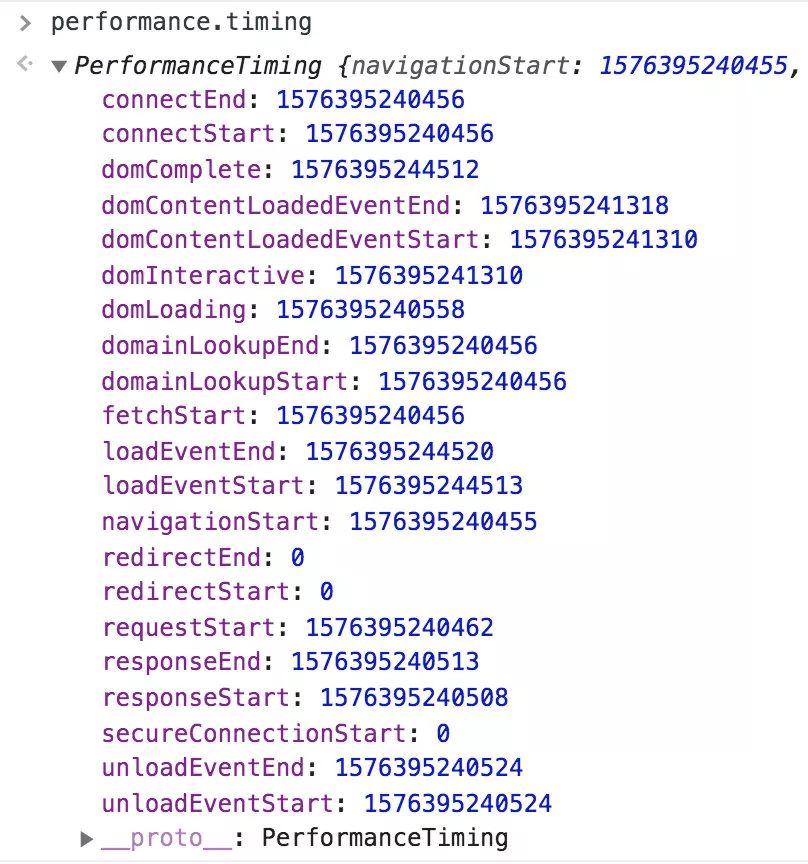
重定向次數(shù):performance.navigation.redirectCount 重定向耗時: redirectEnd - redirectStart DNS 解析耗時: domainLookupEnd - domainLookupStart TCP 連接耗時: connectEnd - connectStart SSL 安全連接耗時: connectEnd - secureConnectionStart 網(wǎng)絡(luò)請求耗時 (TTFB): responseStart - requestStart 數(shù)據(jù)傳輸耗時: responseEnd - responseStart DOM 解析耗時: domInteractive - responseEnd 資源加載耗時: loadEventStart - domContentLoadedEventEnd 首包時間: responseStart - domainLookupStart 白屏?xí)r間: responseEnd - fetchStart 首次可交互時間: domInteractive - fetchStart DOM Ready 時間: domContentLoadEventEnd - fetchStart 頁面完全加載時間: loadEventStart - fetchStart http 頭部大小:transferSize - encodedBodySize
performance.getEntriesByType("resource");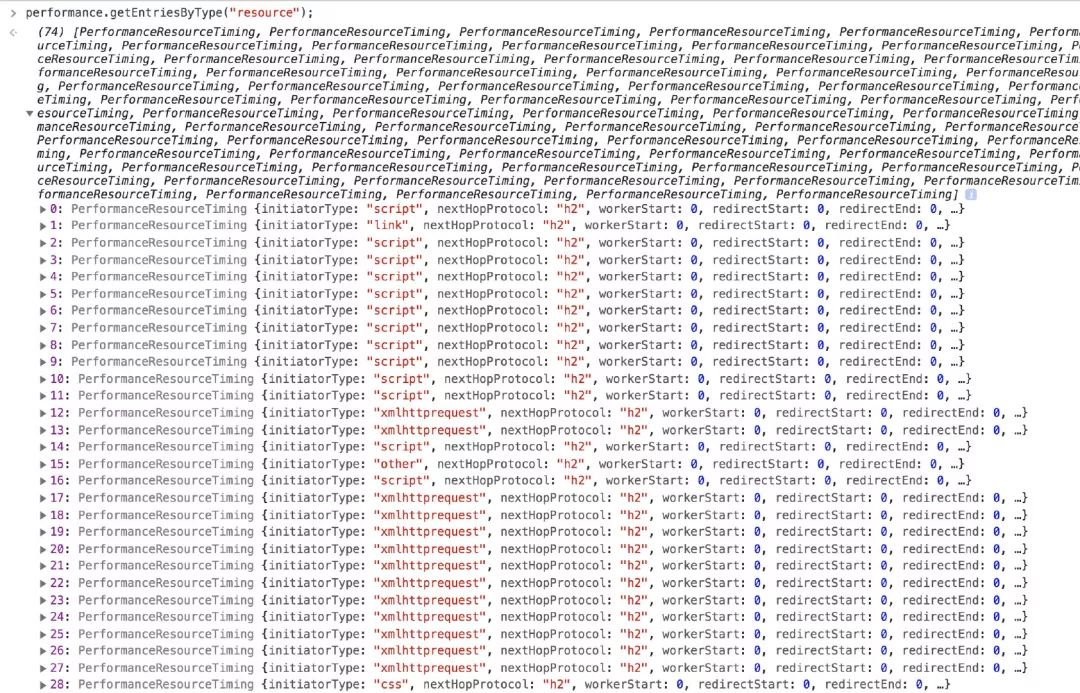
// 某類資源的加載時間,可測量圖片、js、css、XHR
resourceListEntries.forEach(resource => {
    if (resource.initiatorType == 'img') {
    console.info(`Time taken to load ${resource.name}: `, resource.responseEnd - resource.startTime);
    }
});
總結(jié)
let p = window.performance.getEntries();performance.navigation.redirectCountp.filter(ele => ele.initiatorType === "script").lengthp.filter(ele => ele.initiatorType === "css").lengthp.filter(ele => ele.initiatorType === "xmlhttprequest").lengthp.filter(ele => ele.initiatorType === "img").lengthwindow.performance.getEntriesByType("resource").length重定向耗時: redirectEnd - redirectStart DNS 解析耗時: domainLookupEnd - domainLookupStart TCP 連接耗時: connectEnd - connectStart SSL 安全連接耗時: connectEnd - secureConnectionStart 網(wǎng)絡(luò)請求耗時 (TTFB): responseStart - requestStart HTML 下載耗時:responseEnd - responseStart DOM 解析耗時: domInteractive - responseEnd 資源加載耗時: loadEventStart - domContentLoadedEventEnd
白屏?xí)r間: domLoading - fetchStart 粗略首屏?xí)r間: loadEventEnd - fetchStart 或者 domInteractive - fetchStart DOM Ready 時間: domContentLoadEventEnd - fetchStart 頁面完全加載時間: loadEventStart - fetchStart
const p = window.performance.getEntries();
let cssR = p.filter(ele => ele.initiatorType === "script");
Math.max(...cssR.map((ele) => ele.responseEnd)) - Math.min(...cssR.map((ele) => ele.startTime));
const p = window.performance.getEntries();
let cssR = p.filter(ele => ele.initiatorType === "css");
Math.max(...cssR.map((ele) => ele.responseEnd)) - Math.min(...cssR.map((ele) => ele.startTime));

? ?如何監(jiān)控?
保證數(shù)據(jù)的準(zhǔn)確性 盡量不影響應(yīng)用的性能
1.基本性能上報
performance navagation timing?中的所有點都上報,其余的上報內(nèi)容可參考 performance 分析一節(jié)中截取部分上報。例如:白屏?xí)r間,JS 和 CSS 總數(shù),以及加載總時長。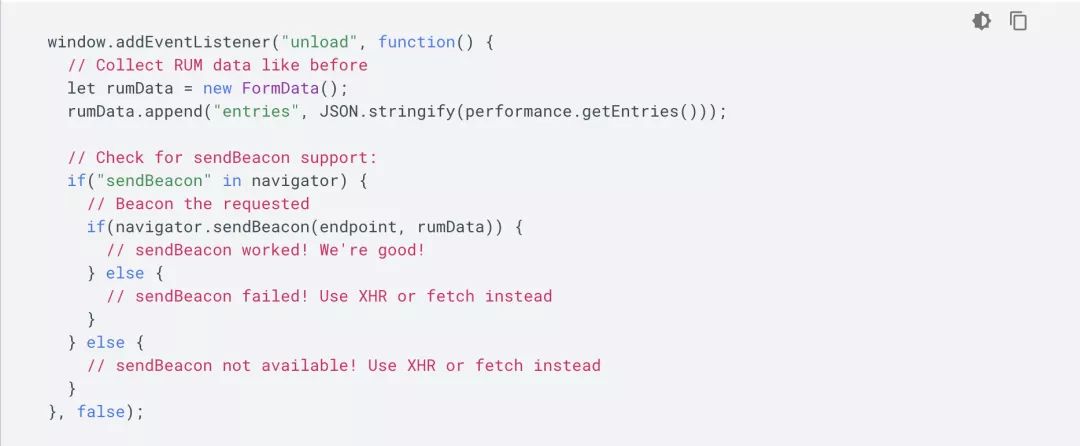
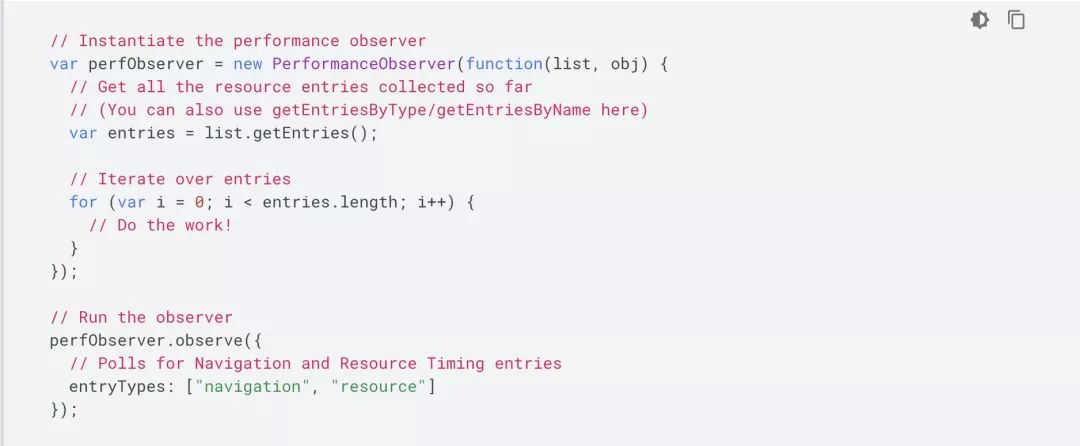
2.首屏?xí)r間計算
performance.getEntries()?拿到的所有圖片實體對象,根據(jù)圖片的初始加載時間和加載完成時間去更新首屏渲染時間。MutationObserver?接口提供了監(jiān)視對 DOM 樹所做更改的能力,是 DOM3 Events 規(guī)范的一部分。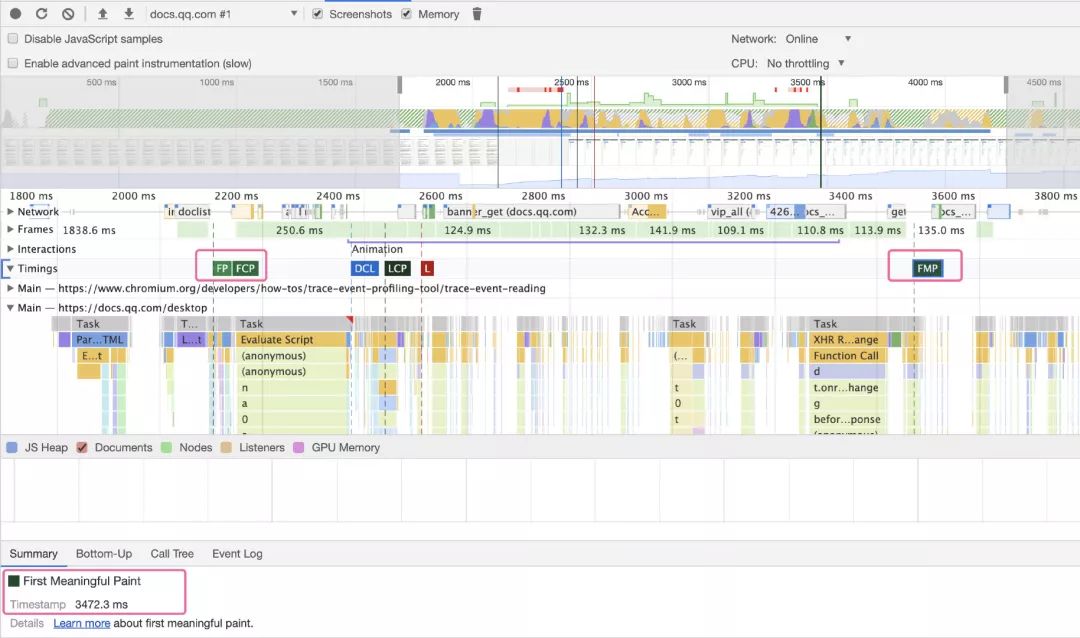
3.異常上報
1)js error 監(jiān)聽 window.onerror 事件 2)promise reject 的異常 監(jiān)聽 unhandledrejection 事件
window.addEventListener("unhandledrejection", function (event) {
    console.warn("WARNING: Unhandled promise rejection. Shame on you! Reason: "
        + event.reason);
});
3)資源加載失敗 window.addEventListener('error') 4)網(wǎng)絡(luò)請求失敗 重寫 window.XMLHttpRequest 和 window.fetch 捕獲請求錯誤 5)iframe 異常 window.frames[0].onerror 6)window.console.error
4.CGI 上報
本文作者:liu, summerqy
本文鏈接:http://www.alloyteam.com/2020/01/14184/

回復(fù)“加群”與大佬們一起交流學(xué)習(xí)~
點擊“閱讀原文”查看 100+ 篇原創(chuàng)文章
評論
圖片
表情