
基于 Prometheus 的監(jiān)控系統(tǒng)實踐

單位時間接收到的請求數(shù)量 單位時間內(nèi)請求的成功率/失敗率 請求的平均處理耗時
支持 PromQL(一種查詢語言),可以靈活地聚合指標(biāo)數(shù)據(jù)
部署簡單,只需要一個二進(jìn)制文件就能跑起來,不需要依賴分布式存儲
Go 語言編寫,組件更方便集成在同樣是Go編寫項目代碼中
原生自帶 WebUI,通過 PromQL 渲染時間序列到面板上
生態(tài)組件眾多,Alertmanager,Pushgateway,Exporter……
使用基礎(chǔ) Unit(如 seconds 而非 milliseconds)
指標(biāo)名以 application namespace 作為前綴,如:
process_cpu_seconds_total
http_request_duration_seconds
用后綴來描述 Unit,如:
http_request_duration_seconds
node_memory_usage_bytes
http_requests_total
process_cpu_seconds_total
foobar_build_info
Prometheus 提供了以下基本的指標(biāo)類型:
Counter:代表一種樣本數(shù)據(jù)單調(diào)遞增的指標(biāo),即只增不減,通常用來統(tǒng)計如服務(wù)的請求數(shù),錯誤數(shù)等。
Gauge:代表一種樣本數(shù)據(jù)可以任意變化的指標(biāo),即可增可減,通常用來統(tǒng)計如服務(wù)的CPU使用值,內(nèi)存占用值等。
Histogram?和?Summary:用于表示一段時間內(nèi)的數(shù)據(jù)采樣和點分位圖統(tǒng)計結(jié)果,通常用來統(tǒng)計請求耗時或響應(yīng)大小等。
Prometheus 是基于時間序列存儲的,首先了解一下什么是時間序列,時間序列的格式類似于(timestamp,value)這種格式,即一個時間點擁有一個對應(yīng)值,例如生活中很常見的天氣預(yù)報,如:[(14:00,27℃),(15:00,28℃),(16:00,26℃)],就是一個單維的時間序列,這種按照時間戳和值存放的序列也被稱之為向量(vector)。
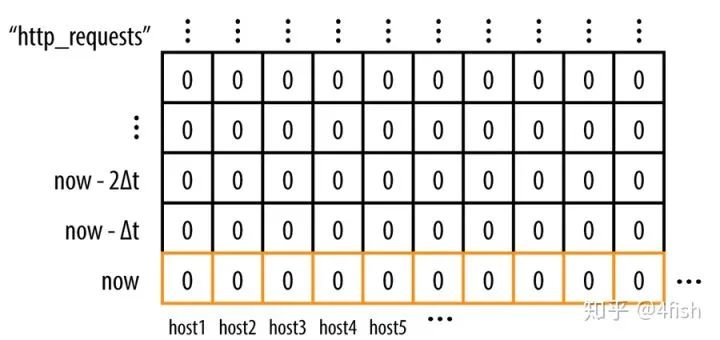
每一組唯一的標(biāo)簽集合對應(yīng)著一個唯一的向量(vector),也可叫做一個時間序列(Time Serie),當(dāng)在某一個時間點來看它時,它是一個瞬時向量(Instant Vector),瞬時向量的時序只有一個時間點以及它對于的一個值,比如:今天 12:05:30 時服務(wù)器的 CPU 負(fù)載;而在一個時間段來看它時,它是一個范圍向量(Range Vector),范圍向量對于一組時序數(shù)據(jù),比如:今天11:00到12:00時服務(wù)器的CPU負(fù)載。
類似的,可以通過指標(biāo)名和標(biāo)簽集來查詢符合條件的時間序列:
http_requests{host="host1",service="web",code="200",env="test"}
查詢結(jié)果會是一個瞬時向量:
http_requests{host="host1",service="web",code="200",env="test"} 10http_requests{host="host2",service="web",code="200",env="test"} 0http_requests{host="host3",service="web",code="200",env="test"} 12
而如果給這個條件加上一個時間參數(shù),查詢一段時間內(nèi)的時間序列:
http_requests{host="host1",service="web",code="200",env="test"}[:5m]
結(jié)果將會是一個范圍向量:
http_requests{host="host1",service="web",code="200",env="test"} 0 4 6 8 10http_requests{host="host2",service="web",code="200",env="test"} 0 0 0 0 0http_requests{host="host3",service="web",code="200",env="test"} 0 2 5 9 12
rate(http_requests{host="host1",service="web",code="200",env="test"}[:5m])
比如要求最近5分鐘請求的增長量,可以用以下的 PromQL:
increase(http_requests{host="host1",service="web",code="200",env="test"}[:5m])
要計算過去10分鐘內(nèi)第90個百分位數(shù):
histogram_quantile(0.9, rate(employee_age_bucket_bucket[10m]))
在 Prometheus 中,一個指標(biāo)(即擁有唯一的標(biāo)簽集的 metric)和一個(timestamp,value)組成了一個樣本(sample),Prometheus 將采集的樣本放到內(nèi)存中,默認(rèn)每隔2小時將數(shù)據(jù)壓縮成一個 block,持久化到硬盤中,樣本的數(shù)量越多,Prometheus占用的內(nèi)存就越高,因此在實踐中,一般不建議用區(qū)分度(cardinality)太高的標(biāo)簽,比如:用戶IP,ID,URL地址等等,否則結(jié)果會造成時間序列數(shù)以指數(shù)級別增長(label數(shù)量相乘)。
除了控制樣本數(shù)量和大小合理之外,還可以通過降低 storage.tsdb.min-block-duration 來加快數(shù)據(jù)落盤時間和增加 scrape interval 的值提高拉取間隔來控制 Prometheus 的占用內(nèi)存。
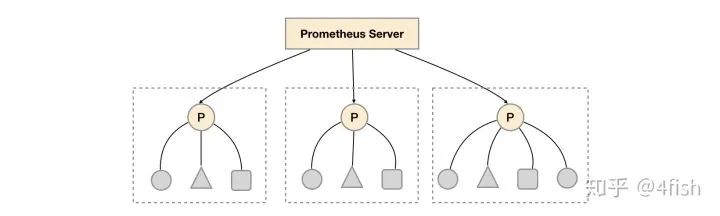
relabel_configs:- source_labels: [__address__]modulus: 3target_label: __tmp_hashaction: hashmod- source_labels: [__tmp_hash]regex: $(PROM_ID)action: keep
relabel_configs:- source_labels: ["__meta_consul_dc"]regex: "dc1"action: keep
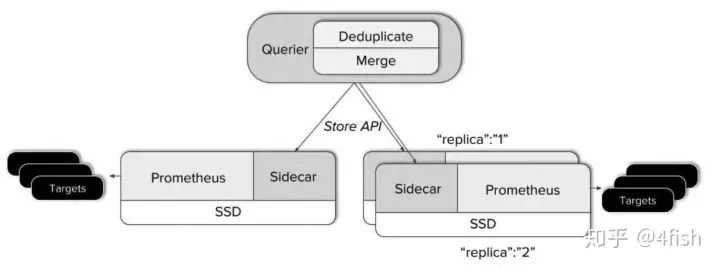
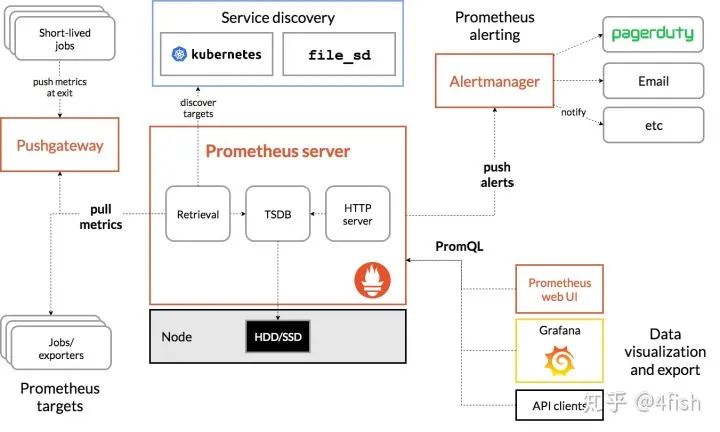
Querier 收到一個請求時,它會向相關(guān)的 Sidecar 發(fā)送請求,并從他們的 Prometheus 服務(wù)器獲取時間序列數(shù)據(jù)。 它將這些響應(yīng)的數(shù)據(jù)聚合在一起,并對它們執(zhí)行 PromQL 查詢。它可以聚合不相交的數(shù)據(jù)也可以針對 Prometheus 的高可用組進(jìn)行數(shù)據(jù)去重。

Pushgateway可以替代拉模型來作為指標(biāo)的收集方案,但在這種模式下會帶來許多負(fù)面影響:
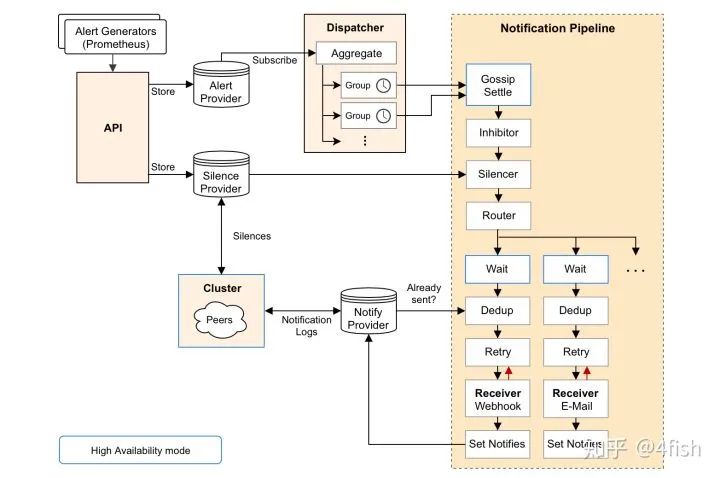
最后再來聊一下Alertmanager,簡單說 Alertmanager 是與 Prometheus 分離的告警組件,主要接收 Promethues 發(fā)送過來的告警事件,然后對告警進(jìn)行去重,分組,抑制和發(fā)送,在實際中可以搭配 webhook 把告警通知發(fā)送到企業(yè)微信或釘釘上,其架構(gòu)圖如下:
為了部署 Prometheus 實例,需要聲明 Prometheus 的 StatefulSet,Pod 中包括了三個容器,分別是 Prometheus 以及綁定的 Thanos Sidecar,最后再加入一個 watch 容器,來監(jiān)聽 prometheus 配置文件的變化,當(dāng)修改 ConfigMap 時就可以自動調(diào)用Prometheus 的 Reload API 完成配置加載,這里按照之前提到的數(shù)據(jù)分區(qū)的方式,在Prometheus 啟動前加入一個環(huán)境變量 PROM_ID,作為 Relabel 時 hashmod 的標(biāo)識,而 POD_NAME 用作 Thanos Sidecar 給 Prometheus 指定的 external_labels.replica 來使用:
apiVersion: apps/v1kind: StatefulSetmetadata:name: prometheuslabels:app: prometheusspec:serviceName: "prometheus"updateStrategy:type: RollingUpdatereplicas: 3selector:matchLabels:app: prometheustemplate:metadata:labels:app: prometheusthanos-store-api: "true"spec:serviceAccountName: prometheusvolumes:- name: prometheus-configconfigMap:name: prometheus-config- name: prometheus-datahostPath:path: /data/prometheus- name: prometheus-config-sharedemptyDir: {}containers:- name: prometheusimage: prom/prometheus:v2.11.1args:- --config.file=/etc/prometheus-shared/prometheus.yml- --web.enable-lifecycle- --storage.tsdb.path=/data/prometheus- --storage.tsdb.retention=2w- --storage.tsdb.min-block-duration=2h- --storage.tsdb.max-block-duration=2h- --web.enable-admin-apiports:- name: httpcontainerPort: 9090volumeMounts:- name: prometheus-config-sharedmountPath: /etc/prometheus-shared- name: prometheus-datamountPath: /data/prometheuslivenessProbe:httpGet:path: /-/healthyport: http- name: watchimage: watchargs: ["-v", "-t", "-p=/etc/prometheus-shared", "curl", "-X", "POST", "--fail", "-o", "-", "-sS", "http://localhost:9090/-/reload"]volumeMounts:- name: prometheus-config-sharedmountPath: /etc/prometheus-shared- name: thanosimage: improbable/thanos:v0.6.0command: ["/bin/sh", "-c"]args:- PROM_ID=`echo $POD_NAME| rev | cut -d '-' -f1` /bin/thanos sidecar--prometheus.url=http://localhost:9090--reloader.config-file=/etc/prometheus/prometheus.yml.tmpl--reloader.config-envsubst-file=/etc/prometheus-shared/prometheus.ymlenv:- name: POD_NAMEvalueFrom:fieldRef:fieldPath: metadata.nameports:- name: http-sidecarcontainerPort: 10902- name: grpccontainerPort: 10901volumeMounts:- name: prometheus-configmountPath: /etc/prometheus- name: prometheus-config-sharedmountPath: /etc/prometheus-shared
因為 Prometheus 默認(rèn)是沒辦法訪問 Kubernetes 中的集群資源的,因此需要為之分配RBAC:
apiVersion: v1kind: ServiceAccountmetadata:name: prometheus---kind: ClusterRoleapiVersion: rbac.authorization.k8s.io/v1metadata:name: prometheusnamespace: defaultlabels:app: prometheusrules:- apiGroups: [""]resources: ["services", "pods", "nodes", "nodes/proxy", "endpoints"]verbs: ["get", "list", "watch"]- apiGroups: [""]resources: ["configmaps"]verbs: ["create"]- apiGroups: [""]resources: ["configmaps"]resourceNames: ["prometheus-config"]verbs: ["get", "update", "delete"]- nonResourceURLs: ["/metrics"]verbs: ["get"]---kind: ClusterRoleBindingapiVersion: rbac.authorization.k8s.io/v1metadata:name: prometheusnamespace: defaultlabels:app: prometheussubjects:- kind: ServiceAccountname: prometheusnamespace: defaultroleRef:kind: ClusterRolename: prometheusapiGroup: ""
接著 Thanos Querier 的部署比較簡單,需要在啟動時指定 store 的參數(shù)為dnssrv+thanos-store-gateway.default.svc來發(fā)現(xiàn)Sidecar:
apiVersion: apps/v1kind: Deploymentmetadata:labels:app: thanos-queryname: thanos-queryspec:replicas: 2selector:matchLabels:app: thanos-queryminReadySeconds: 5strategy:type: RollingUpdaterollingUpdate:maxSurge: 1maxUnavailable: 1template:metadata:labels:app: thanos-queryspec:containers:- args:- query- --log.level=debug- --query.timeout=2m- --query.max-concurrent=20- --query.replica-label=replica- --query.auto-downsampling- --store=dnssrv+thanos-store-gateway.default.svc- --store.sd-dns-interval=30simage: improbable/thanos:v0.6.0name: thanos-queryports:- containerPort: 10902name: http- containerPort: 10901name: grpclivenessProbe:httpGet:path: /-/healthyport: http---apiVersion: v1kind: Servicemetadata:labels:app: thanos-queryname: thanos-queryspec:type: LoadBalancerports:- name: httpport: 10901targetPort: httpselector:app: thanos-query---apiVersion: v1kind: Servicemetadata:labels:thanos-store-api: "true"name: thanos-store-gatewayspec:type: ClusterIPclusterIP: Noneports:- name: grpcport: 10901targetPort: grpcselector:thanos-store-api: "true"部署Thanos Ruler:apiVersion: apps/v1kind: Deploymentmetadata:labels:app: thanos-rulename: thanos-rulespec:replicas: 1selector:matchLabels:app: thanos-ruletemplate:metadata:labels:labels:app: thanos-rulespec:containers:- name: thanos-ruleimage: improbable/thanos:v0.6.0args:- rule- --web.route-prefix=/rule- --web.external-prefix=/rule- --log.level=debug- --eval-interval=15s- --rule-file=/etc/rules/thanos-rule.yml- --query=dnssrv+thanos-query.default.svc- --alertmanagers.url=dns+http://alertmanager.defaultports:- containerPort: 10902name: httpvolumeMounts:- name: thanos-rule-configmountPath: /etc/rulesvolumes:- name: thanos-rule-configconfigMap:name: thanos-rule-config
部署 Pushgateway:
apiVersion: apps/v1kind: Deploymentmetadata:labels:app: pushgatewayname: pushgatewayspec:replicas: 15selector:matchLabels:app: pushgatewaytemplate:metadata:labels:app: pushgatewayspec:containers:- image: prom/pushgateway:v1.0.0name: pushgatewayports:- containerPort: 9091name: httpresources:limits:memory: 1Girequests:memory: 512Mi---apiVersion: v1kind: Servicemetadata:labels:app: pushgatewayname: pushgatewayspec:type: LoadBalancerports:- name: httpport: 9091targetPort: httpselector:app: pushgateway
部署 Alertmanager:
apiVersion: apps/v1kind: Deploymentmetadata:name: alertmanagerspec:replicas: 3selector:matchLabels:app: alertmanagertemplate:metadata:name: alertmanagerlabels:app: alertmanagerspec:containers:- name: alertmanagerimage: prom/alertmanager:latestargs:- --web.route-prefix=/alertmanager- --config.file=/etc/alertmanager/config.yml- --storage.path=/alertmanager- --cluster.listen-address=0.0.0.0:8001- --cluster.peer=alertmanager-peers.default:8001ports:- name: alertmanagercontainerPort: 9093volumeMounts:- name: alertmanager-configmountPath: /etc/alertmanager- name: alertmanagermountPath: /alertmanagervolumes:- name: alertmanager-configconfigMap:name: alertmanager-config- name: alertmanageremptyDir: {}---apiVersion: v1kind: Servicemetadata:labels:name: alertmanager-peersname: alertmanager-peersspec:type: ClusterIPclusterIP: Noneselector:app: alertmanagerports:- name: alertmanagerprotocol: TCPport: 9093targetPort: 9093
最后部署一下 ingress,大功告成:
apiVersion: extensions/v1beta1kind: Ingressmetadata:name: pushgateway-ingressannotations:kubernetes.io/ingress.class: "nginx"nginx.ingress.kubernetes.io/upstream-hash-by: "$request_uri"nginx.ingress.kubernetes.io/ssl-redirect: "false"spec:rules:- host: $(DOMAIN)http:paths:- backend:serviceName: pushgatewayservicePort: 9091path: /metrics---apiVersion: extensions/v1beta1kind: Ingressmetadata:name: prometheus-ingressannotations:kubernetes.io/ingress.class: "nginx"spec:rules:- host: $(DOMAIN)http:paths:- backend:serviceName: thanos-queryservicePort: 10901path: /- backend:serviceName: alertmanagerservicePort: 9093path: /alertmanager- backend:serviceName: thanos-ruleservicePort: 10092path: /rule- backend:serviceName: grafanaservicePort: 3000path: /grafana
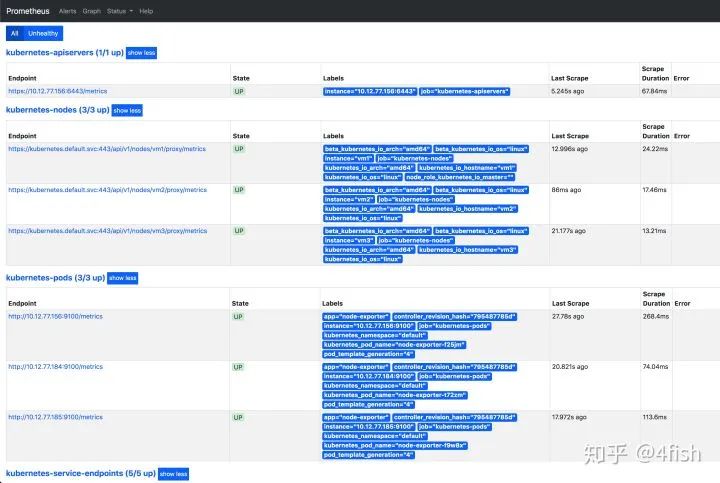
訪問 Prometheus 地址,監(jiān)控節(jié)點狀態(tài)正常:
有收獲,點個在看?
