
又一個(gè)可視化神器Highcharts,Python版也有哦!
本文重點(diǎn)介紹的是可視化庫(kù) Highcharts 的相關(guān)基礎(chǔ)知識(shí),以及如何利用Highcharts來(lái)繪制不同場(chǎng)景和需求下的精美柱狀圖,主要內(nèi)容包含:
Highcharts簡(jiǎn)介Highcharts有多強(qiáng)Highcharts4大利器python-highcharts使用繪制精美柱狀圖

Highcharts簡(jiǎn)介
什么是Highcharts
首先看一段來(lái)自官網(wǎng)的贊美:
Make your data come alive。Highcharts makes it easy for developers to set up interactive charts in their web pages.
Highcharts 是一個(gè)用純 JavaScript 編寫(xiě)的圖表庫(kù),它能夠很簡(jiǎn)單便捷的在 web 網(wǎng)站或者是 web 應(yīng)用程序中添加有交互性質(zhì)的圖表。
Highcharts 是免費(fèi)提供給個(gè)人學(xué)習(xí)、個(gè)人網(wǎng)站和非商業(yè)用途的使用的。
中文官網(wǎng)地址:https://www.highcharts.com.cn/
Highcharts特性
Highcharts 具備諸多特性,以至于它大受歡迎:
兼容性:支持所有主流的瀏覽器和移動(dòng)平臺(tái)(iOS、Android等) 多設(shè)備:支持多種設(shè)備,如手持設(shè)備、平板等 免費(fèi)使用:能夠供個(gè)人免費(fèi)學(xué)習(xí)使用 配置簡(jiǎn)單: Highcharts中的數(shù)據(jù)全部配置成json格式動(dòng)態(tài)多維圖表: Highcharts中生成的圖表能夠修改,同時(shí)支持多維圖表導(dǎo)出格式多樣:能夠?qū)С?code style="font-size: 14px;border-radius: 4px;background-color: rgba(27, 31, 35, 0.05);font-family: "Operator Mono", Consolas, Monaco, Menlo, monospace;word-break: break-all;color: rgb(0, 113, 193);padding: 3px;margin: 3px;">PDF/PNG/JPG/SVG等多種格式 可變焦:選中圖表部分放大,能夠近距離觀察圖表
上面僅僅是列出了Highcharts的部分特性,它還有時(shí)間軸上的時(shí)間精確到毫秒、文字可在任意方向旋轉(zhuǎn)等特性。

Highcharts有多強(qiáng)
Highcharts 有上面列舉的諸多特性,所以它受到了國(guó)內(nèi)外很多大公司的青睞,從它的官網(wǎng)上看到很多知名的企業(yè),比如:Facebook、Twitter、Yahoo、IBM、阿里云等

Highcharts 4大利器
Highcharts之所以如此強(qiáng)大,主要是因?yàn)樗?大利器:
Highcharts Highcharts Stock Highcharts Maps Highcharts Gantt
Highcharts
方便快捷的純 JavaScript 交互性圖表。可以說(shuō),Highcharts 是目前市面上最簡(jiǎn)單靈活的圖表庫(kù)

Highcharts Stock
方便快捷地創(chuàng)建股票圖、大數(shù)據(jù)量的時(shí)間軸圖表。
Highstock 是用純 JavaScript 編寫(xiě)的股票圖表控件,可以用來(lái)開(kāi)發(fā)股票走勢(shì)圖及大數(shù)據(jù)量時(shí)間軸圖表。

Highcharts Maps
非常優(yōu)秀的HTML5地圖組件,支持下鉆、觸摸、手勢(shì)等操作。
Highmaps 繼承了 Highcharts 簡(jiǎn)單易用的特性。利用它可以方便快捷的創(chuàng)建用于展示銷(xiāo)售、選舉結(jié)果等其他與地理位置關(guān)系密切的交互地圖圖表。

Highcharts Gantt
最簡(jiǎn)單好用的JavaScript 甘特圖庫(kù)。
方便易用的交互式甘特圖,可以用于展示時(shí)間分配、任務(wù)調(diào)度、事件及資源使用情況。

python-highcharts使用
安裝python-highcharts
開(kāi)頭筆者提到過(guò):Highcharts 是基于 JavaScript 編寫(xiě)的圖表庫(kù)。
因?yàn)楹芏嗳瞬⒉皇呛苌瞄L(zhǎng)前端語(yǔ)言,所以有位大神編寫(xiě)出來(lái)基于 Python 的第三方的庫(kù):python-highcharts,詳細(xì)說(shuō)明見(jiàn)github https://github.com/kyper-data/python-highcharts
安裝 python-highcharts 非常的簡(jiǎn)單:
pip install python-highcharts
目前 python-highcharts 支持 Python2.7/3.4+,python版本需要滿足需求
使用demo
安裝好 python-highcharts 之后,我們用一個(gè)小案例來(lái)說(shuō)明如何通過(guò)它繪制圖形,首先看看整體的代碼和圖形:
# 1-導(dǎo)入庫(kù)和實(shí)例化
from highcharts import Highchart
chart = Highchart()

# 2-配置項(xiàng)設(shè)置
options = {
    'chart': {
        'inverted': True  # 翻轉(zhuǎn)x軸和y軸
    },
    'title': {  # 主標(biāo)題
        'text': 'Atmosphere Temperature by Altitude'
    },
    'subtitle': {  # 副標(biāo)題
        'text': 'According to the Standard Atmosphere Model'
    },
    'xAxis': {  # x軸設(shè)置
        'reversed': False,
        'title': {
            'enabled': True,
            'text': 'Altitude'
        },
        'labels': {
            'formatter': 'function () {\
                return this.value + "km";\
            }'
        },
        'maxPadding': 0.05,
        'showLastLabel': True
    },
    'yAxis': {  # y軸設(shè)置
        'title': {
            'text': 'Temperature'
        },
        'labels': {
            'formatter': "function () {\
                return this.value + '°';\
            }"
        },
        'lineWidth': 2
    },
    'legend': {  # 圖例設(shè)置
        'enabled': False
    },
    'tooltip': {  # 提示工具設(shè)置
        'headerFormat': '<b>{series.name}</b><br/>',
        'pointFormat': '{point.x} km: {point.y}°C'
    }
}

# 3-實(shí)例化對(duì)象中添加配置
chart.set_dict_options(options)

# 4-繪圖所需的數(shù)據(jù)和添加數(shù)據(jù)
data =  [[0, 15],
         [10, -50],
         [20, -56.5],
         [30, -46.5],
         [40, -22.1],
         [50, -2.5],
         [60, -27.7],
         [70, -55.7],
         [80, -76.5]]
# 添加數(shù)據(jù)
chart.add_data_set(data, 'spline', 'Temperature', marker={'enabled': False})

# 5-在線繪圖
chart
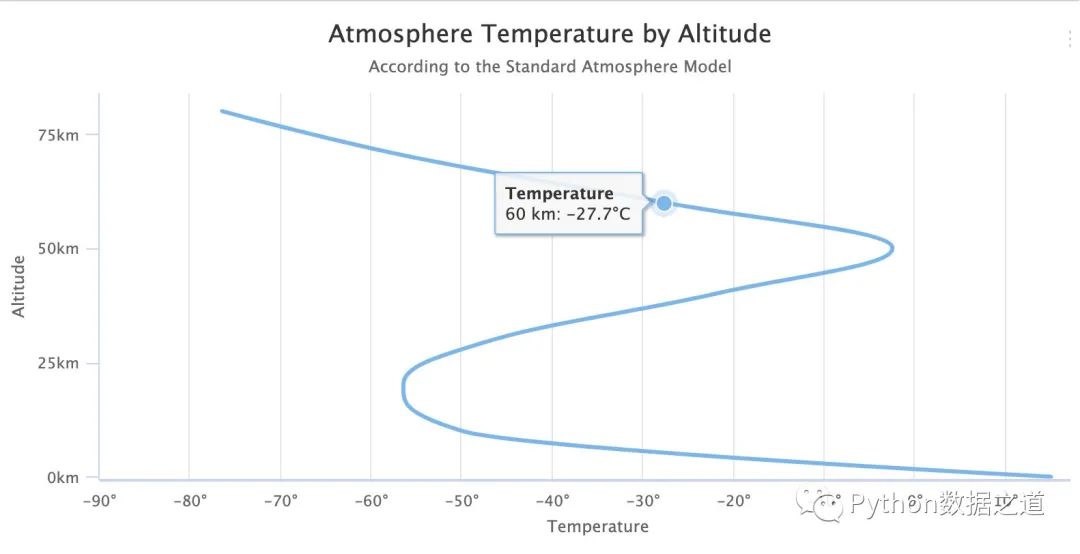
通過(guò)上面的代碼我們可以看到使用 python-highcharts 繪圖的5個(gè)基本步驟:
導(dǎo)入庫(kù)和示例化對(duì)象 設(shè)置各種配置項(xiàng);配置項(xiàng)都是字典形式 往實(shí)例化對(duì)象中添加字典形式的配置項(xiàng) 準(zhǔn)備數(shù)據(jù)和往實(shí)例化對(duì)象中添加數(shù)據(jù),并設(shè)置圖形的相關(guān)信息 notebook中在線繪圖
繪制精美柱狀圖
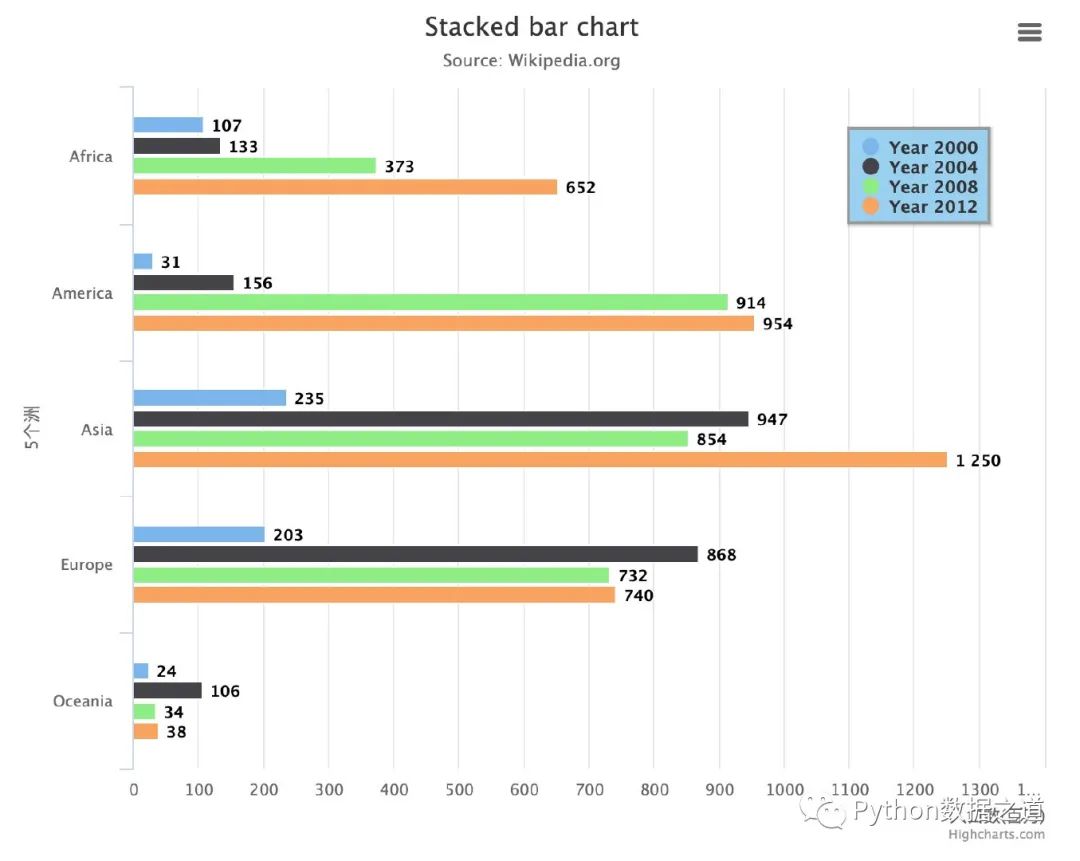
基礎(chǔ)柱狀圖
from highcharts import Highchart   # 導(dǎo)入庫(kù)
H = Highchart(width=750, height=600)  # 設(shè)置圖形的大小

# 4組數(shù)據(jù),代表4個(gè)年份
# 每組5個(gè)數(shù)據(jù)代表的是5個(gè)洲
data1 = [107, 31, 235, 203, 24]
data2 = [133, 156, 947, 868, 106]
data3 = [373, 914, 854, 732, 34]
data4 = [652, 954, 1250, 740, 38]

# 進(jìn)行配置
options = {
    'chart': {  # 加上chart配置變成水平柱狀圖
        'type': 'bar'
    },
 'title': {  # 1、主標(biāo)題
        'text': 'Stacked bar chart'
    },

    'subtitle': {   # 2、副標(biāo)題
        'text': 'Source: <a
    },

    'xAxis': {   # 3、橫軸的5個(gè)分類(lèi)
        'categories': ['Africa', 'America', 'Asia', 'Europe', 'Oceania'],
        'title': {
            'text': "5個(gè)洲"   # x軸的名稱
        }
    },
    'yAxis': {
        'min': 0,  # 設(shè)置最小值
        'title': {
            'text': '人口數(shù)(百萬(wàn))',  # y軸名稱
            'align': 'high'
        },
        'labels': {
            'overflow': 'justify'
        }
    },
    'tooltip': {
        'valueSuffix': ' millions'
    },
    'legend': {  # 圖例設(shè)置
        'layout': 'vertical',   # 垂直方向
        'align': 'right',  # 靠右顯示
        'verticalAlign': 'top',   # 頂部
        'x': -40,
        'y': 80,
        'floating': True,
        'borderWidth': 2,    # 圖例外圍線條寬度
        'backgroundColor': "((Highcharts.theme && Highcharts.theme.legendBackgroundColor) || '#9ACFF0')",#圖例背景顏色
        'shadow': True
    },
    'credits': {  # 右下角的版權(quán)標(biāo)簽
        'enabled': True
    },
    'plotOptions': {
        'bar': {
            'dataLabels': {
                'enabled': True  # 顯示數(shù)據(jù)(柱狀圖頂部的數(shù)據(jù)顯示出來(lái))
            }
        }
    }
}

H.set_dict_options(options)   # 添加配置

# 每個(gè)年份添加一組數(shù)據(jù)
H.add_data_set(data1, 'bar', 'Year 2000')
H.add_data_set(data2, 'bar', 'Year 2004')
H.add_data_set(data3, 'bar', 'Year 2008')
H.add_data_set(data4, 'bar', 'Year 2012')

H
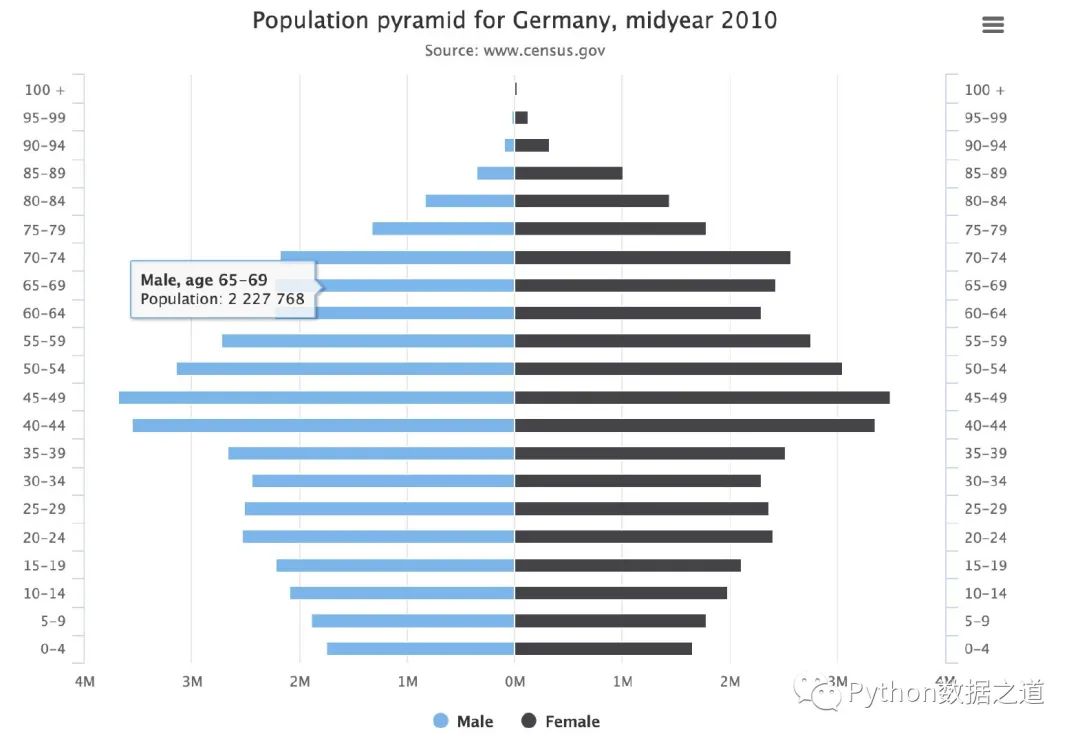
蝴蝶柱狀圖
兩個(gè)不同類(lèi)型的雙排柱狀圖:
from highcharts import Highchart
H = Highchart(width=550, height=400)

# 1、數(shù)值分類(lèi)區(qū)間
categories = ['0-4', '5-9', '10-14', '15-19',
              '20-24', '25-29', '30-34', '35-39',
              '40-44','45-49', '50-54', '55-59',
              '60-64', '65-69','70-74', '75-79',
              '80-84', '85-89', '90-94','95-99', '100 + ']
# 2、配置項(xiàng)
# 在這種圖形中橫軸和縱軸需要調(diào)換
options = {
 'chart': {  #  指定圖表類(lèi)型:柱狀圖
        'type': 'bar'
    },
    'title': {  # 主標(biāo)題
        'text': 'Population pyramid for Germany, midyear 2010'
    },
    'subtitle': {  # 副標(biāo)題
        'text': 'Source: www.census.gov'
    },
    'xAxis': [{  # 左側(cè)標(biāo)簽設(shè)置
        'categories': categories,
        'reversed': False,   # 分類(lèi)區(qū)間是否翻轉(zhuǎn)
        'labels': {
            'step': 1  # 標(biāo)簽區(qū)間的間隔
        }
    }, {   # 右側(cè)標(biāo)簽設(shè)置
        'opposite': True,
        'reversed': False,
        'categories': categories,
        'linkedTo': 0,
        'labels': {
            'step': 1
        }
    }],
    'yAxis': {
        'title': {
            'text': None
        },
        'labels': {  # y軸標(biāo)簽
            'formatter': "function () {\
                                    return (Math.abs(this.value) / 1000000) + 'M';\
                                }"
        },
        'min': -4000000,
        'max': 4000000
    },

    'plotOptions': {
        'series': {
            'stacking': 'normal'
        }
    },

    'tooltip': {
        'formatter': "function () {\
                            return '<b>' + this.series.name + ', age ' + this.point.category + '</b><br/>' +\
                                'Population: ' + Highcharts.numberFormat(Math.abs(this.point.y), 0);\
                        }"
    },
}

# 設(shè)置男女的數(shù)值
data_male = [-1746181, -1884428, -2089758, -2222362,
             -2537431, -2507081, -2443179, -2664537,
             -3556505, -3680231, -3143062, -2721122,
             -2229181, -2227768,-2176300, -1329968,
             -836804, -354784, -90569, -28367, -3878]

data_female = [1656154, 1787564, 1981671, 2108575,
               2403438, 2366003, 2301402, 2519874,
               3360596, 3493473, 3050775, 2759560,
               2304444, 2426504, 2568938, 1785638,
               1447162, 1005011, 330870, 130632, 21208]

# 添加配置項(xiàng)
H.set_dict_options(options)

# 添加數(shù)據(jù)和指定圖表類(lèi)型bar
H.add_data_set(data_male, 'bar', 'Male')
H.add_data_set(data_female, 'bar', 'Female')

H
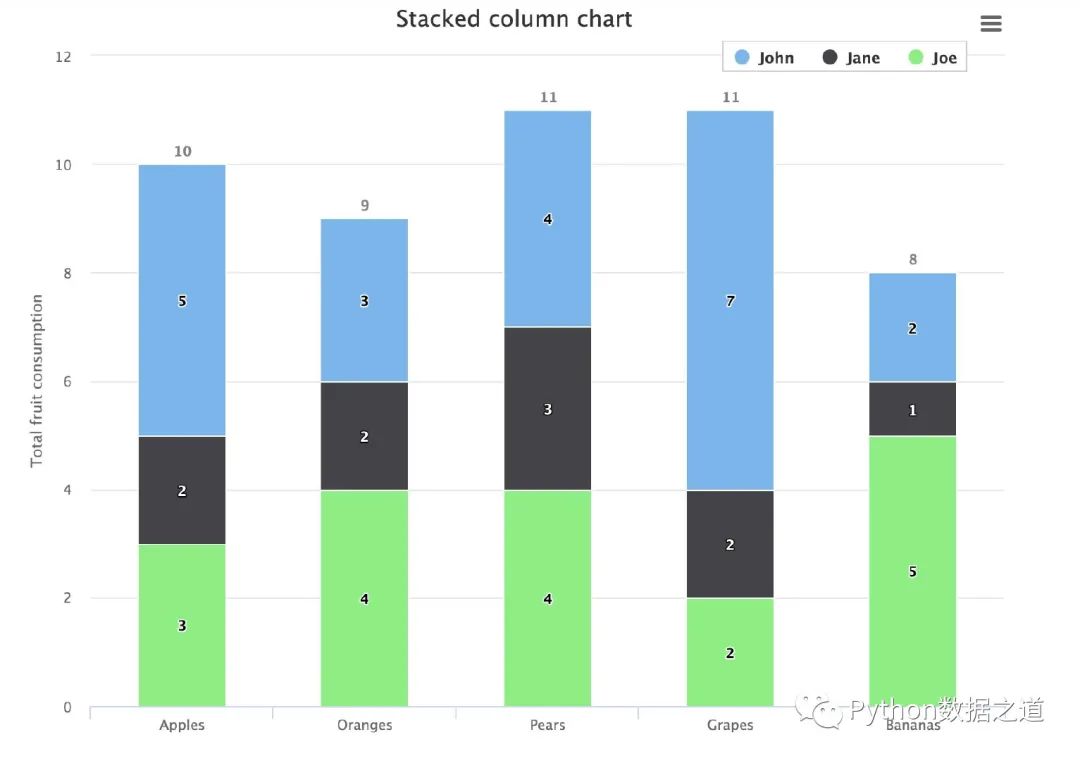
垂直柱狀圖
from highcharts import Highchart   # 導(dǎo)入庫(kù)
H = Highchart(width=800, height=600)  # 設(shè)置圖形的大小

# 配置數(shù)據(jù)項(xiàng)
data1 = [5, 3, 4, 7, 2]
data2 = [2, 2, 3, 2, 1]
data3 = [3, 4, 4, 2, 5]

options = {
    'chart': {
        'type': 'column'   # bar改成column
    },
    'title': {
        'text': 'Stacked column chart'
    },
    'xAxis': {
        'categories': ['Apples', 'Oranges', 'Pears', 'Grapes', 'Bananas']
    },
    'yAxis': {
        'min': 0,
        'title': {
            'text': 'Total fruit consumption'
        },
        'stackLabels': {
            'enabled': True,
            'style': {
                'fontWeight': 'bold',
                'color': "(Highcharts.defaultOptions.title.style && \
                    Highcharts.defaultOptions.title.style.color) || 'gray'"
            }
        }
    },
    'legend': {
        'align': 'right',
        'x': -30,
        'verticalAlign': 'top',
        'y': 25,
        'floating': True,
        'backgroundColor':
            "Highcharts.defaultOptions.legend.backgroundColor || 'white'",
        'borderColor': '#CCC',
        'borderWidth': 1,
        'shadow': False
    },
    'tooltip': {
        'headerFormat': '<b>{point.x}</b><br/>',
        'pointFormat': '{series.name}: {point.y}<br/>Total: {point.stackTotal}'
    },
    # 在這里設(shè)置堆疊的信息
    'plotOptions': {   # 將每個(gè)數(shù)據(jù)在柱狀圖上方顯示出來(lái)
        'column': {
            'stacking': 'normal',
            'dataLabels': {
                'enabled': True  # 顯示數(shù)據(jù)(柱狀圖頂部的數(shù)據(jù)顯示出來(lái))
            }
        }
    }
}

H.set_dict_options(options)   # 添加配置

# 將之前的bar改成column即可
H.add_data_set(data1,'column','John')
H.add_data_set(data2,'column','Jane')
H.add_data_set(data3,'column','Joe')

H
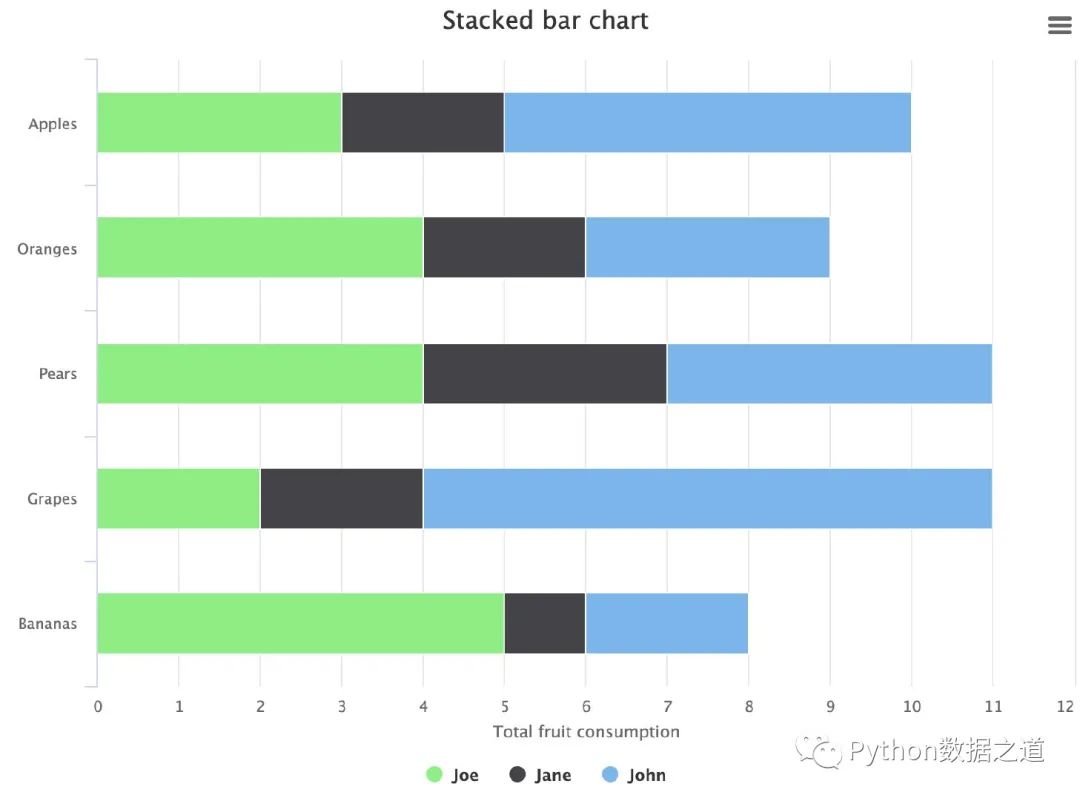
水平疊加柱狀圖
from highcharts import Highchart   # 導(dǎo)入庫(kù)
H = Highchart(width=800, height=600)  # 設(shè)置圖形的大小

# 配置數(shù)據(jù)項(xiàng)
data1 = [5, 3, 4, 7, 2]
data2 = [2, 2, 3, 2, 1]
data3 = [3, 4, 4, 2, 5]

options = {
    'chart': {
        'type': 'bar'  # 圖表類(lèi)型
    },
    'title': {  # 主標(biāo)題
        'text': 'Stacked bar chart'
    },
    'xAxis': {
        'categories': ['Apples', 'Oranges', 'Pears', 'Grapes', 'Bananas']
    },
    'yAxis': {
        'min': 0,
        'title': {
            'text': 'Total fruit consumption'
        }
    },
    'legend': {
        'reversed': True
    },
    'plotOptions': {
        'series': {
            'stacking': 'normal'
        }
    }
}

H.set_dict_options(options)   # 添加配置

H.add_data_set(data1,'bar','John')
H.add_data_set(data2,'bar','Jane')
H.add_data_set(data3,'bar','Joe')

H
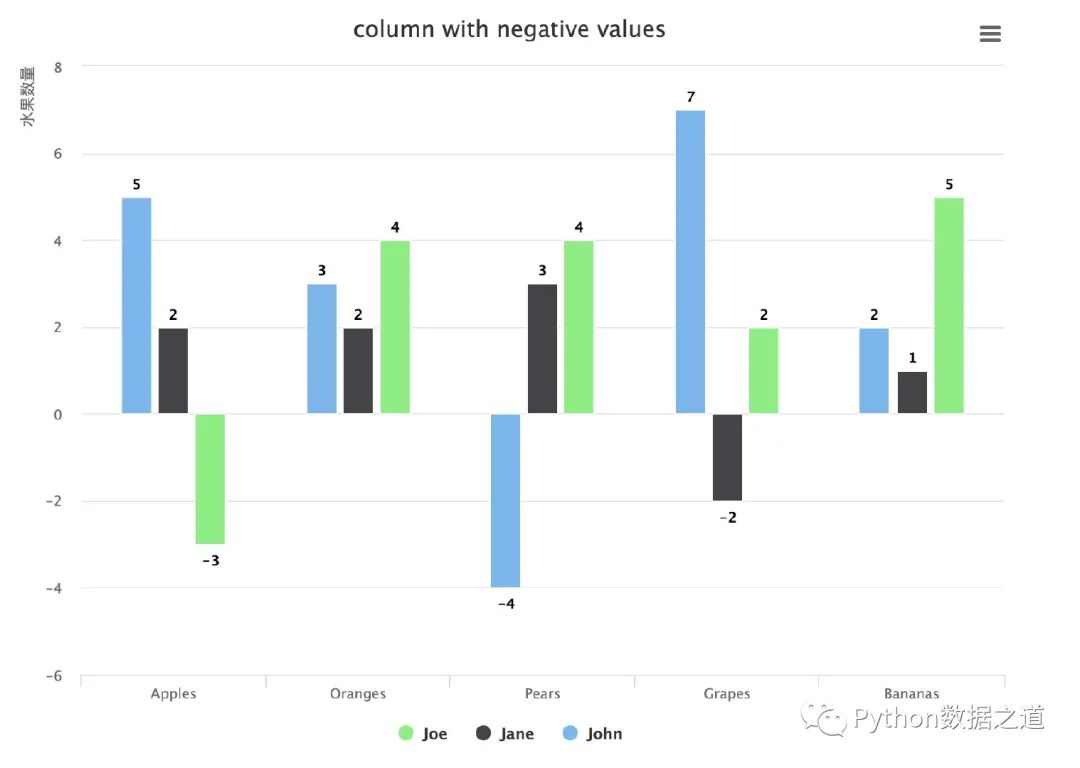
帶有負(fù)值的柱狀圖
有時(shí)候我們的數(shù)據(jù)中還有負(fù)值,利用Highcharts同樣可以繪制柱狀圖:
from highcharts import Highchart   # 導(dǎo)入庫(kù)
H = Highchart(width=800, height=600)  # 設(shè)置圖形的大小

# 配置數(shù)據(jù)項(xiàng)
data1 = [5, 3, -4, 7, 2]
data2 = [2, 2, 3, -2, 1]
data3 = [-3, 4, 4, 2, 5]

options = {
    'chart': {  # 圖表類(lèi)型不是bar,而是column
        'type': 'column'
    },
    'title': {  # 主標(biāo)題
        'text': 'column with negative values'
    },
    'xAxis': {
        'categories': ['Apples', 'Oranges', 'Pears', 'Grapes', 'Bananas']
    },
    'yAxis': {
        'title': {
            'text': '水果數(shù)量',  # y軸名稱
            'align': 'high'
        },
        'labels': {
            'overflow': 'justify'
        }
    },
    'legend': {
        'reversed': True
    },
    'credits': {  # 右下角的版權(quán)信息
        'enabled': False
    },
    'plotOptions': {   # 將每個(gè)數(shù)據(jù)在柱狀圖上方顯示出來(lái)
        'bar': {
            'dataLabels': {
                'enabled': True  # 顯示數(shù)據(jù)(柱狀圖頂部的數(shù)據(jù)顯示出來(lái))
            }
        }
    }
}

H.set_dict_options(options)   # 添加配置
H.add_data_set(data1,'bar','John')
H.add_data_set(data2,'bar','Jane')
H.add_data_set(data3,'bar','Joe')

H
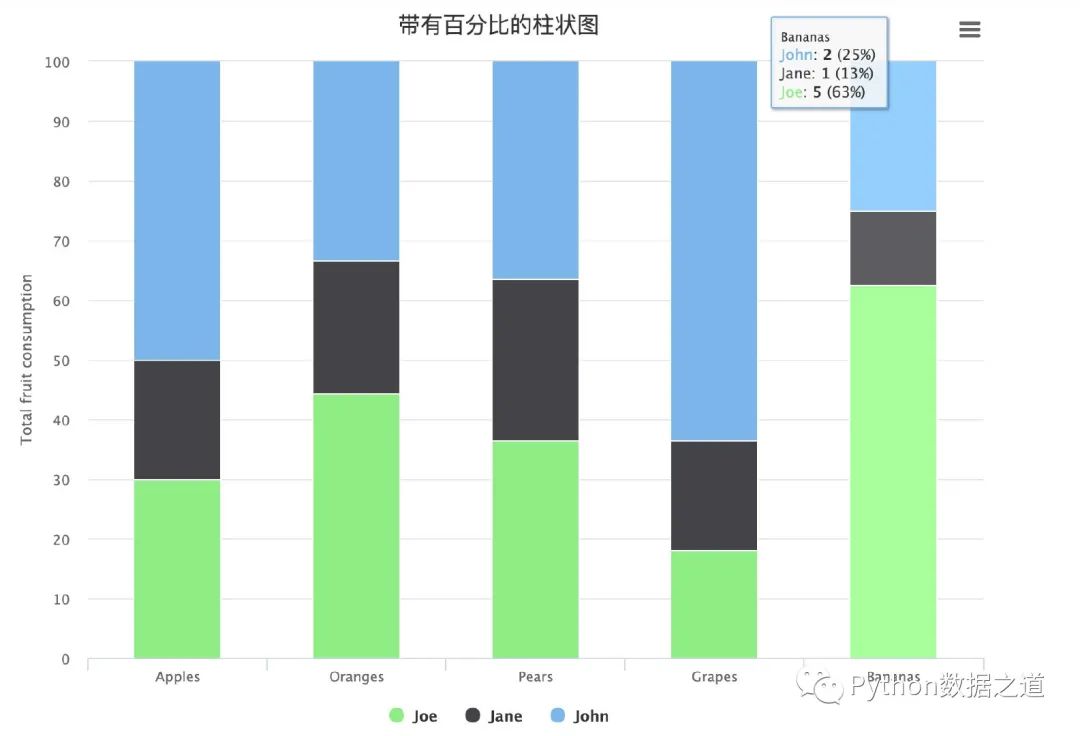
帶有百分比的柱狀圖
from highcharts import Highchart   # 導(dǎo)入庫(kù)
H = Highchart(width=800, height=600)  # 設(shè)置圖形的大小

# 配置數(shù)據(jù)項(xiàng)
data1 = [5, 3, 4, 7, 2]
data2 = [2, 2, 3, 2, 1]
data3 = [3, 4, 4, 2, 5]

options = {
    'chart': {
        'type': 'column'  # 圖表類(lèi)型
    },
    'title': {  # 主標(biāo)題
        'text': '帶有百分比的柱狀圖'
    },
    'xAxis': {
        'categories': ['Apples', 'Oranges', 'Pears', 'Grapes', 'Bananas']
    },
    'yAxis': {
        'min': 0,
        'title': {
            'text': 'Total fruit consumption'
        }
    },
    'tooltip': {
        'pointFormat': '<span style="color:{series.color}">{series.name}</span>: <b>{point.y}</b> ({point.percentage:.0f}%)<br/>',
        'shared': True
    },
    'legend': {
        'reversed': True
    },
    'plotOptions': {
        'series': {   # 將stacking參數(shù)設(shè)置成percent
            'stacking': 'percent'   # 多種取值:normal+percent
        }
    }
}

H.set_dict_options(options)   # 添加配置

H.add_data_set(data1,'bar','John')
H.add_data_set(data2,'bar','Jane')
H.add_data_set(data3,'bar','Joe')

H
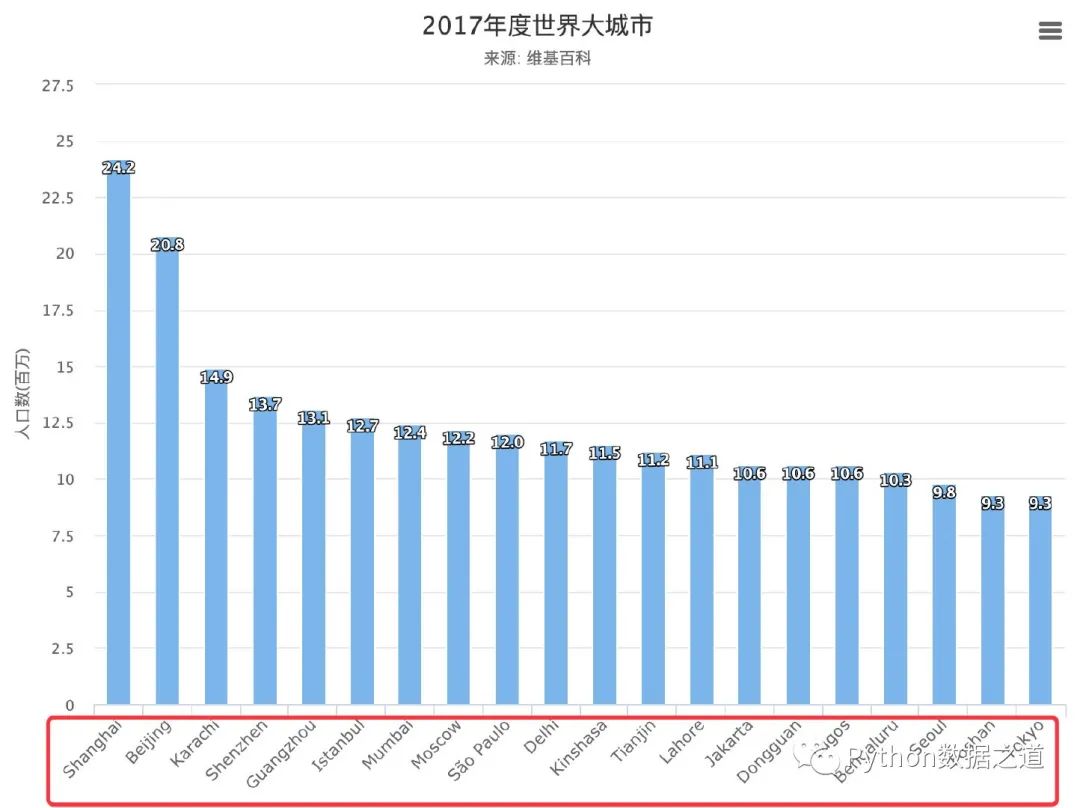
坐標(biāo)屬性傾斜的柱狀圖
當(dāng)我們的坐標(biāo)屬性過(guò)長(zhǎng)的時(shí)候,屬性值顯示在坐標(biāo)軸上可以傾斜一定的角度:
from highcharts import Highchart   # 導(dǎo)入庫(kù)
H = Highchart(width=800, height=600)  # 設(shè)置圖形的大小

data = [
        ['Shanghai', 24.2],
        ['Beijing', 20.8],
        ['Karachi', 14.9],
        ['Shenzhen', 13.7],
        ['Guangzhou', 13.1],
        ['Istanbul', 12.7],
        ['Mumbai', 12.4],
        ['Moscow', 12.2],
        ['S?o Paulo', 12.0],
        ['Delhi', 11.7],
        ['Kinshasa', 11.5],
        ['Tianjin', 11.2],
        ['Lahore', 11.1],
        ['Jakarta', 10.6],
        ['Dongguan', 10.6],
        ['Lagos', 10.6],
        ['Bengaluru', 10.3],
        ['Seoul', 9.8],
        ['Foshan', 9.3],
        ['Tokyo', 9.3]
    ]


options = {
    'chart': {
        'type': 'column'
    },
    'title': {
        'text': '2017年度世界大城市'
    },
    'subtitle': {   # 帶上了url地址,點(diǎn)擊進(jìn)入鏈接的文章中
        'text': '來(lái)源: <a
    },
    'xAxis': {
        'type': 'category',
        'labels': {
            'rotation': -45,   # 控制傾斜方向:+ 表示向右傾斜
            'style': {
                'fontSize': '12px',  # 字體設(shè)置
                'fontFamily': 'Verdana, sans-serif'
            }
        }
    },
    'yAxis': {
        'min': 0,
        'title': {
            'text': '人口數(shù)(百萬(wàn))',
#             'rotation': -1,
#             'style': {
#                 'fontSize': '13px',
#                 'fontFamily': 'Verdana, sans-serif'
#             }
        }
    },

    'legend': {
        'enabled': False
    },

    'tooltip': {   # 當(dāng)鼠標(biāo)放到柱子上去的時(shí)候顯示的內(nèi)容
        'pointFormat': 'Population in 2017: <b>{point.y:.1f} millions</b>'
    },

    # 重要設(shè)置項(xiàng)
    'plotOptions': {   # 將每個(gè)數(shù)據(jù)在柱狀圖上方顯示出來(lái)
        'column': {
            'stacking': 'normal',
            'dataLabels': {
                'enabled': True,
                'inside': False,
                'rotation': -1,
                'color': '#FFFFFF',
#                 'align': 'left',
                'format': '{point.y:.1f}',
                'y': 10,   # 10 pixels down from the top
#                 'style': {
#                     'fontSize': '15px',
#                     'fontFamily': 'Verdana, sans-serif'
#                 }
            }
        }
    }
}


H.set_dict_options(options)   # 添加配置

H.add_data_set(data,'column','Population')

H
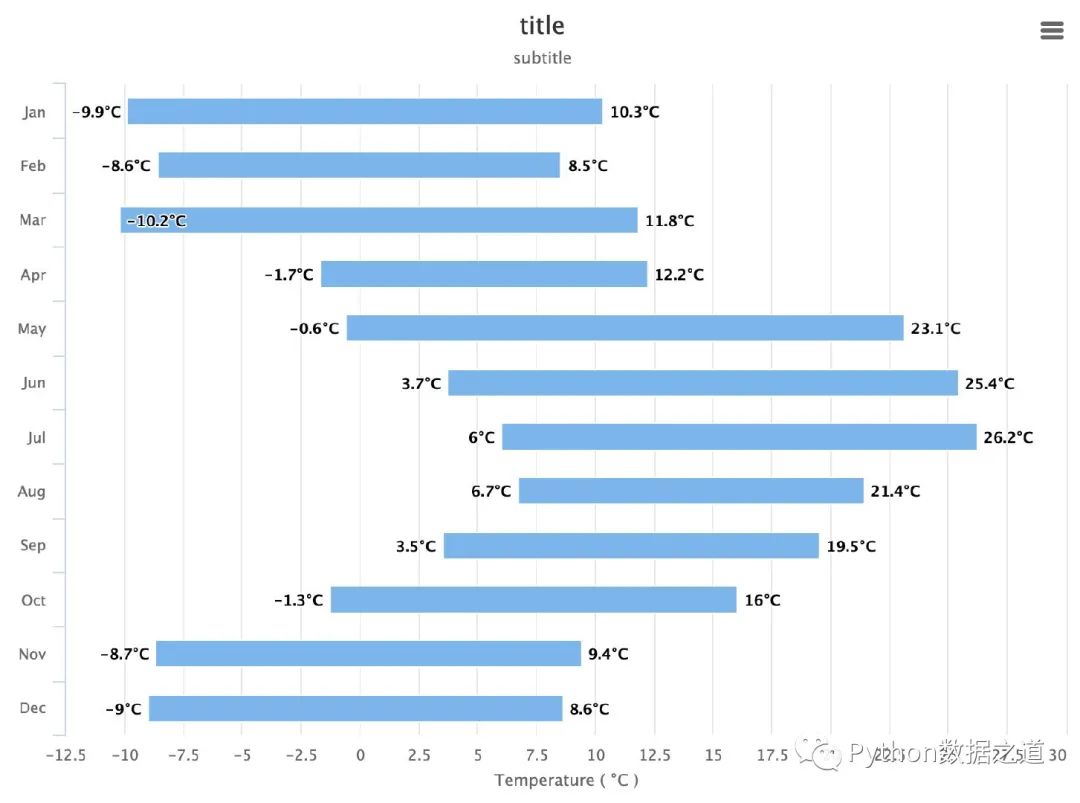
基于最值的柱狀圖
通過(guò)最小值和最大值可以繪制在區(qū)間內(nèi)變化的柱狀圖:
from highcharts import Highchart   # 導(dǎo)入庫(kù)
H = Highchart(width=800, height=600)  # 設(shè)置圖形的大小

data_range = [
        [-9.9, 10.3],
        [-8.6, 8.5],
        [-10.2, 11.8],
        [-1.7, 12.2],
        [-0.6, 23.1],
        [3.7, 25.4],
        [6.0, 26.2],
        [6.7, 21.4],
        [3.5, 19.5],
        [-1.3, 16.0],
        [-8.7, 9.4],
        [-9.0, 8.6]
        ]


options = {
    'chart': {
        'type': 'columnrange',
        'inverted': True
    },

#     # Note: Prefer using linkedDescription or caption instead.
#     'accessibility': {   # 取消了該屬性
#         'description': 'Image description'
#     },

    'title': {
        'text': 'title'
    },

    'subtitle': {
        'text': 'subtitle'
    },

    'xAxis': {
        'categories': ['Jan', 'Feb', 'Mar', 'Apr', 'May', 'Jun',
            'Jul', 'Aug', 'Sep', 'Oct', 'Nov', 'Dec']
    },

    'yAxis': {
        'title': {
            'text': 'Temperature ( °C )'
        }
    },

    'tooltip': {
        'valueSuffix': '°C'
    },
    'legend': {
        'enabled': False
    },
    'plotOptions': {
        'columnrange': {
            'dataLabels': {
                'enabled': True,
                'format': '{y}°C'
            }
        }
    }
}

H.set_dict_options(options)   # 添加配置

H.add_data_set(data_range,'columnrange','Temperatures')  # 添加數(shù)據(jù)

H
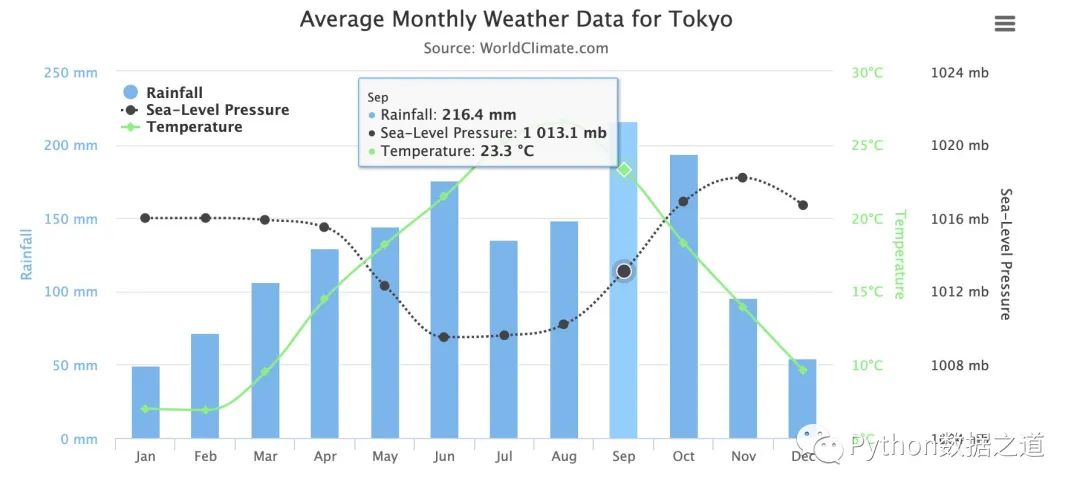
多軸柱狀圖
有時(shí)候可以將多個(gè)圖形放在一個(gè)畫(huà)布中:
from highcharts import Highchart
H = Highchart(width=850, height=400)

# 3組不同的數(shù)據(jù):降雨量、氣壓、溫度
data1 = [49.9, 71.5, 106.4, 129.2, 144.0, 176.0, 135.6, 148.5, 216.4, 194.1, 95.6, 54.4]
data2 = [1016, 1016, 1015.9, 1015.5, 1012.3, 1009.5, 1009.6, 1010.2, 1013.1, 1016.9, 1018.2, 1016.7]
data3 = [7.0, 6.9, 9.5, 14.5, 18.2, 21.5, 25.2, 26.5, 23.3, 18.3, 13.9, 9.6]

options = {
 'chart': {
        'zoomType': 'xy'  # xy縮放變化
    },
    'title': {  # 標(biāo)題設(shè)置
        'text': 'Average Monthly Weather Data for Tokyo'
    },
    'subtitle': {
        'text': 'Source: WorldClimate.com'
    },
    'xAxis': [{  # x軸數(shù)據(jù)
        'categories': ['Jan', 'Feb', 'Mar', 'Apr', 'May', 'Jun',
            'Jul', 'Aug', 'Sep', 'Oct', 'Nov', 'Dec'],
        'crosshair': True   # True 表示啟用豎直方向的十字準(zhǔn)星;[true, true] 啟動(dòng)橫縱兩個(gè)軸
    }],

    # y軸有3個(gè)屬性設(shè)置
    'yAxis': [   # 列表中3個(gè)元素:溫度、降雨量、氣壓
        # 1-溫度
        { 'labels': {
            'format': '{value}°C',  #  溫度數(shù)據(jù)的單位設(shè)置
            'style': {
                'color': 'Highcharts.getOptions().colors[2]'  # 索引為2,取出第3個(gè)圖
                    }
                },
                 'title': {
                    'text': 'Temperature',  # 名字設(shè)置
                    'style': {
                        'color': 'Highcharts.getOptions().colors[2]'
                            }
                        },
                 'opposite': True  # 縱坐標(biāo)默認(rèn)在左邊,”相反opposite“取右邊的位置
        },
        # 2-降雨量
        { 'labels': {
            'format': '{value} mm',  # 單位設(shè)置
            'style': {
                'color': 'Highcharts.getOptions().colors[0]'
                    }
                },
        'gridLineWidth': 0,   # 線寬(水平方向的灰色線條)
        'title': {
            'text': 'Rainfall',   # 名字設(shè)置
            'style': {
                'color': 'Highcharts.getOptions().colors[0]'
                    }
                }
        },
        # 3-氣壓
        {'labels': {  # 海平面氣壓數(shù)據(jù)
            'format': '{value} mb',
            'style': {
                'color': 'Highcharts.getOptions().colors[1]'
                    }
                },
        'opposite': True,   # 縱坐標(biāo)右側(cè)顯示
        'gridLineWidth': 0,
        'title': {
            'text': 'Sea-Level Pressure',  # 縱軸標(biāo)題名字設(shè)置
            'style': {
                'color': 'Highcharts.getOptions().colors[1]'
                    }
                }
        }
    ],
    'tooltip': {   # 數(shù)據(jù)提示框,鼠標(biāo)放上去顯示3個(gè)坐標(biāo)的數(shù)據(jù)
        'shared': True,

    },
    'legend': {
        'layout': 'vertical',  # 圖例垂直顯示;horizontal水平顯示(并排)
        'align': 'left',  # 圖例靠左
        'x': 80,  # 圖例到y(tǒng)軸距離
        'verticalAlign': 'top',
        'y': 55,  # 圖例到x軸距離
        'floating': True,  # 圖例是否可以顯示在圖形:False表示圖例和圖形完全分開(kāi)
        'backgroundColor': "(Highcharts.theme && Highcharts.theme.legendBackgroundColor) || '#FFFFFF'"  # 圖例背景色
    },
}
H.set_dict_options(options)

# 如何繪制多個(gè)圖形
# 設(shè)置項(xiàng)options中3者順序:溫度(0)、降雨量(1)、氣壓(2)
# 添加的數(shù)據(jù)化順序和坐標(biāo)軸的順序要保持一致

H.add_data_set(data1,  # 添加數(shù)據(jù)(降雨量)-colors[0]
               'column',  # 指定圖形類(lèi)型:柱狀圖
               'Rainfall', # 名稱
               yAxis=1,
               tooltip={
                   'valueSuffix': ' mm'  # 提示數(shù)據(jù)的單位
               })

H.add_data_set(data2,  # 氣壓-colors[1]
               'spline',  # spline表示圓滑的曲線;line表示折線
               'Sea-Level Pressure',
               yAxis=2 ,
               marker={
                   'enabled': True   # 標(biāo)記:F表示虛點(diǎn);T表示實(shí)點(diǎn)
               },
               dashStyle='shortdot',  #  在圖形中直接顯示markder;設(shè)置成False則需要鼠標(biāo)放上去才會(huì)出現(xiàn)markder點(diǎn)
               tooltip={
                'valueSuffix': ' mb'
               })
H.add_data_set(data3,  # 溫度-colors[2]
               'spline',
               'Temperature',
               yAxis=0,
               tooltip={
                'valueSuffix': ' °C'
               })

H
總結(jié)
本文中我們簡(jiǎn)單的介紹了可視化庫(kù) Highcharts 的主要特點(diǎn)和4大利器,同時(shí)通過(guò) python-highcharts 繪制了多個(gè)柱狀圖的案例,我們可以看到:
Highcharts的確是非常的強(qiáng)大;如果讀者能夠很好地掌握前端語(yǔ)言JavaScript,可以更加靈活地使用Highcharts在利用 python-highcharts進(jìn)行繪圖的過(guò)程中,步驟非常清晰(5個(gè)步驟),重點(diǎn)是要掌握配置項(xiàng)的設(shè)置Higcharts能夠滿足不同需求下的繪制,繪制的圖形動(dòng)態(tài)效果非常明顯。
PS:公號(hào)內(nèi)回復(fù)「Python」即可進(jìn)入Python 新手學(xué)習(xí)交流群,一起 100 天計(jì)劃!
老規(guī)矩,兄弟們還記得么,右下角的 “在看” 點(diǎn)一下,如果感覺(jué)文章內(nèi)容不錯(cuò)的話,記得分享朋友圈讓更多的人知道!


【神秘禮包獲取方式】