
在模仿中精進數(shù)據(jù)可視化04:舊金山街道樹木分布可視化

點擊上方"藍字"關(guān)注我們
記錄? ?分享? ?成長
?本文完整代碼及數(shù)據(jù)已上傳至我的
?Github倉庫https://github.com/CNFeffery/FefferyViz
1 簡介
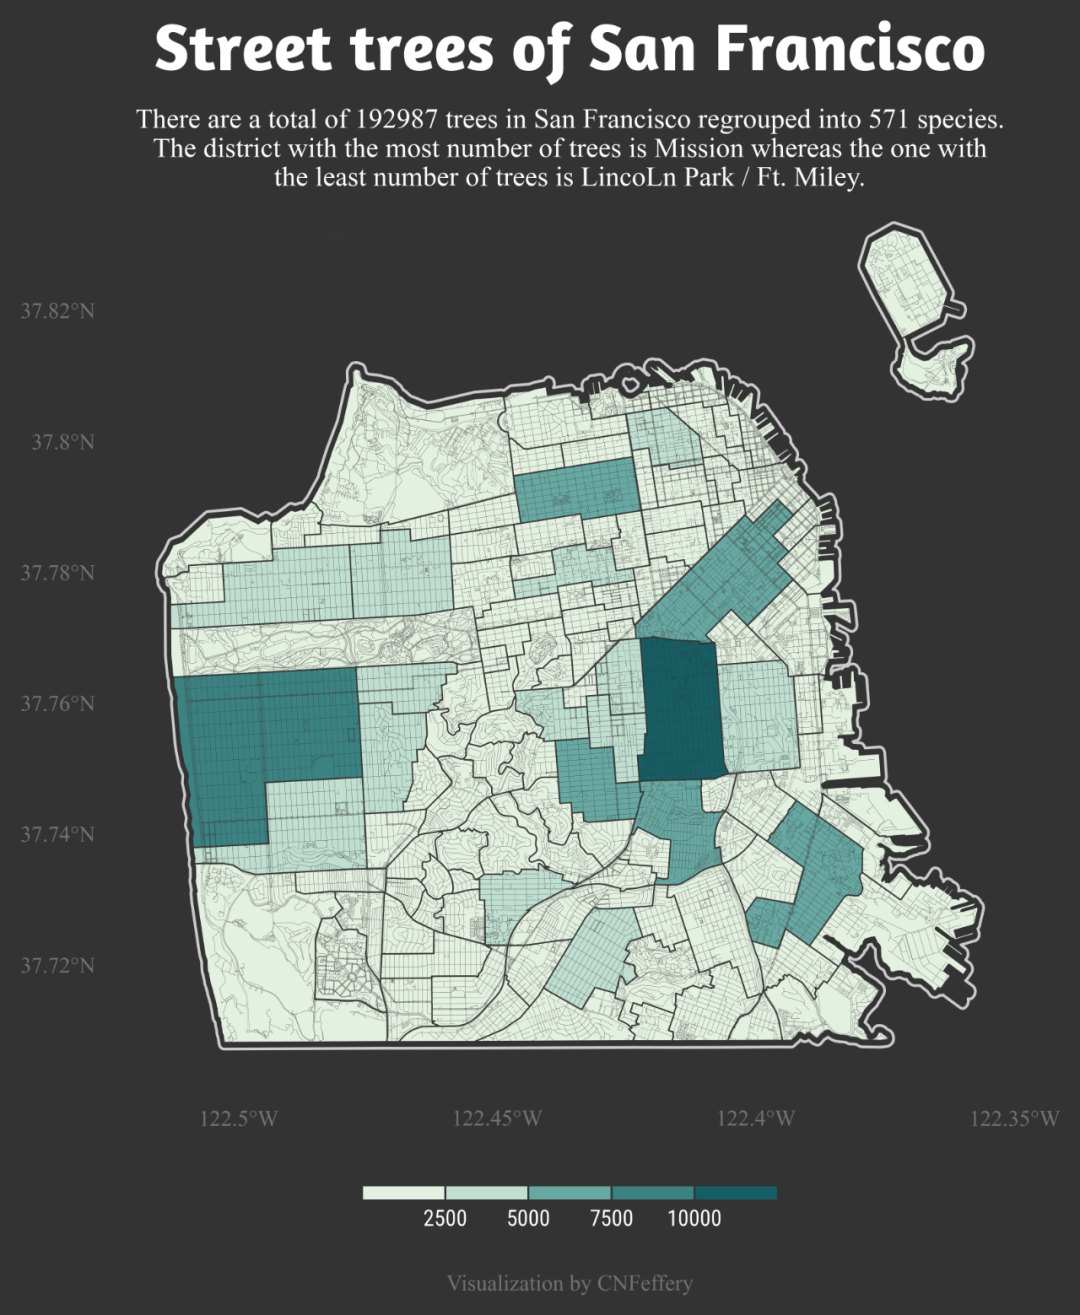
開門見山,今天我們要模仿的數(shù)據(jù)可視化作品來自?「#TidyTuesday」?活動于2020年1月28日發(fā)布的「舊金山街道樹木數(shù)據(jù)集」下的眾多參賽作品中,由Philippe Massicotte創(chuàng)作的(如圖1所示)非常受歡迎的?「Street trees of San Francisco」:
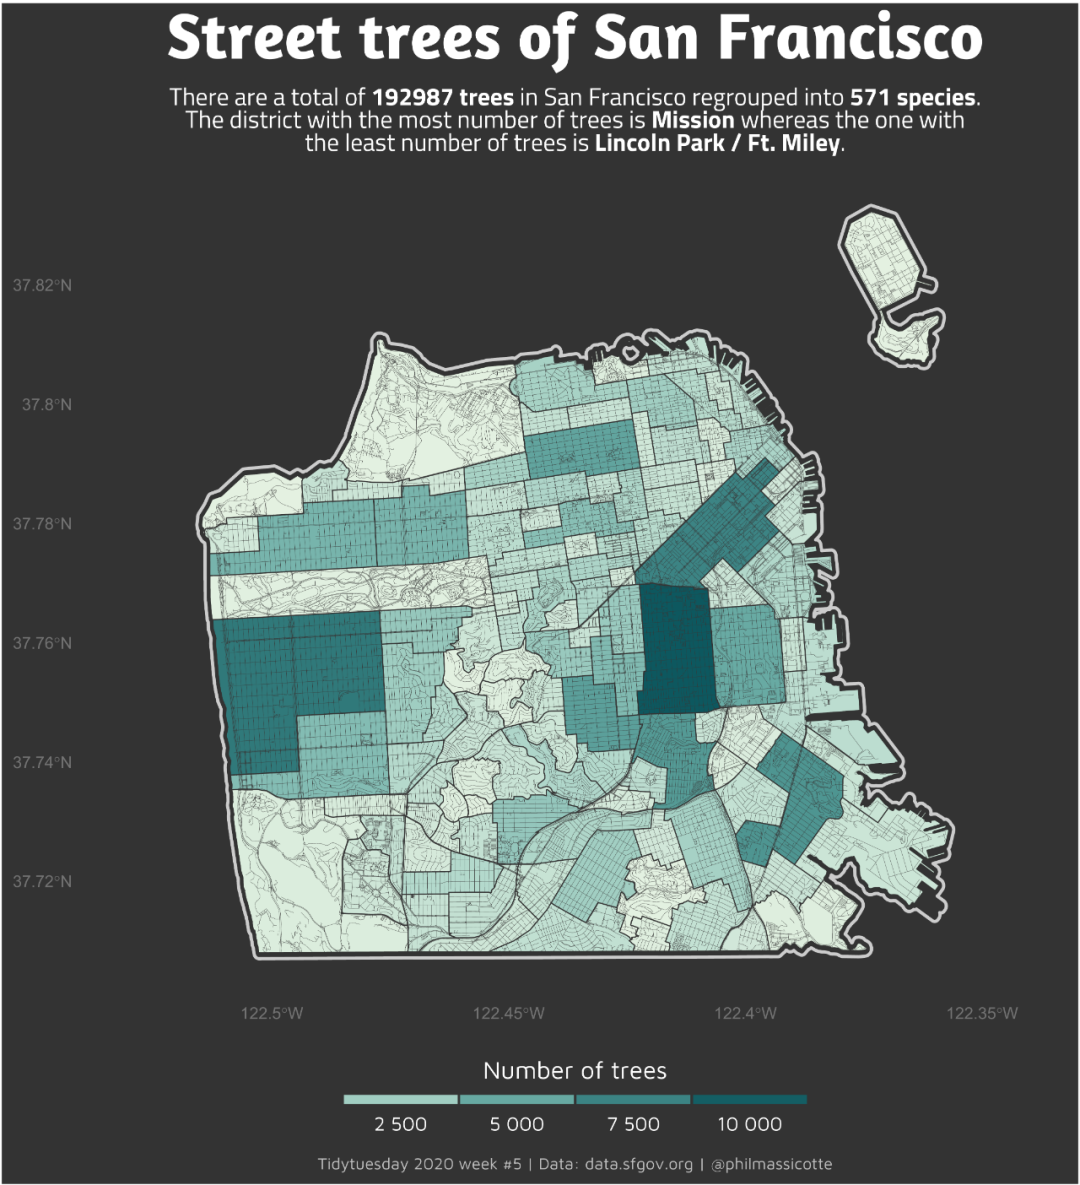
原作者使用的工具是R語言,而今天的文章內(nèi)容,我就將帶大家學習如何在Python中模仿圖1的風格進行類似數(shù)據(jù)信息的可視化展示(其實原作品有一些令人困惑的瑕疵,因此我在下文中在一些地方采用了與原作者不同的分析方式,因此最終的成品與原作品有一些不同之處)。
2 模仿過程
今天我們要模仿的這張圖,咋一看上去似乎略復雜,但如果你曾經(jīng)閱讀過我的「基于geopandas的空間數(shù)據(jù)分析」系列文章,就一下子可以在腦中將此圖構(gòu)成進行分解:
2.1 過程分解
我們仔細觀察原作品,可以get到其主要視覺元素是將統(tǒng)計出的數(shù)值映射到每個社區(qū)面色彩之上,且外圍的輪廓描邊,很明顯是整個地區(qū)對應整體的向外緩沖區(qū),再輔以道路網(wǎng),使得整張圖看起來顯得很“精密”。
結(jié)合我們手頭的數(shù)據(jù):舊金山社區(qū)「面」數(shù)據(jù)、有登記的街道樹木「點」數(shù)據(jù),至于道路網(wǎng)「線」數(shù)據(jù)我們則可以利用第三方庫osmnx進行獲取(建議利用conda install -c conda-forge osmnx進行安裝)。
將過程拆分為下列步驟:
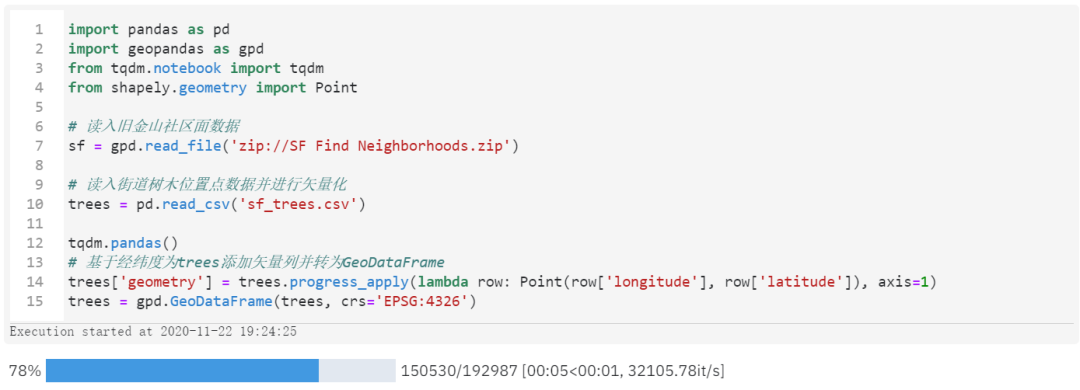
「數(shù)據(jù)準備」
首先我們需要讀入已有的數(shù)據(jù)并進行相應的矢量化:
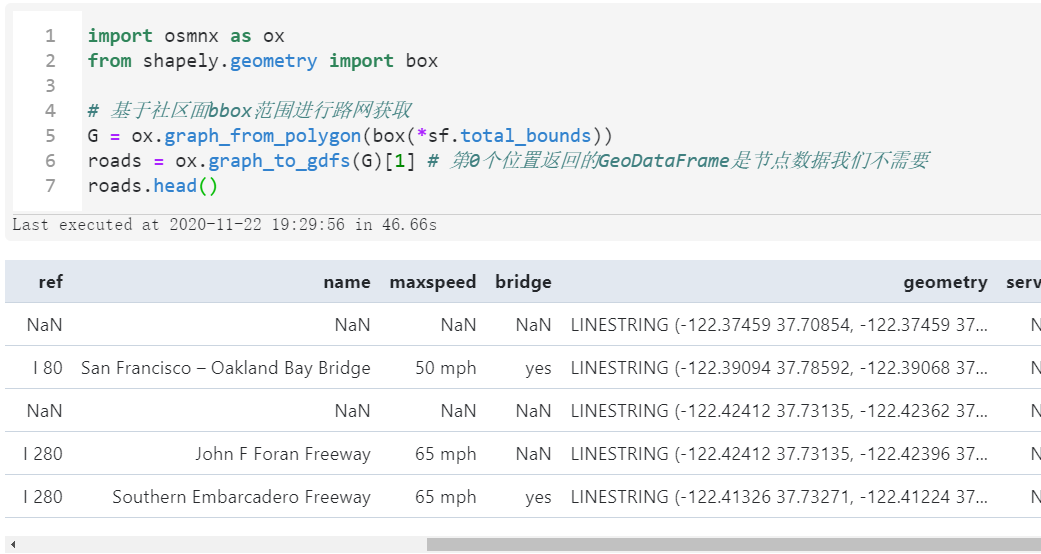
而路網(wǎng)數(shù)據(jù)我們則可以利用osmnx進行在線獲取,只需傳入我們的舊金山面數(shù)據(jù)bbox范圍,配合
osmnx進行獲取即可:
接著我們在上述數(shù)據(jù)基礎上對每個社區(qū)面內(nèi)部的街道樹木數(shù)量進行統(tǒng)計并對數(shù)據(jù)進行分箱,配上預設區(qū)間的色彩值:
#?統(tǒng)計每個社區(qū)內(nèi)部的樹木數(shù)量
sf_trees?=?\
(
????gpd
????#?空間連接
????.sjoin(left_df=sf,
???????????right_df=trees,
???????????op='contains',
???????????how='left')
????#?按照name分組計數(shù)(這里未連接到任何數(shù)的社區(qū)被
????#?記為1本質(zhì)上是錯誤的,但我們繪圖分段后這一點不影響)
????.groupby('name')
????.agg({
????????'name':?'count',
????????'geometry':?'first'
????})
????.rename(columns={'name':?'數(shù)量'})
????.reset_index(drop=False)
????#?直接轉(zhuǎn)為GeoDataFrame
????.pipe(gpd.GeoDataFrame,?crs='EPSG:4326')
)

sf_trees['顏色']?=?(
????pd
????.cut(sf_trees['數(shù)量'],?
?????????bins=[0,?2500,?5000,?7500,?10000,?max(sf_trees['數(shù)量'])],?
?????????labels=['#e4f1e1',?'#c0dfd1',?'#67a9a2',?'#3b8383',?'#145e64'])
)
最后別忘記了我們作為輪廓的緩沖區(qū)生成:
#?生成輪廓緩沖區(qū)
sf_bounds?=?gpd.GeoSeries([sf.buffer(0.001).unary_union],?crs='EPSG:4326')
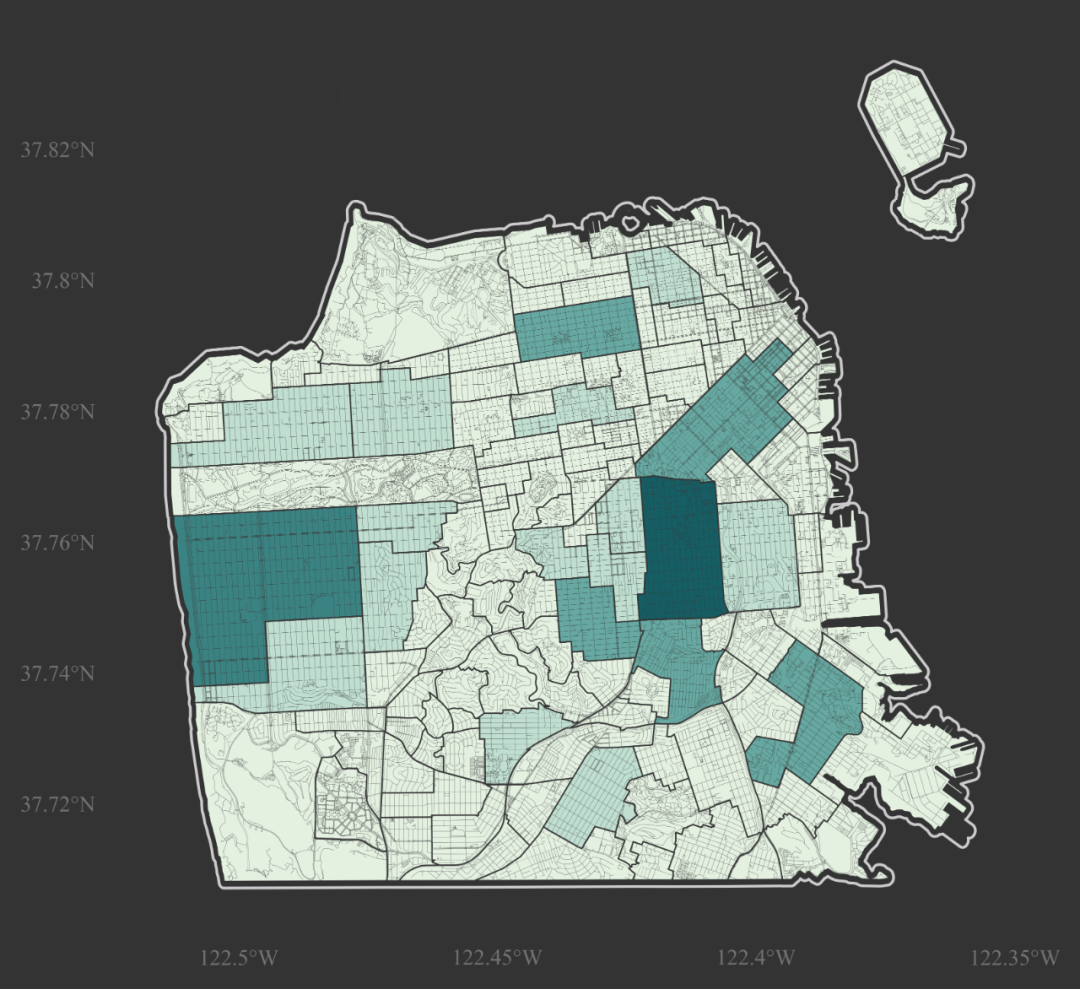
「主要視覺元素繪制」
做好這些準備后我們直接就可以先將圖像的主體元素繪制出來:
import?matplotlib.pyplot?as?plt
from?matplotlib?import?font_manager?as?fm

#?設置全局默認字體
plt.rcParams['font.sans-serif']?=?['Times?New?Roman']

fig,?ax?=?plt.subplots(figsize=(6,?6))

#?設置背景色
ax.set_facecolor('#333333')
fig.set_facecolor('#333333')

#?圖層1:緩沖區(qū)輪廓
ax?=?(
????sf_bounds
????.plot(ax=ax,?facecolor='none',?edgecolor='#cccccc',?linewidth=1)
)

#?圖層2:帶有樹木統(tǒng)計信息的社區(qū)面
ax?=?(
????sf_trees
????.plot(color=sf_trees['顏色'],?edgecolor='#333333',
??????????linewidth=0.5,?ax=ax)
)

#?圖層3:osm路網(wǎng)
ax?=?(
????roads
????.plot(linewidth=0.05,?edgecolor='#3c3d3d',
??????????ax=ax)
)

#?設置x軸
ax.set_xticks([-122.5,?-122.45,?-122.4,?-122.35])
ax.set_xticklabels(['122.5°W',?'122.45°W',?'122.4°W',?'122.35°W'])

#?設置y軸
ax.set_yticks([37.72,?37.74,?37.76,?37.78,?37.8,?37.82])
ax.set_yticklabels(['37.72°N',?'37.74°N',?'37.76°N',?'37.78°N',?'37.8°N',?'37.82°N'])

#?設置坐標軸樣式
ax.tick_params(axis='both',?labelcolor='#737373',?color='none',?labelsize=8)

#?隱藏周圍的spines線條
ax.spines['left'].set_color('none')
ax.spines['right'].set_color('none')
ax.spines['top'].set_color('none')
ax.spines['bottom'].set_color('none')

#?導出圖像
fig.savefig('圖4.png',?dpi=600,?bbox_inches='tight')
「輔助視覺元素的添加」
接下來我們只需要補充上各種點睛之筆的小元素即可,其中值得一提的是下方的圖例我們用inset_axes()插入子圖的方式靈活實現(xiàn)。
并且外部字體文件的使用也是很添彩的,我們這里就分別在「標題」和「刻度標簽」處使用到了兩種特殊的字體(你可以在開頭的Github倉庫找到我用到的所有字體文件):
fig,?ax?=?plt.subplots(figsize=(6,?6))

#?設置背景色
ax.set_facecolor('#333333')
fig.set_facecolor('#333333')

#?圖層1:緩沖區(qū)輪廓
ax?=?(
????sf_bounds
????.plot(ax=ax,?facecolor='none',?edgecolor='#cccccc',?linewidth=1)
)

#?圖層2:帶有樹木統(tǒng)計信息的社區(qū)面
ax?=?(
????sf_trees
????.plot(color=sf_trees['顏色'],?edgecolor='#333333',
??????????linewidth=0.5,?ax=ax)
)

#?圖層3:osm路網(wǎng)
ax?=?(
????roads
????.plot(linewidth=0.05,?edgecolor='#3c3d3d',
??????????ax=ax)
)

#?設置x軸
ax.set_xticks([-122.5,?-122.45,?-122.4,?-122.35])
ax.set_xticklabels(['122.5°W',?'122.45°W',?'122.4°W',?'122.35°W'])

#?設置y軸
ax.set_yticks([37.72,?37.74,?37.76,?37.78,?37.8,?37.82])
ax.set_yticklabels(['37.72°N',?'37.74°N',?'37.76°N',?'37.78°N',?'37.8°N',?'37.82°N'])

#?設置坐標軸樣式
ax.tick_params(axis='both',?labelcolor='#737373',?color='none',?labelsize=8)

#?隱藏周圍的spines線條
ax.spines['left'].set_color('none')
ax.spines['right'].set_color('none')
ax.spines['top'].set_color('none')
ax.spines['bottom'].set_color('none')

#?以插入子圖的方式添加下方圖例
ax_bar?=?ax.inset_axes((0.25,?-0.12,?0.5,?0.015))
ax_bar.set_facecolor('#333333')
ax_bar.spines['left'].set_color('none')
ax_bar.spines['right'].set_color('none')
ax_bar.spines['top'].set_color('none')
ax_bar.spines['bottom'].set_color('none')

ax_bar.bar(range(5),?[1]*5,?width=0.975,?color=['#e4f1e1',?'#c0dfd1',?'#67a9a2',?'#3b8383',?'#145e64'])
ax_bar.set_yticks([])
ax_bar.set_xticks([i+0.5?for?i?in?range(4)])
ax_bar.set_xticklabels(['2500',?'5000',?'7500',?'10000'],?
???????????????????????fontdict={'fontproperties':?fm.FontProperties(fname="RobotoCondensed-Regular.ttf")})
ax_bar.tick_params(color='none',?labelcolor='#ffffff',?labelsize=8,?pad=0)

ax.set_title('Street?trees?of?San?Francisco',?
?????????????fontsize=24,
?????????????color='#ffffff',
?????????????pad=40,
?????????????fontproperties=fm.FontProperties(fname="Amaranth-Bold.ttf"))

ax.text(0.5,?1.08,?'''There?are?a?total?of?192987?trees?in?San?Francisco?regrouped?into?571?species.
The?district?with?the?most?number?of?trees?is?Mission?whereas?the?one?with
the?least?number?of?trees?is?LincoLn?Park?/?Ft.?Miley.''',?transform=ax.transAxes,?ma='center',
????????ha='center',?va='top',?color='#ffffff')

ax.text(0.5,?-0.22,?'Visualization?by?CNFeffery',?fontsize=8,
????????color='#737373',?ha='center',?transform=ax.transAxes)

#?導出圖像
fig.savefig('圖5.png',?dpi=600,?bbox_inches='tight')
以上就是本文的全部內(nèi)容,歡迎在評論區(qū)與我進行討論~

加入我們的知識星球【Python大數(shù)據(jù)分析】
愛上數(shù)據(jù)分析!

Python大數(shù)據(jù)分析
data creates?value
掃碼關(guān)注我們