
ES06# Filebeat采集原理與監(jiān)控指標梳理
引言
當Filebeat作為日志采集的agent鋪開時,對其自身agent的監(jiān)控以確保穩(wěn)定就尤為的重要,有幾種方式監(jiān)控agent運行。
第一種 filebeat自己將監(jiān)控埋點上報 第二種 filebeat暴露埋點接口,另外一個agent定時采集后上報
第二種能夠監(jiān)測filebeat的進程狀況,例如官方提供的Metricbeat,也可以自己實現(xiàn)agent上報監(jiān)控指標。本文就其如何監(jiān)控Filebeat以及指標含義進行梳理,主要內(nèi)容有:
一、filebeat日志采集原理 二、filebeat暴露endpoint 三、beat監(jiān)控指標 四、filebeat監(jiān)控指標 五、libbeat監(jiān)控指標 六、監(jiān)控指標完整示例
filebeat采集原理如下圖所示,數(shù)據(jù)流從左到右流轉(zhuǎn)。
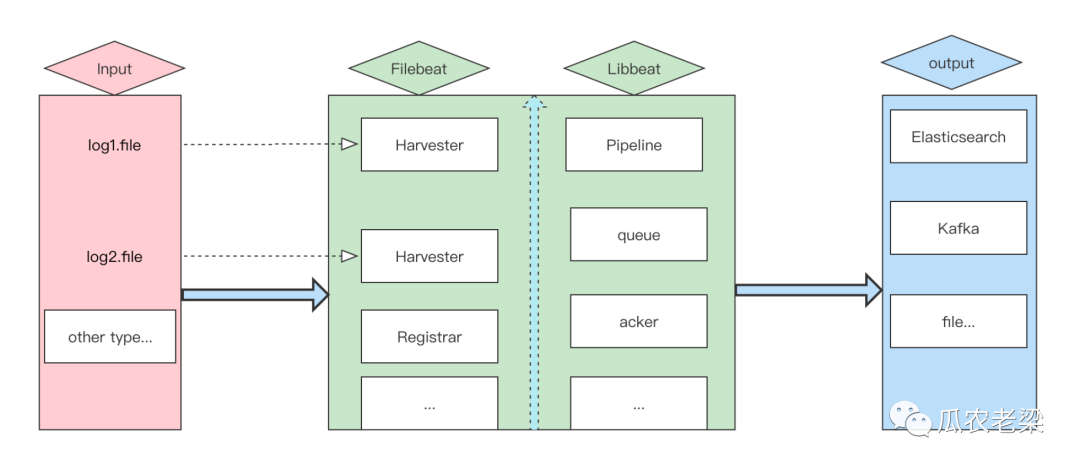
組件描述:
Input:負責輸入源,每啟動一個文件會創(chuàng)建一個Harvester負責讀取
Filebeat.Harvester:負責文件數(shù)據(jù)的讀取
Filebeat.Registrar:負責記錄文件以及對應(yīng)的偏移量,記錄在registry/filebeat/log.json中,格式如下所示,filebeat啟動時會讀取該文件
{"k":"filebeat::logs::native::4349261-16777229","v":{"id":"native::4349261-16777229","prev_id":"","source":"/Users/admin/logs/csp/sentinel-server.log","offset":1150,"type":"log","identifier_name":"native","timestamp":[2062583329080,1648206113],"ttl":-1,"FileStateOS":{"inode":4349261,"device":16777229}}}
Libbeat.Pipeline:負責管理Harvester的寫入、緩存、輸出等,queue事件隊列(緩存or磁盤),acker輸出后的確認回調(diào)
1.HTTP endpoint
在filebeat.yml文件中開啟http.enabled,默認端口為5066,本文將其修改成了5067。
#Enable?the?HTTP?endpoint?to?allow?external?collection?of?monitoring?data
http.enabled:?true
http.port:?5067
2.filebeat基本信息
請求命令
http://localhost:5067/?pretty
返回示例
{
??"beat":?"filebeat",
??"hostname":?"M-C02GL1NTQ05P",
??"name":?"M-C02GL1NTQ05P",
??"uuid":?"d9823622-46a6-4f4d-8dda-f2efeee82e35",
??"version":?"7.15.2"
}
指標說明
| 指標 | 說明 |
|---|---|
| beat | beat的類型,本文為filebeat |
| hostname | 主機名稱 |
| uuid | filebeat的uuid |
| version | filebeat的版本 |
另外下面命令返回了filebeat的眾多指標信息,下文中根據(jù)不同的類型分拆梳理走查。
http://localhost:5067/stats?pretty
beat為通用模塊,filebeat繼承該模塊,側(cè)重于整體概覽。主要包括:基本信息、CPU運行狀態(tài)信息、緩存指標信息、運行時指標。
1.基本信息
返回示例
"info":?{
??????"ephemeral_id":?"7ab1d8ba-098d-46a8-a116-bfc350493f40",
??????"uptime":?{
????????"ms":?623789
??????},
??????"version":?"7.15.2"
?}
指標說明
| 指標 | 說明 |
|---|---|
| ephemeral_id | 臨時ID用于標識此agent,在重啟后會變化 |
| uptime | agent的運行時間 |
| version | agent的版本信息 |
2.CPU運行狀態(tài)
返回示例
"cpu":?{
??????"system":?{
????????"ticks":?17,
????????"time":?{
??????????"ms":?737
????????}
??????},
??????"total":?{
????????"ticks":?34,
????????"time":?{
??????????"ms":?1464
????????},
????????"value":?34
??????},
??????"user":?{
????????"ticks":?17,
????????"time":?{
??????????"ms":?727
????????}
??????}
?}
指標說明
| 指標 | 說明 |
|---|---|
| system.ticks | 運行CPU處于系統(tǒng)狀態(tài)的時間 |
| user.ticks | 運行CPU處于用戶狀態(tài)的時間 |
| total.ticks | 運行CPU處于系統(tǒng)狀態(tài)和用戶狀態(tài)總的時間 |
3.緩存指標
返回示例
"memstats":?{
??"gc_next":?23418608,
??"memory_alloc":?16693968,
??"memory_sys":?76366856,
??"memory_total":?181068824,
??"rss":?46481408
}
指標說明
| 指標 | 說明 |
|---|---|
| gc_next | 下一次GC目標堆的大小 |
| memory_alloc | Go語言堆空間分配的字節(jié)數(shù) |
| memory_sys | 服務(wù)當前使用系統(tǒng)的內(nèi)存大小 |
| memory_total | 服務(wù)運行至今總共分配的堆內(nèi)存大小(只遞增) |
| rss | Resident Set Size(常駐內(nèi)存大小)表示進程使用了多少內(nèi)存 |
4.運行時指標
返回示例
"runtime":?{
??"goroutines":?31
}
指標說明
| 指標 | 說明 |
|---|---|
| goroutines | 運行時調(diào)度管理“線程池”大小 |
1.events指標
返回示例
"events":?{
??????"active":?0,
??????"added":?3,
??????"done":?3
????}
指標說明
| 指標 | 說明 |
|---|---|
| active | 正在活動事件的數(shù)量 |
| added | 已添加事件的數(shù)量 |
| done | 已完成事件的數(shù)量 |
備注:通過events了解filebeat的吞吐情況。
2.harvester指標
返回示例
"harvester":?{
??????"closed":?0,
??????"open_files":?0,
??????"running":?0,
??????"skipped":?0,
??????"started":?0
????}
指標說明
| 指標 | 說明 |
|---|---|
| closed | harvester已關(guān)閉的數(shù)量 |
| open_files | 已打開的文件數(shù)量 |
| running | 正在harvester的數(shù)量 |
| skipped | harvester已忽略的數(shù)量 |
| started | harvester已啟動的數(shù)量 |
備注:每個文件都會通過一個harvester讀取,通過harvester監(jiān)控讀取文件數(shù)量情況。
3.input指標
返回示例
"input":?{
??????"log":?{
????????"files":?{
??????????"renamed":?0,
??????????"truncated":?0
????????}
??????},
??????"netflow":?{
????????"flows":?0,
????????"packets":?{
??????????"dropped":?0,
??????????"received":?0
????????}
??????}
指標說明
| 指標 | 說明 |
|---|---|
| files.renamed | 被改名文件的數(shù)量 |
| files.truncated | 被截斷文件的數(shù)量 |
| netflow.flows | IP網(wǎng)絡(luò)流量統(tǒng)計 |
| packets.dropped | 丟棄的分組(packets)數(shù)量 |
| packets.received | 接受的分組(packets)數(shù)量 |
備注:每個文件都會通過一個harvester讀取,通過harvester監(jiān)控讀取文件數(shù)量情況,netflow網(wǎng)絡(luò)數(shù)據(jù)包分析工具。
libbeat為公共模塊,filebeat繼承了該模塊。可以output的速率、pipeline中隊列積壓以及registrar記錄位移情況。
1.config指標
返回示例
"config":?{
??????"module":?{
????????"running":?0,
????????"starts":?0,
????????"stops":?0
??????},
??????"reloads":?1,
??????"scans":?62
????}
指標說明
| 指標 | 說明 |
|---|---|
| module.running | 正在運行組件的數(shù)量 |
| module.starts | 已啟動組件的數(shù)量 |
| module.stops | 已停止組件的數(shù)量 |
| reloads | 加載配置文件的數(shù)量 |
| scans | 掃描配置文件的數(shù)量 |
2.output指標
返回示例
"output":?{
??????"events":?{
????????"acked":?0,
????????"active":?0,
????????"batches":?0,
????????"dropped":?0,
????????"duplicates":?0,
????????"failed":?0,
????????"toomany":?0,
????????"total":?0
??????},
??????"read":?{
????????"bytes":?0,
????????"errors":?0
??????},
??????"type":?"elasticsearch",
??????"write":?{
????????"bytes":?0,
????????"errors":?0
??????}
????}
指標說明
| 指標 | 說明 |
|---|---|
| events.acked | 確認事件數(shù)量 |
| events.active | 活動事件數(shù)量 |
| events.dropped | 丟棄事件數(shù)量 |
| events.failed | 失敗事件數(shù)量 |
| read.bytes | 讀入的字節(jié)數(shù) |
| write.bytes | 寫出的字節(jié)數(shù) |
3.pipeline指標
返回示例
"pipeline":?{
??????"clients":?1,
??????"events":?{
????????"active":?0,
????????"dropped":?0,
????????"failed":?0,
????????"filtered":?3,
????????"published":?0,
????????"retry":?0,
????????"total":?3
??????},
??????"queue":?{
????????"acked":?0,
????????"max_events":?4096
??????}
????}
指標說明
| 指標 | 說明 |
|---|---|
| clients | 連接到pipeline的client數(shù)量 |
| queue.acked | queue中已被output確認的數(shù)量 |
| queue.max_events | queue中存儲事件的最大數(shù)量 |
備注:Filebeat使用內(nèi)部queue存儲publishing前的事件,這些事件會被outputs消費。
4.registrar指標
返回示例
"registrar":?{
????"states":?{
??????"cleanup":?0,
??????"current":?3,
??????"update":?3
????},
????"writes":?{
??????"fail":?0,
??????"success":?3,
??????"total":?3
????}
??}
指標說明
| 指標 | 說明 |
|---|---|
| states.cleanup | 被清理registrar的數(shù)量 |
| states.current | 正在運行registrar的數(shù)量 |
| states.update | 已更新registrar的數(shù)量 |
| writes.fail | 寫入registry文件失敗的數(shù)量 |
| writes.success | 寫入registry文件成功的數(shù)量 |
備注:registrar會記錄日志文件采集的位移。
5.CPU負載指標
返回示例
"system":?{
????"cpu":?{
??????"cores":?8
????},
????"load":?{
??????"1":?2.749,
??????"15":?2.5459,
??????"5":?2.5659,
??????"norm":?{
????????"1":?0.3436,
????????"15":?0.3182,
????????"5":?0.3207
??????}
????}
指標說明
| 指標 | 說明 |
|---|---|
| cores | CPU核數(shù) |
| load | CPU負載 |
指標端點
http://localhost:5067/stats?pretty
返回示例
{
??"beat":?{
????"cpu":?{
??????"system":?{
????????"ticks":?17,
????????"time":?{
??????????"ms":?737
????????}
??????},
??????"total":?{
????????"ticks":?34,
????????"time":?{
??????????"ms":?1464
????????},
????????"value":?34
??????},
??????"user":?{
????????"ticks":?17,
????????"time":?{
??????????"ms":?727
????????}
??????}
????},
????"info":?{
??????"ephemeral_id":?"7ab1d8ba-098d-46a8-a116-bfc350493f40",
??????"uptime":?{
????????"ms":?623789
??????},
??????"version":?"7.15.2"
????},
????"memstats":?{
??????"gc_next":?23418608,
??????"memory_alloc":?16693968,
??????"memory_sys":?76366856,
??????"memory_total":?181068824,
??????"rss":?46481408
????},
????"runtime":?{
??????"goroutines":?31
????}
??},
??"filebeat":?{
????"events":?{
??????"active":?0,
??????"added":?3,
??????"done":?3
????},
????"harvester":?{
??????"closed":?0,
??????"open_files":?0,
??????"running":?0,
??????"skipped":?0,
??????"started":?0
????},
????"input":?{
??????"log":?{
????????"files":?{
??????????"renamed":?0,
??????????"truncated":?0
????????}
??????},
??????"netflow":?{
????????"flows":?0,
????????"packets":?{
??????????"dropped":?0,
??????????"received":?0
????????}
??????}
????}
??},
??"libbeat":?{
????"config":?{
??????"module":?{
????????"running":?0,
????????"starts":?0,
????????"stops":?0
??????},
??????"reloads":?1,
??????"scans":?62
????},
????"output":?{
??????"events":?{
????????"acked":?0,
????????"active":?0,
????????"batches":?0,
????????"dropped":?0,
????????"duplicates":?0,
????????"failed":?0,
????????"toomany":?0,
????????"total":?0
??????},
??????"read":?{
????????"bytes":?0,
????????"errors":?0
??????},
??????"type":?"elasticsearch",
??????"write":?{
????????"bytes":?0,
????????"errors":?0
??????}
????},
????"pipeline":?{
??????"clients":?1,
??????"events":?{
????????"active":?0,
????????"dropped":?0,
????????"failed":?0,
????????"filtered":?3,
????????"published":?0,
????????"retry":?0,
????????"total":?3
??????},
??????"queue":?{
????????"acked":?0,
????????"max_events":?4096
??????}
????}
??},
??"registrar":?{
????"states":?{
??????"cleanup":?0,
??????"current":?3,
??????"update":?3
????},
????"writes":?{
??????"fail":?0,
??????"success":?3,
??????"total":?3
????}
??},
??"system":?{
????"cpu":?{
??????"cores":?8
????},
????"load":?{
??????"1":?2.749,
??????"15":?2.5459,
??????"5":?2.5659,
??????"norm":?{
????????"1":?0.3436,
????????"15":?0.3182,
????????"5":?0.3207
??????}
????}
??}
}
備注:官方參考文檔
https://www.elastic.co/guide/en/beats/filebeat/current/http-endpoint.html

#?Monitor?Filebeat
https://www.elastic.co/guide/en/beats/filebeat/current/monitoring.html#monitoring

#?Filebeat?internal?collection
https://www.elastic.co/guide/en/beats/filebeat/current/configuration-monitor.html

#?Metricbeat?collection
https://www.elastic.co/guide/en/beats/filebeat/current/monitoring-metricbeat-collection.html