Freqtrade 是一個(gè)用?Python?編寫的免費(fèi)開源加密貨幣交易機(jī)器人。它旨在支持所有主要交易所并通過 Telegram 或 webUI 進(jìn)行控制。功能包含回測(cè)、繪圖和資金管理工具以及通過機(jī)器學(xué)習(xí)的策略優(yōu)化。
目前支持的交易所:
特性:
1. 基于 Python 3.8+:適用于任何操作系統(tǒng) - Windows、macOS 和 Linux。
2. 持久性:持久性是通過 sqlite 實(shí)現(xiàn)的。
3. Dry-run:不花錢運(yùn)行機(jī)器人。
4. 回測(cè):模擬買入/賣出策略。
5. 通過機(jī)器學(xué)習(xí)進(jìn)行策略優(yōu)化:使用機(jī)器學(xué)習(xí)通過真實(shí)的交易所數(shù)據(jù)優(yōu)化買入/賣出策略參數(shù)。
6. 邊緣頭寸規(guī)模計(jì)算您的勝率、風(fēng)險(xiǎn)回報(bào)率、最佳止損位并在為每個(gè)特定市場(chǎng)建立頭寸之前調(diào)整頭寸規(guī)模。
7. 白名單加密貨幣:選擇你要交易的加密貨幣或使用動(dòng)態(tài)白名單。
8. 黑名單加密貨幣:選擇你想要避免的加密貨幣。
9. 內(nèi)置 WebUI:內(nèi)置 Web UI 來管理你的機(jī)器人。
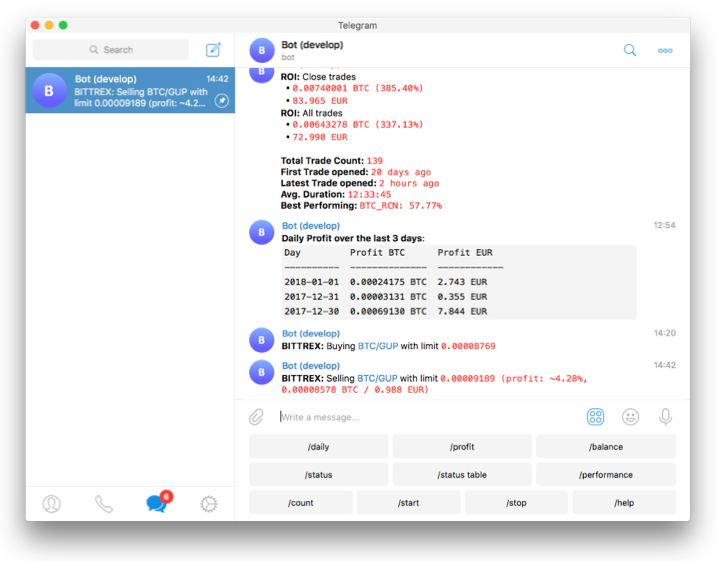
10. 可通過 Telegram管理:使用 Telegram 管理機(jī)器人。
11. 以法定貨幣顯示盈虧:以法定貨幣顯示你的盈虧。
12. 表現(xiàn)狀態(tài)報(bào)告:提供你當(dāng)前交易的表現(xiàn)狀態(tài)。
開始之前,你要確保Python和pip已經(jīng)成功安裝在電腦上,如果沒有,可以訪問這篇文章:超詳細(xì)Python安裝指南?進(jìn)行安裝。
(可選1)?如果你用Python的目的是數(shù)據(jù)分析,可以直接安裝Anaconda:Python數(shù)據(jù)分析與挖掘好幫手—Anaconda,它內(nèi)置了Python和pip.
(可選2)?此外,推薦大家用VSCode編輯器,它有許多的優(yōu)點(diǎn):Python 編程的最好搭檔—VSCode 詳細(xì)指南。
在Linux/MacOS下,三行命令就能完成安裝:
git clone?-b develop https://github.com/freqtrade/freqtrade.git
cd?freqtrade
./setup.sh --install
如果你無法克隆此項(xiàng)目,請(qǐng)?jiān)赑ython實(shí)用寶典公眾號(hào)后臺(tái)回復(fù):freqtrade?下載。
Windows環(huán)境下打開Cmd(開始—運(yùn)行—CMD),輸入命令安裝依賴:
git clone https://github.com/freqtrade/freqtrade.git
cd freqtrade
#?安裝ta-lib
pip install build_helpers/TA_Lib-0.4.24-cp38-cp38-win_amd64.whl
pip install -r requirements.txt
pip install -e .
freqtrade
請(qǐng)注意,此處安裝ta-lib時(shí)項(xiàng)目方提供了python3.8/3.9/3.10,其他Python版本請(qǐng)自行搜索下載。
輸入freqtrade時(shí),顯示以下信息說明安裝成功:
(freqtrade) D:\CODE\trader\freqtrade>freqtrade
2022-02-17 19:40:50,174 - freqtrade - ERROR - Usage of Freqtrade requires a subcommand to be specified.
To have the bot executing trades in?live/dry-run modes, depending on the value of the `dry_run` setting in?the config, run Freqtrade as `freqtrade trade [options...]`.
To see the full list of options available, please use `freqtrade --help` or `freqtrade <command> --help`.
下面教你如何開發(fā)一個(gè)簡(jiǎn)單的交易策略。
一個(gè)策略文件往往包含這些東西:
指標(biāo)
購(gòu)買規(guī)則
賣出規(guī)則
建議最低投資回報(bào)率
強(qiáng)烈推薦止損
Freqtrade使用 Pandas 作為基礎(chǔ)數(shù)據(jù)結(jié)構(gòu),它底層的OHLCV都是以Dataframe的格式存儲(chǔ)的。
Dataframe數(shù)據(jù)流中每一行數(shù)據(jù)代表圖表上的一根K線,最新的K線始終是數(shù)據(jù)庫(kù)中最后一根。
dataframe.head()
???????????????????????date open high low close volume
0?2021-11-09?23:25:00+00:00??67279.67??67321.84??67255.01??67300.97???44.62253
1?2021-11-09?23:30:00+00:00??67300.97??67301.34??67183.03??67187.01???61.38076
2?2021-11-09?23:35:00+00:00??67187.02??67187.02??67031.93??67123.81??113.42728
3?2021-11-09?23:40:00+00:00??67123.80??67222.40??67080.33??67160.48???78.96008
4?2021-11-09?23:45:00+00:00??67160.48??67160.48??66901.26??66943.37??111.39292
Pandas 提供了計(jì)算指標(biāo)的快速方法。為了從這種速度中受益,建議不要使用循環(huán),而是使用矢量化方法。
矢量化操作在整個(gè)數(shù)據(jù)范圍內(nèi)執(zhí)行計(jì)算,因此,與遍歷每一行相比,在計(jì)算指標(biāo)時(shí)要快得多。
dataframe.loc[(dataframe['rsi'] > 30), 'buy'] = 1
類似于上面這樣的賦值方法,會(huì)自動(dòng)設(shè)置rsi大于30的數(shù)據(jù)的buy列的值為1。
買入規(guī)則
def?populate_buy_trend(self, dataframe: DataFrame, metadata: dict)?-> DataFrame:
????"""
????Based on TA indicators, populates the buy signal for the given dataframe
????:param dataframe: DataFrame populated with indicators
????:param metadata: Additional information, like the currently traded pair
????:return: DataFrame with buy column
????"""
????dataframe.loc[
????????(
????????????(qtpylib.crossed_above(dataframe['rsi'], 30)) & # Signal: RSI crosses above 30
????????????(dataframe['tema'] <= dataframe['bb_middleband']) & # Guard
????????????(dataframe['tema'] > dataframe['tema'].shift(1)) & # Guard
????????????(dataframe['volume'] > 0) # Make sure Volume is not 0
????????),
????????'buy'] = 1

????return?dataframe
請(qǐng)注意,一定要不修改并返回"open", "high", "low", "close", "volume"列,這些是基礎(chǔ)行情數(shù)據(jù),如果返回錯(cuò)誤的數(shù)據(jù)將可能會(huì)導(dǎo)致一些奇怪?jǐn)?shù)據(jù)的產(chǎn)生。
如上所示的方法中,符合條件的數(shù)據(jù)的buy值會(huì)被設(shè)為1代表買入,否則為0或nan值。
賣出規(guī)則
def?populate_sell_trend(self, dataframe: DataFrame, metadata: dict)?-> DataFrame:
????"""
????Based on TA indicators, populates the sell signal for the given dataframe
????:param dataframe: DataFrame populated with indicators
????:param metadata: Additional information, like the currently traded pair
????:return: DataFrame with buy column
????"""
????dataframe.loc[
????????(
????????????(qtpylib.crossed_above(dataframe['rsi'], 70)) & # Signal: RSI crosses above 70
????????????(dataframe['tema'] > dataframe['bb_middleband']) & # Guard
????????????(dataframe['tema'] < dataframe['tema'].shift(1)) & # Guard
????????????(dataframe['volume'] > 0) # Make sure Volume is not 0
????????),
????????'sell'] = 1
????return?dataframe
與買入類似,這里不贅述了。
最小投資回報(bào)率
在類中增加這個(gè)初始化變量,能控制投資回報(bào)率:
minimal_roi = {
????"40": 0.0,
????"30": 0.01,
????"20": 0.02,
????"0": 0.04
}
上述配置意味著:
此處的計(jì)算包含費(fèi)用。
要完全禁用 ROI,請(qǐng)將其設(shè)置為一個(gè)非常高的數(shù)字:
minimal_roi = {
????"0": 100
}
雖然從技術(shù)上講并沒有完全禁用,但一旦交易達(dá)到 10000% 利潤(rùn),它就會(huì)賣出。
止損
強(qiáng)烈建議設(shè)置止損,以保護(hù)資金免受不利的劇烈波動(dòng)。
設(shè)置 10% 止損的示例:
一個(gè)完整代碼如下:
上滑查看更多代碼
# pragma pylint: disable=missing-docstring, invalid-name, pointless-string-statement
# flake8: noqa: F401
# isort: skip_file
# --- Do not remove these libs ---
from?re import?A
import?numpy as?np # noqa
import?pandas as?pd # noqa
from?pandas import?DataFrame

from?freqtrade.strategy import?(BooleanParameter, CategoricalParameter, DecimalParameter,
????????????????????????????????IStrategy, IntParameter)

# --------------------------------
# 你自己所需要的模塊放在這里
import?talib.abstract as?ta
import?freqtrade.vendor.qtpylib.indicators as?qtpylib


# This class is a sample. Feel free to customize it.
class?SampleStrategy(IStrategy):
????"""
????This is a sample strategy to inspire you.
????More information in https://www.freqtrade.io/en/latest/strategy-customization/
????You can:
????????:return: a Dataframe with all mandatory indicators for the strategies
????- Rename the class name (Do not forget to update class_name)
????- Add any methods you want to build your strategy
????- Add any lib you need to build your strategy
????You must keep:
????- the lib in the section "Do not remove these libs"
????- the methods: populate_indicators, populate_buy_trend, populate_sell_trend
????You should keep:
????- timeframe, minimal_roi, stoploss, trailing_*
????"""
????# Strategy interface version - allow new iterations of the strategy interface.
????# Check the documentation or the Sample strategy to get the latest version.
????INTERFACE_VERSION = 2

????# 設(shè)定最小投資回報(bào)
????minimal_roi = {
????????"60": 0.01,
????????"30": 0.02,
????????"0": 0.04
????}

????# 止損
????stoploss = -0.10

????# 指標(biāo)參數(shù)
????buy_rsi = IntParameter(low=1, high=50, default=30, space='buy', optimize=True, load=True)
????sell_rsi = IntParameter(low=50, high=100, default=70, space='sell', optimize=True, load=True)

????# K線時(shí)間
????timeframe = '5m'

????# 在新K線出現(xiàn)時(shí)執(zhí)行
????process_only_new_candles = False

????# These values can be overridden in the "ask_strategy" section in the config.
????use_sell_signal = True
????sell_profit_only = False
????ignore_roi_if_buy_signal = False

????# 預(yù)準(zhǔn)備K線數(shù)
????startup_candle_count: int = 30

????# 下單類型
????order_types = {
????????'buy': 'limit',
????????'sell': 'limit',
????????'stoploss': 'market',
????????'stoploss_on_exchange': False
????}

????# 訂單有效時(shí)間(gtc: 除非取消否則一直有效)
????order_time_in_force = {
????????'buy': 'gtc',
????????'sell': 'gtc'
????}

????plot_config = {
????????'main_plot': {
????????????'tema': {},
????????????'sar': {'color': 'white'},
????????},
????????'subplots': {
????????????"MACD": {
????????????????'macd': {'color': 'blue'},
????????????????'macdsignal': {'color': 'orange'},
????????????},
????????????"RSI": {
????????????????'rsi': {'color': 'red'},
????????????}
????????}
????}

????def?informative_pairs(self):
????????"""
????????Define additional, informative pair/interval combinations to be cached from the exchange.
????????These pair/interval combinations are non-tradeable, unless they are part
????????of the whitelist as well.
????????For more information, please consult the documentation
????????:return: List of tuples in the format (pair, interval)
????????????Sample: return [("ETH/USDT", "5m"),
????????????????????????????("BTC/USDT", "15m"),
????????????????????????????]
????????"""
????????return?[]

????def?populate_indicators(self, dataframe: DataFrame, metadata: dict)?-> DataFrame:
????????"""
????????Adds several different TA indicators to the given DataFrame
????????Performance Note: For the best performance be frugal on the number of indicators
????????you are using. Let uncomment only the indicator you are using in your strategies
????????or your hyperopt configuration, otherwise you will waste your memory and CPU usage.
????????:param dataframe: Dataframe with data from the exchange
????????:param metadata: Additional information, like the currently traded pair
????????:return: a Dataframe with all mandatory indicators for the strategies
????????"""

????????# Momentum Indicators
????????# ------------------------------------

????????dataframe['adx'] = ta.ADX(dataframe)
????????dataframe['rsi'] = ta.RSI(dataframe)
????????stoch_fast = ta.STOCHF(dataframe)
????????dataframe['fastd'] = stoch_fast['fastd']
????????dataframe['fastk'] = stoch_fast['fastk']

????????# MACD
????????macd = ta.MACD(dataframe)
????????dataframe['macd'] = macd['macd']
????????dataframe['macdsignal'] = macd['macdsignal']
????????dataframe['macdhist'] = macd['macdhist']

????????# MFI
????????dataframe['mfi'] = ta.MFI(dataframe)

????????# Bollinger Bands
????????bollinger = qtpylib.bollinger_bands(qtpylib.typical_price(dataframe), window=20, stds=2)
????????dataframe['bb_lowerband'] = bollinger['lower']
????????dataframe['bb_middleband'] = bollinger['mid']
????????dataframe['bb_upperband'] = bollinger['upper']
????????dataframe["bb_percent"] = (
????????????(dataframe["close"] - dataframe["bb_lowerband"]) /
????????????(dataframe["bb_upperband"] - dataframe["bb_lowerband"])
????????)
????????dataframe["bb_width"] = (
????????????(dataframe["bb_upperband"] - dataframe["bb_lowerband"]) / dataframe["bb_middleband"]
????????)

????????# Parabolic SAR
????????dataframe['sar'] = ta.SAR(dataframe)

????????# TEMA - Triple Exponential Moving Average
????????dataframe['tema'] = ta.TEMA(dataframe, timeperiod=9)

????????hilbert = ta.HT_SINE(dataframe)
????????dataframe['htsine'] = hilbert['sine']
????????dataframe['htleadsine'] = hilbert['leadsine']

????????return?dataframe

????def?populate_buy_trend(self, dataframe: DataFrame, metadata: dict)?-> DataFrame:
????????"""
????????Based on TA indicators, populates the buy signal for the given dataframe
????????:param dataframe: DataFrame populated with indicators
????????:param metadata: Additional information, like the currently traded pair
????????:return: DataFrame with buy column
????????"""
????????dataframe.loc[
????????????(
????????????????# Signal: RSI crosses above 30
????????????????(qtpylib.crossed_above(dataframe['rsi'], self.buy_rsi.value)) &
????????????????(dataframe['tema'] <= dataframe['bb_middleband']) & # Guard: tema below BB middle
????????????????(dataframe['tema'] > dataframe['tema'].shift(1)) & # Guard: tema is raising
????????????????(dataframe['volume'] > 0) # Make sure Volume is not 0
????????????), 'buy'] = 1

????????return?dataframe

????def?populate_sell_trend(self, dataframe: DataFrame, metadata: dict)?-> DataFrame:
????????"""
????????Based on TA indicators, populates the sell signal for the given dataframe
????????:param dataframe: DataFrame populated with indicators
????????:param metadata: Additional information, like the currently traded pair
????????:return: DataFrame with sell column
????????"""
????????dataframe.loc[
????????????(
????????????????# Signal: RSI crosses above 70
????????????????(qtpylib.crossed_above(dataframe['rsi'], self.sell_rsi.value)) &
????????????????(dataframe['tema'] > dataframe['bb_middleband']) & # Guard: tema above BB middle
????????????????(dataframe['tema'] < dataframe['tema'].shift(1)) & # Guard: tema is falling
????????????????(dataframe['volume'] > 0) # Make sure Volume is not 0
????????????), 'sell'] = 1
????????return?dataframe
啟動(dòng)機(jī)器人前還需要設(shè)定配置,配置模板在 config/examples 下面。
比如幣安的配置,你還需要輸入key和secret:
"exchange": {
????????"name": "binance",
????????"key": "your_exchange_key",
????????"secret": "your_exchange_secret",
????????......
??}
}
啟動(dòng)機(jī)器人:
freqtrade trade --strategy AwesomeStrategy --strategy-path /some/directory -c path/far/far/away/config.json
--strategy-path 指定策略文件位置
-c 參數(shù)指定配置文件位置
比如我把策略放在了user_data/strategies下,配置放在了config_examples下,這么輸入命令啟動(dòng)機(jī)器人即可:
freqtrade trade --strategy SampleStrategy --strategy-path user_data/strategies -c config_examples/config_binance.example.json
由于篇幅問題,本文只是介紹了freqtrade的冰山一角,在啟動(dòng)機(jī)器人前,一定要進(jìn)行回測(cè)并進(jìn)行模擬交易。它還有TG通知功能、WebUI管理界面,詳細(xì)的使用方法大家可以參考官方教程:
https://www.freqtrade.io/en/stable/
我們的文章到此就結(jié)束啦,如果你喜歡今天的Python 實(shí)戰(zhàn)教程,請(qǐng)持續(xù)關(guān)注Python實(shí)用寶典。
有任何問題,可以在公眾號(hào)后臺(tái)回復(fù):加群,回答相應(yīng)紅字驗(yàn)證信息,進(jìn)入互助群詢問。
原創(chuàng)不易,希望你能在下面點(diǎn)個(gè)贊和在看支持我繼續(xù)創(chuàng)作,謝謝!
點(diǎn)擊下方閱讀原文可獲得更好的閱讀體驗(yàn)
Python實(shí)用寶典?(pythondict.com)
不只是一個(gè)寶典
歡迎關(guān)注公眾號(hào):Python實(shí)用寶典
