
Python爬取+可視化糗事百科
生活真是太苦了,需要找點(diǎn)快樂(lè)的精神食糧支撐社畜生活,聽(tīng)說(shuō)糗事百科段子挺多,今天就來(lái)看一看!
本文主要內(nèi)容:

selenium爬取段子信息
這次我們利用selenium來(lái)實(shí)現(xiàn)翻頁(yè)爬取段子信息!
翻頁(yè)查看url變化規(guī)律:
https://www.qiushibaike.com/text/page/1/
https://www.qiushibaike.com/text/page/2/
https://www.qiushibaike.com/text/page/3/
https://www.qiushibaike.com/text/page/4/
https://www.qiushibaike.com/text/page/5/
https://www.qiushibaike.com/text/page/6/
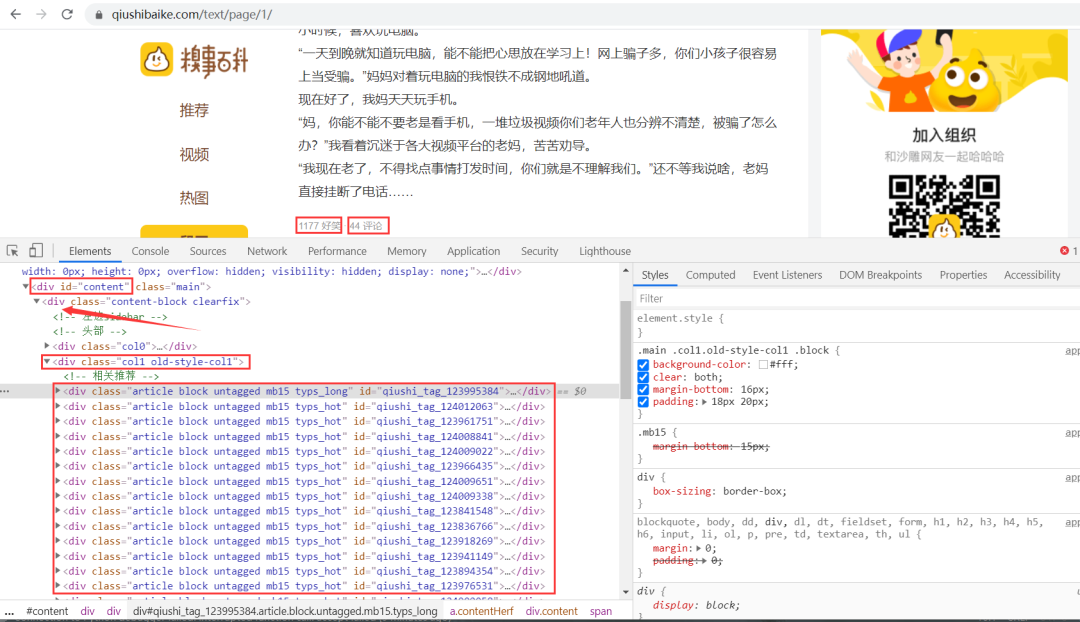
思路:段子信息在 id 為 content 的 div 標(biāo)簽下的 div 下的第二個(gè) div 標(biāo)簽下的 div 標(biāo)簽里,獲取到所有 div 標(biāo)簽的內(nèi)容,然后遍歷,從中提取出每一條段子信息。
代碼如下:
from selenium import webdriver
from time import sleep
import logging
import openpyxl

wb = openpyxl.Workbook()
sheet = wb.active
sheet.append(['段子內(nèi)容', '好笑數(shù)', '評(píng)論數(shù)'])
logging.basicConfig(level=logging.INFO, format='%(asctime)s - %(levelname)s: %(message)s')

chrome_driver = r'D:\python\pycharm2020\chromedriver.exe'

options = webdriver.ChromeOptions()
# 可以設(shè)置無(wú)頭模式 不彈出瀏覽器
# options.add_argument("--headless")
# 關(guān)閉左上方 Chrome 正受到自動(dòng)測(cè)試軟件的控制的提示
options.add_experimental_option('useAutomationExtension', False)
options.add_experimental_option("excludeSwitches", ['enable-automation'])
browser = webdriver.Chrome(options=options, executable_path=chrome_driver)
# 可以設(shè)置繞過(guò)Webdriver的檢測(cè)
browser.execute_cdp_cmd("Page.addScriptToEvaluateOnNewDocument", {
"source": """
Object.defineProperty(navigator, 'webdriver', {
get: () => undefined
})
"""
})


def get_data(page):     # 爬取數(shù)據(jù)函數(shù)
    url = f'https://www.qiushibaike.com/text/page/{page}/'
    browser.get(url)    # 訪問(wèn)目標(biāo)url
    browser.maximize_window()   # 最大化窗口
    sleep(1)    # 短暫休眠
    # Xpath定位到所有包含段子信息的div標(biāo)簽
    items = browser.find_elements_by_xpath('//*[@id="content"]/div/div[2]/div')
    # print(len(items))  一頁(yè)25條段子
    # 遍歷  獲取每一條段子信息
    for item in items:
        con = item.find_element_by_xpath('.//a/div/span').text                   # 段子內(nèi)容
        funny_num = item.find_element_by_xpath('.//div[2]/span[1]/i').text      # 好笑數(shù)
        comment_num = item.find_element_by_xpath('.//div[2]/span[2]/a/i').text   # 評(píng)論數(shù)
        sheet.append([con, funny_num, comment_num])
        logging.info([con, funny_num, comment_num])


if __name__ == '__main__':
    for i in range(1, 14):    # 翻頁(yè)爬取
        get_data(i)
    browser.quit()     # 關(guān)閉瀏覽器
    wb.save(filename='datas.xlsx')   # 保存數(shù)據(jù)
運(yùn)行結(jié)果如下:
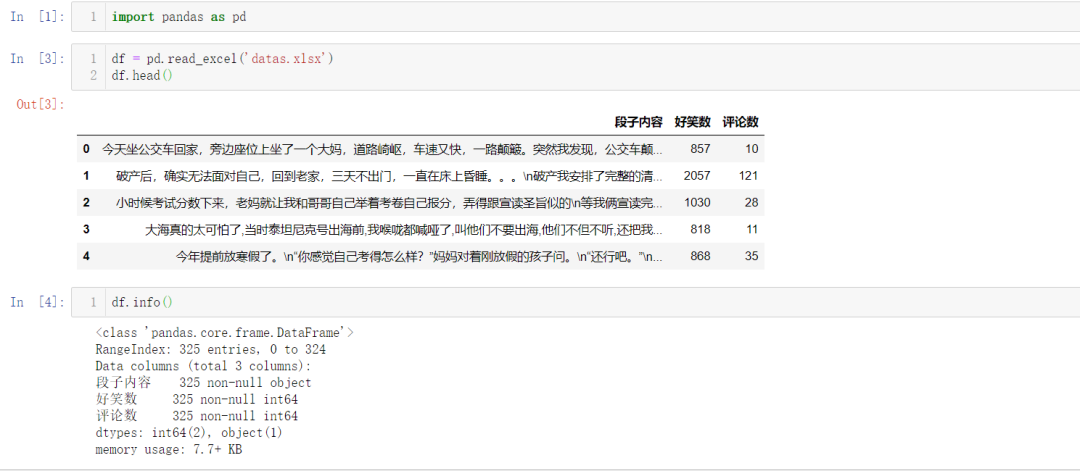
 段子信息保存到了本地 Excel 里,結(jié)果如下:

繪制詞云圖
段子內(nèi)容詞云圖可視化
import pandas as pd
import jieba
import collections
import re
from wordcloud import WordCloud
import matplotlib.pyplot as plt

# 讀取段子數(shù)據(jù)
datas = pd.read_excel('datas.xlsx')['段子內(nèi)容']

# 讀取停用詞數(shù)據(jù)
with open('stop_words.txt', encoding='utf-8') as f:
    con = f.read().split('\n')    # 得到每一行的停用詞
    stop_words = set()
    for i in con:
        stop_words.add(i)

result_list = []
for data in datas:
    # 文本預(yù)處理  去除一些無(wú)用的字符   只提取出中文出來(lái)
    new_data = re.findall('[\u4e00-\u9fa5]+', data, re.S)
    new_data = "/".join(new_data)
    # 文本分詞
    seg_list_exact = jieba.cut(new_data, cut_all=True)
    # 去除停用詞和單個(gè)詞
    for word in seg_list_exact:
        if word not in stop_words and len(word) > 1:
            result_list.append(word)

print(result_list)
# 篩選后統(tǒng)計(jì)
word_counts = collections.Counter(result_list)

# 繪制詞云
my_cloud = WordCloud(
    background_color='white',  # 設(shè)置背景顏色  默認(rèn)是black
    width=800, height=550,
    font_path='simhei.ttf',   # 設(shè)置字體  顯示中文
    max_font_size=160,        # 設(shè)置字體最大值
    min_font_size=16,         # 設(shè)置字體最小值
    random_state=88           # 設(shè)置隨機(jī)生成狀態(tài),即多少種配色方案
).generate_from_frequencies(word_counts)

# 顯示生成的詞云圖片
plt.imshow(my_cloud, interpolation='bilinear')
# 顯示設(shè)置詞云圖中無(wú)坐標(biāo)軸
plt.axis('off')
plt.show()
運(yùn)行效果如下:

老婆、朋友、孩子、媳婦、同事、回家、老公等詞云都是糗事百科段子內(nèi)容里出現(xiàn)頻率較高,都比較貼進(jìn)生活,除此之外,"發(fā)現(xiàn)" 這個(gè)詞也是出現(xiàn)頻率較高的,看來(lái)有點(diǎn)東西。
散點(diǎn)圖
分析評(píng)論數(shù)與好笑數(shù)之間關(guān)系,散點(diǎn)圖可視化
import pandas as pd
import matplotlib.pyplot as plt
import matplotlib as mpl

# 讀取數(shù)據(jù)
df = pd.read_excel('datas.xlsx')
funny_num, comment_num = df['好笑數(shù)'], df['評(píng)論數(shù)']
# 設(shè)置中文顯示
mpl.rcParams['font.family'] = 'SimHei'
# 設(shè)置圖形顯示風(fēng)格 ggplot
plt.style.use('ggplot')
# 設(shè)置大小  像素
plt.figure(figsize=(9, 6), dpi=100)

# 繪制散點(diǎn)圖
plt.scatter(comment_num, funny_num)
# 添加描述信息
plt.title('段子評(píng)論數(shù)與好笑數(shù)關(guān)系-散點(diǎn)圖')
plt.xlabel('評(píng)論數(shù)')
plt.ylabel('好笑數(shù)')
plt.show()
運(yùn)行效果如下:
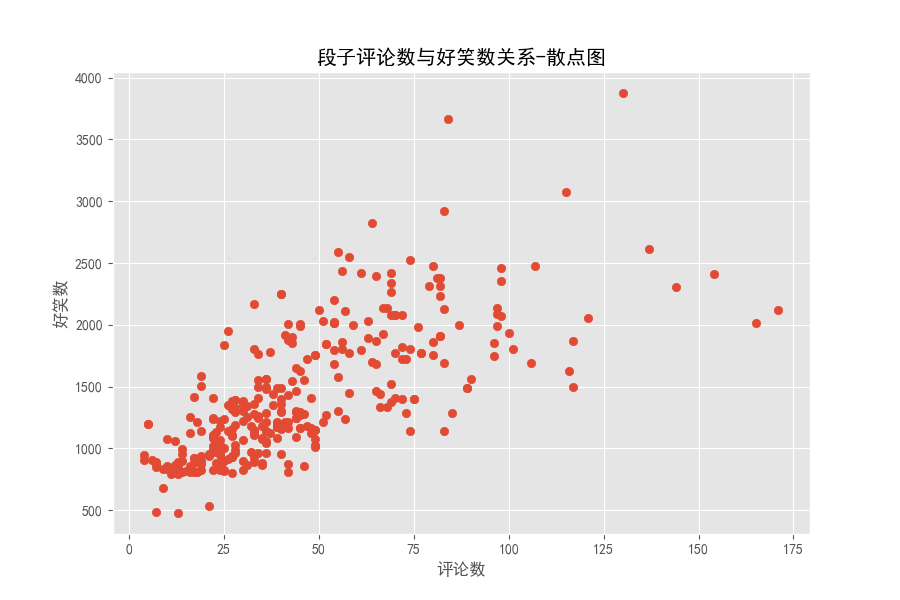
在評(píng)論數(shù)小于 50 時(shí),點(diǎn)分布密集,大概還有評(píng)論數(shù)多,好笑數(shù)多的關(guān)系,評(píng)論數(shù)大于50之后,點(diǎn)分布非常散亂。段子的評(píng)論數(shù)和好笑數(shù)實(shí)時(shí)在變,下面來(lái)看看我們那是爬取下來(lái)的段子里評(píng)論數(shù)最多、好笑數(shù)最多的分別講的啥。
TOP級(jí)別段子
import pandas as pd

# 讀取數(shù)據(jù)
df = pd.read_excel('datas.xlsx')
# 降序排列后打印第一行  評(píng)論數(shù)最多
df1 = df.sort_values(by='評(píng)論數(shù)', ascending=False)
print(df1.values[0])

評(píng)論數(shù)最多的段子


import pandas as pd

# 讀取數(shù)據(jù)
df = pd.read_excel('datas.xlsx')
# 降序排列后打印第一行  好笑數(shù)最多
df1 = df.sort_values(by='好笑數(shù)', ascending=False)
print(df1.values[0])

好笑數(shù)最多的段子

emmm,幽默笑話大全__爆笑笑話__笑破你的肚子的搞笑段子,就這?

作者:葉庭云
CSDN:https://yetingyun.blog.csdn.net/本文僅用于交流學(xué)習(xí),未經(jīng)作者允許,禁止轉(zhuǎn)載,更勿做其他用途,違者必究。覺(jué)得文章對(duì)你有幫助、讓你有所收獲的話,期待你的點(diǎn)贊呀,不足之處,也可以在評(píng)論區(qū)多多指正。
_往期文章推薦_