
用 Python 將 matplotlib 圖表集成到 PDF 中
borb —— 一個(gè)專(zhuān)門(mén)用于閱讀、操作和生成 PDF 文檔的 Python 庫(kù)。它提供了一個(gè)低級(jí)模型(允許您訪問(wèn)精確的坐標(biāo)和布局)和一個(gè)高級(jí)模型(您可以將邊距、位置等精確計(jì)算委托給布局管理器) .borb和 matplotlibborb 可以從 GitHub 上的源代碼下載,或通過(guò) pip 安裝:$?pip?install?borb
matplotlib 也可以通過(guò) pip 安裝:$?pip?install?matplotlib
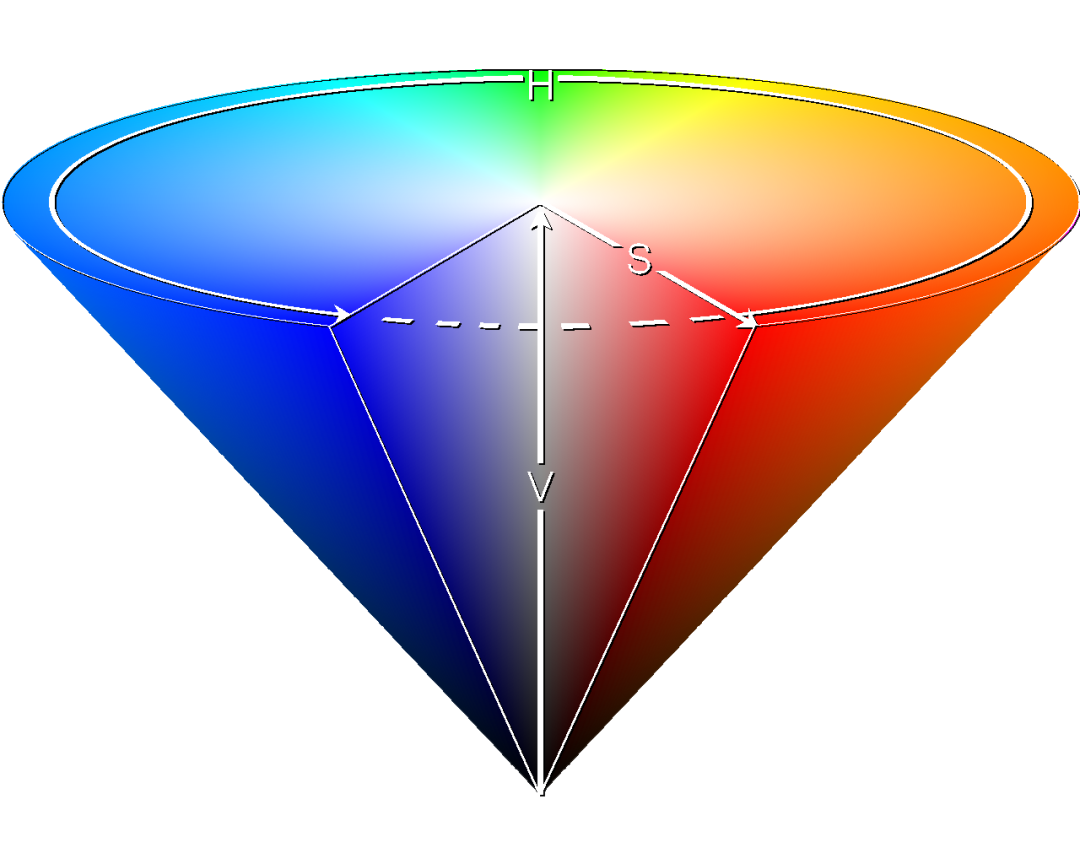
from?borb.pdf.canvas.color.color?import?HSVColor,?HexColor
from?decimal?import?Decimal
import?typing

def?create_n_colors(n:?int)?->?typing.List[str]:
??#?The?base?color?is?borb-blue
??base_hsv_color:?HSVColor?=?HSVColor.from_rgb(HexColor("56cbf9"))
??#?This?array?comprehension?creates?n?HSVColor?objects,?transforms?then?to?RGB,?and?then?returns?their?hex?string
??return?[HSVColor(base_hsv_color.hue?+?Decimal(x?/?360),?Decimal(1),?Decimal(1)).to_rgb().to_hex_string()?for?x?in?range(0,?360,?int(360/n))]
create_pie_chart() 函數(shù)(或其他類(lèi)型圖的函數(shù)):#?New?import(s)
import?matplotlib.pyplot?as?plt
from?borb.pdf.canvas.layout.image.chart?import?Chart
from?borb.pdf.canvas.layout.layout_element?import?Alignment
def?create_piechart(labels:?typing.List[str],?data:?typing.List[float]):
??#?Symetric?figure?to?ensure?equal?aspect?ratio
??fig1,?ax1?=?plt.subplots(figsize=(4,?4))
??ax1.pie(
????data,
????explode=[0?for?_?in?range(0,?len(labels))],
????labels=labels,
????autopct="%1.1f%%",
????shadow=True,
????startangle=90,
????colors=create_n_colors(len(labels)),
??)
??ax1.axis("equal")??#?Equal?aspect?ratio?ensures?that?pie?is?drawn?as?a?circle.
??return?Chart(
????plt.gcf(),
????width=Decimal(200),
????height=Decimal(200),
????horizontal_alignment=Alignment.CENTERED,
??)
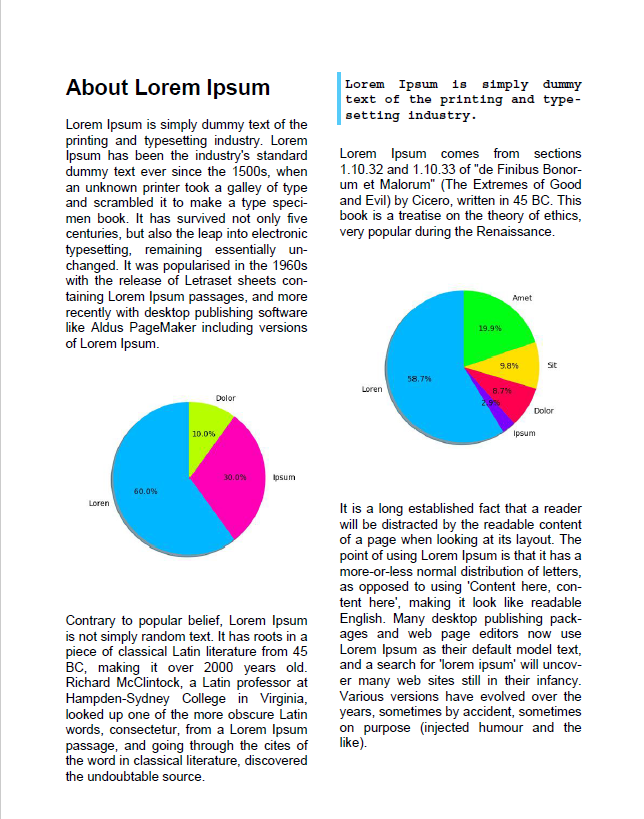
pie() 函數(shù)創(chuàng)建餅圖。PyPlot 實(shí)例的 gcf() 函數(shù)返回當(dāng)前圖形。該圖可以嵌入到 PDF 文檔中,方法是將其注入到 Chart 構(gòu)造函數(shù)中,并與您的自定義參數(shù)(例如width, height 和 horizontal_alignment)一起插入。Chart構(gòu)造函數(shù)提供一個(gè) Matplotlib 圖。#?New?import(s)
from?borb.pdf.document?import?Document
from?borb.pdf.page.page?import?Page
from?borb.pdf.pdf?import?PDF
from?borb.pdf.canvas.layout.page_layout.multi_column_layout?import?MultiColumnLayout
from?borb.pdf.canvas.layout.page_layout.page_layout?import?PageLayout
from?borb.pdf.canvas.layout.text.paragraph?import?Paragraph
#?Create?empty?Document
pdf?=?Document()
#?Create?empty?Page
page?=?Page()
#?Add?Page?to?Document
pdf.append_page(page)
#?Create?PageLayout
layout:?PageLayout?=?MultiColumnLayout(page)
#?Write?title
layout.add(Paragraph("About?Lorem?Ipsum",?
?????????????????????font_size=Decimal(20),?
?????????????????????font="Helvetica-Bold"))
#?New?import(s)
from?borb.pdf.canvas.layout.hyphenation.hyphenation?import?Hyphenation

#?Create?hyphenation?algorithm
hyphenation_algorithm:?Hyphenation?=?Hyphenation("en-gb")

#?Write?paragraph
layout.add(Paragraph(
????"""
????Lorem?Ipsum?is?simply?dummy?text?of?the?printing?and?typesetting?industry.?
????Lorem?Ipsum?has?been?the?industry's?standard?dummy?text?ever?since?the?1500s,?
????when?an?unknown?printer?took?a?galley?of?type?and?scrambled?it?to?make?a?type?specimen?book.?
????It?has?survived?not?only?five?centuries,?but?also?the?leap?into?electronic?typesetting,?remaining?essentially?unchanged.?
????It?was?popularised?in?the?1960s?with?the?release?of?Letraset?sheets?containing?Lorem?Ipsum?passages,?
????and?more?recently?with?desktop?publishing?software?like?Aldus?PageMaker?including?versions?of?Lorem?Ipsum.
????""",?text_alignment=Alignment.JUSTIFIED,?hyphenation=hyphenation_algorithm))
#?Write?graph
layout.add(create_piechart(["Loren",?"Ipsum",?"Dolor"],?
???????????????????????????[0.6,?0.3,?0.1]))
Paragraph對(duì)象。其中一個(gè)將不僅僅表示引用(側(cè)面邊框,不同字體等)。#?Write?paragraph
layout.add(Paragraph(
????"""
????Contrary?to?popular?belief,?Lorem?Ipsum?is?not?simply?random?text.?
????It?has?roots?in?a?piece?of?classical?Latin?literature?from?45?BC,?making?it?over?2000?years?old.?
????Richard?McClintock,?a?Latin?professor?at?Hampden-Sydney?College?in?Virginia,?looked?up?one?of?the?more?obscure?Latin?words,?
????consectetur,?from?a?Lorem?Ipsum?passage,?and?going?through?the?cites?of?the?word?in?classical?literature,?
????discovered?the?undoubtable?source.
????""",?text_alignment=Alignment.JUSTIFIED,?hyphenation=hyphenation_algorithm))
#?Write?paragraph
layout.add(Paragraph(
????"""
????Lorem?Ipsum?is?simply?dummy?text?of?the?printing?and?typesetting?industry.?
????""",?
????font="Courier-Bold",
????text_alignment=Alignment.JUSTIFIED,?
????hyphenation=hyphenation_algorithm,
????border_color=HexColor("56cbf9"),
????border_width=Decimal(3),
????border_left=True,
????padding_left=Decimal(5),
????padding_bottom=Decimal(5),
))
#?Write?paragraph
layout.add(Paragraph(
????"""
????Lorem?Ipsum?comes?from?sections?1.10.32?and?1.10.33?of?"de?Finibus?Bonorum?et?Malorum"?
????(The?Extremes?of?Good?and?Evil)?by?Cicero,?written?in?45?BC.?
????This?book?is?a?treatise?on?the?theory?of?ethics,?very?popular?during?the?Renaissance.
????""",?text_alignment=Alignment.JUSTIFIED,?hyphenation=hyphenation_algorithm))
#?Write?graph
layout.add(create_piechart(["Loren",?"Ipsum",?"Dolor",?"Sit",?"Amet"],?
???????????????????????????[600,?30,?89,?100,?203]))
Paragraph):#?Write?paragraph
layout.add(Paragraph(
????"""
????It?is?a?long?established?fact?that?a?reader?will?be?distracted?by?the?readable?content?of?a?page?when?looking?at?its?layout.?
????The?point?of?using?Lorem?Ipsum?is?that?it?has?a?more-or-less?normal?distribution?of?letters,?as?opposed?to?using?'Content?here,?content?here',?
????making?it?look?like?readable?English.?Many?desktop?publishing?packages?and?web?page?editors?now?use?Lorem?Ipsum?as?their?default?model?text,?
????and?a?search?for?'lorem?ipsum'?will?uncover?many?web?sites?still?in?their?infancy.?
????Various?versions?have?evolved?over?the?years,?sometimes?by?accident,?sometimes?on?purpose?(injected?humour?and?the?like).
????""",?text_alignment=Alignment.JUSTIFIED,?hyphenation=hyphenation_algorithm))
Document):#?Write?to?disk
with?open("output.pdf",?"wb")?as?pdf_file_handle:
??PDF.dumps(pdf_file_handle,?pdf)


點(diǎn)擊下方閱讀原文加入社區(qū)會(huì)員
評(píng)論
圖片
表情