
本福特定律和統(tǒng)計中的造假檢測
英文原文:https://www.statisticalconsultants.co.nz/blog/benfords-law-and-accounting-fraud-detection.html
一、基本概念
15435 首位是 156 首位是 59001 首位是 9199 首位是 19 首位是 9
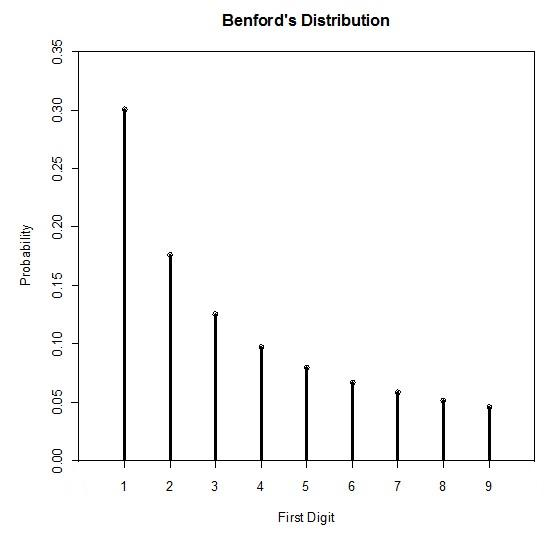
二、數位分布概率 第1位數字
出現概率
1
0.301
2
0.176
3
0.125
4
0.097
5
0.079
6
0.067
7
0.058
8
0.051
9
0.046
第1位數字 | 出現概率 |
1 | 0.301 |
2 | 0.176 |
3 | 0.125 |
4 | 0.097 |
5 | 0.079 |
6 | 0.067 |
7 | 0.058 |
8 | 0.051 |
9 | 0.046 |
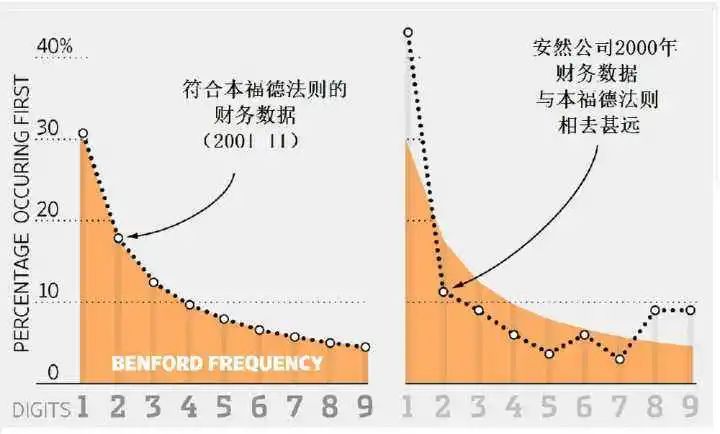
三、本福特分布圖
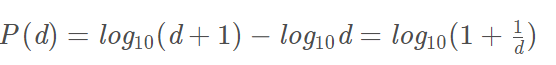
四、本福特分布公式
六、本福特定律適用于哪類數據?
具有通過來自多個分布的數字的數學組合形成的值的數據。 具有多種數字的數據,例如 具有數百,數千,數萬等數值的數據。 數據集相當大。 數據是右傾斜的,即平均值大于中值,并且分布具有長的右尾而不是對稱的。 數據沒有預定義的最大值或最小值(最小值為零)。
七、會計欺詐檢測與取證分析
1)大型企業(yè)的應付賬款數據
2)本福特的分析應用于組織的費用數據
八、廣義本福特的分布表
數位 | 第1位 | 第2位 | 第3位 | 第4位 | 第5位 |
0 | NA | 0.11968 | 0.10178 | 0.10018 | 0.10002 |
1 | 0.30103 | 0.11389 | 0.10138 | 0.10014 | 0.10001 |
2 | 0.17609 | 0.10882 | 0.10097 | 0.1001 | 0.10001 |
3 | 0.12494 | 0.10433 | 0.10057 | 0.10006 | 0.10001 |
4 | 0.09691 | 0.10031 | 0.10018 | 0.10002 | 0.1 |
5 | 0.07918 | 0.09668 | 0.09979 | 0.09998 | 0.1 |
6 | 0.06695 | 0.09337 | 0.0994 | 0.09994 | 0.09999 |
7 | 0.05799 | 0.09035 | 0.09902 | 0.0999 | 0.09999 |
8 | 0.05115 | 0.08757 | 0.09864 | 0.09986 | 0.09999 |
9 | 0.04576 | 0.085 | 0.09827 | 0.09982 | 0.09998 |
九、一般分布公式
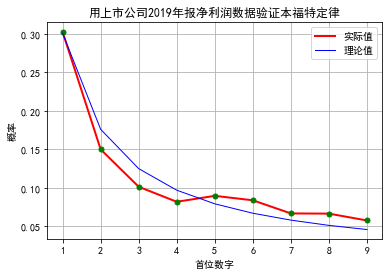
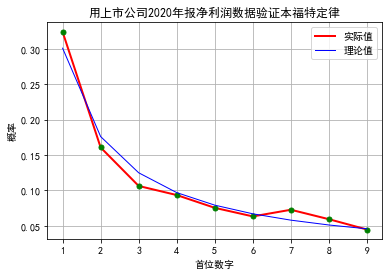
十、上市公司年報凈利潤數據驗證本福特定律
# 驗證本福特定律import tushare as ts # 股票數據獲取的一個包import mathimport matplotlib.pyplot as pltimport pandas as pdfrom functools import reducefrom pylab import *# 這一句讓pyplot支持中文顯示mpl.rcParams['font.sans-serif'] = ['SimHei']# 獲取首位的函數def firstDigital(x):x= round(x)while x >= 10:x //= 10return x# 首位概率累加def addDigit(lst, digit):lst[digit-1]+=1return lst# 理論值:每位概率理論值用于對比th_freq=[math.log((x+1)/x, 10) for x in range(1,10)]#分別獲得2019,2020年報數據df=?ts.get_report_data(2019,?4)# 只取凈利潤>0的數據,首先進行次數統(tǒng)計freq= reduce(addDigit, map(firstDigital, filter(lambda x:x>0, df['net_profits'])), [0]*9)# 再計算實際概率pr_freq= [x/sum(freq) for x in freq]print(th_freq)print(pr_freq)# 作圖plt.title('用上市公司2019年報凈利潤數據驗證本福特定律')plt.xlabel("首位數字")plt.ylabel("概率")plt.xticks(range(9), range(1,10))plt.plot(pr_freq,"r-",linewidth=2, label= '實際值')plt.plot(pr_freq, "go", markersize=5)plt.plot(th_freq,"b-",linewidth=1, label= '理論值')plt.grid(True)plt.legend()plt.show()

長按關注公眾號? ?? ? ? ??長按加作者好友 ? ? ???
評論
圖片
表情