
『每周譯Go』Go 語(yǔ)言的 goroutine 性能分析
本文檔最后一次更新時(shí)所用的 Go 版本是 1.15.6,但是大多數(shù)情況下,新老版本都適用。
描述
Go 運(yùn)行時(shí)在一個(gè)稱為 allgs 簡(jiǎn)單切片追蹤所有的 goroutines。這里面包含了活躍的和死亡的 goroutine 。死亡的 goroutine 保留下來(lái),等到生成新的 goroutine 時(shí)重用。
Go 有各種 API 來(lái)監(jiān)測(cè) allgs中活躍的 goroutine 和這些 goroutines 當(dāng)前的堆棧跟蹤信息,以及各種其他屬性。一些 API 將這些信息公開(kāi)為統(tǒng)計(jì)摘要,而另外一些 API 則給每個(gè)單獨(dú)的 goroutine 信息提供查詢接口。
盡管 API 之間有差異,但是活躍的 goroutine 都有如下共同 定義
- 非死
- 不是系統(tǒng) goroutine,也不是 finalizer goroutine。
換句話說(shuō),正在運(yùn)行的 goroutine 和那些等待 i/o、鎖、通道、調(diào)度的 goroutine 一樣,都被認(rèn)為是活躍的。盡管人們可能會(huì)天真的認(rèn)為后面那幾種等待的 goroutine 是不活躍的。
開(kāi)銷
Go 中 所有可用的 goroutine 分析都需要一個(gè) O(N) stop-the-world 階段。這里的 N 是指已分配 goroutine 的數(shù)量。一個(gè)簡(jiǎn)單的基準(zhǔn)測(cè)試 表明,當(dāng)使用 runtime.GoroutineProfile() API 時(shí),每個(gè) goroutine 的世界會(huì)停止約 1 個(gè)μs。但是這個(gè)數(shù)字可能會(huì)隨著諸如程序的平均堆棧深度、死掉的 goroutines 數(shù)量等因素的變化而波動(dòng)。
根據(jù)經(jīng)驗(yàn),對(duì)于延遲非常敏感并使用數(shù)千個(gè)活躍 goroutine 的應(yīng)用程序,在生產(chǎn)中使用 goroutine 分析可能需要謹(jǐn)慎一些。因此,對(duì)于包含大量的 goroutine ,甚至 Go 本身這樣的應(yīng)用程序來(lái)說(shuō),使用 goroutine 分析可能不是一個(gè)好主意。
大多數(shù)應(yīng)用程序不會(huì)產(chǎn)生大量的 goroutine,并且可以容忍幾毫秒的額外延遲,在生產(chǎn)中持續(xù) goroutine 性能分析應(yīng)該沒(méi)有問(wèn)題。
Goroutine 屬性
Goroutines 有很多屬性 可以幫助調(diào)試 Go 應(yīng)用程序。下面的屬性非常有趣,并且可以通過(guò)文章后面描述的 API 不同程度地暴露。
goid: goroutine 的唯一 id, 主 goroutine 的 id 為1.atomicstatus: goroutine 的狀態(tài)如下:idle: 剛分配runnable: 在運(yùn)行隊(duì)列上,等待調(diào)度running: 在操作系統(tǒng)線程上執(zhí)行syscall: 在系統(tǒng)調(diào)用時(shí)阻塞waiting: 等待調(diào)度,見(jiàn)g.waitreasondead: 剛剛退出或被重新初始化copystack: 堆棧當(dāng)前正在移動(dòng)preempted: 搶占
waitreason:goroutine 等待的原因,比如 sleep、channel 操作、i/o、gc 等等。waitsince: goroutine 進(jìn)入waiting或者syscall狀態(tài)的大約時(shí)間戳,由等待啟動(dòng)后第一個(gè) GC 確定。labels: 可以附加到 goroutines 上的一系列 鍵/值分析標(biāo)簽。stack trace: 當(dāng)前正在執(zhí)行的函數(shù)及其調(diào)用者。要么是文件名、函數(shù)名和行號(hào)的純文本輸出,要么是程序計(jì)數(shù)器地址的一個(gè)切片 (pcs)。你也可以進(jìn)一步研究更多的細(xì)節(jié)比如:文件名、函數(shù)名和行號(hào)的純文本可以轉(zhuǎn)換成 pcs 嗎?gopc:go ...調(diào)用程序計(jì)數(shù)地址 (pc) 導(dǎo)致 goroutine 的創(chuàng)建。可以轉(zhuǎn)換為文件、函數(shù)名和行號(hào)。lockedm: 該 goroutine 的鎖定的線程,如果有的話。
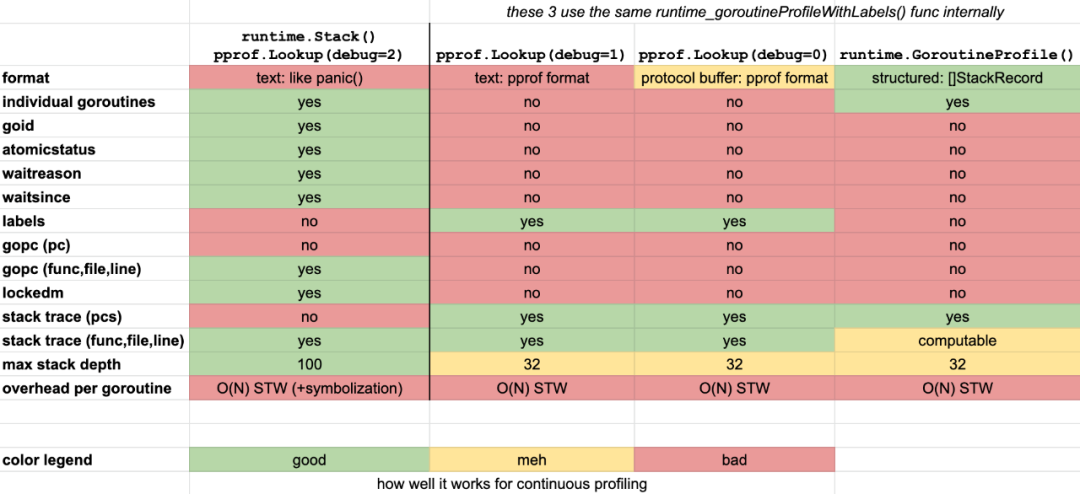
特征矩陣
下面的特征矩陣讓你快速了解,調(diào)用這些 API 時(shí),這些屬性當(dāng)前的可用性。也可以通過(guò)谷歌表格獲取。
APIs
runtime.Stack() / pprof.Lookup(debug=2)
該 API 將返回非結(jié)構(gòu)化文本輸出,顯示所有活動(dòng) goroutines 的堆棧信息以及上面特性矩陣中列出的屬性。
waitsince屬性包含了以分鐘為單位的nanotime() - gp.waitsince(),但當(dāng)持續(xù)時(shí)間超過(guò) 1 分鐘。
pprof.Lookup(debug=2) 是如何使用 profile 簡(jiǎn)單的別名。實(shí)際調(diào)用是下面這樣:
profile?:=?pprof.Lookup("goroutine")
profile.WriteTo(os.Stdout,?2)
簡(jiǎn)單調(diào)用下 runtime.Stack()就可以實(shí)現(xiàn) profile
下面是返回輸出的截短示例,完整例子可以看 2.runtime.stack.txt
goroutine?1?[running]:
main.glob..func1(0x14e5940,?0xc0000aa7b0,?0xc000064eb0,?0x2)
/Users/felix.geisendoerfer/go/src/github.com/felixge/go-profiler-notes/examples/goroutine/main.go:29?+0x6f
main.writeProfiles(0x2,?0xc0000c4008,?0x1466424)
/Users/felix.geisendoerfer/go/src/github.com/felixge/go-profiler-notes/examples/goroutine/main.go:106?+0x187
main.main()
/Users/felix.geisendoerfer/go/src/github.com/felixge/go-profiler-notes/examples/goroutine/main.go:152?+0x3d2

goroutine?22?[sleep,?1?minutes]:
time.Sleep(0x3b9aca00)
/usr/local/Cellar/go/1.15.6/libexec/src/runtime/time.go:188?+0xbf
main.shortSleepLoop()
/Users/felix.geisendoerfer/go/src/github.com/felixge/go-profiler-notes/examples/goroutine/main.go:165?+0x2a
created?by?main.indirectShortSleepLoop2
/Users/felix.geisendoerfer/go/src/github.com/felixge/go-profiler-notes/examples/goroutine/main.go:185?+0x35

goroutine?3?[IO?wait,?1?minutes]:
internal/poll.runtime_pollWait(0x1e91e88,?0x72,?0x0)
/usr/local/Cellar/go/1.15.6/libexec/src/runtime/netpoll.go:222?+0x55
internal/poll.(*pollDesc).wait(0xc00019e018,?0x72,?0x0,?0x0,?0x1465786)
/usr/local/Cellar/go/1.15.6/libexec/src/internal/poll/fd_poll_runtime.go:87?+0x45
internal/poll.(*pollDesc).waitRead(...)
/usr/local/Cellar/go/1.15.6/libexec/src/internal/poll/fd_poll_runtime.go:92
internal/poll.(*FD).Accept(0xc00019e000,?0x0,?0x0,?0x0,?0x0,?0x0,?0x0,?0x0)
/usr/local/Cellar/go/1.15.6/libexec/src/internal/poll/fd_unix.go:394?+0x1fc

...
pprof.Lookup(debug=1)
該分析方法調(diào)用和pprof.Lookup(debug=2) 一樣,但是會(huì)產(chǎn)生的數(shù)據(jù)卻大相徑庭:
- 不會(huì)列出單獨(dú)的 goroutines 信息,把擁有相同堆棧信息和標(biāo)簽的 goroutines 和他們的數(shù)量一起列出。
- 包含了 pprof 標(biāo)簽,
debug=2不包含標(biāo)簽。 - Most other goroutine properties from
debug=2are not included. - 不包含
debug=2中大多數(shù) goroutine 屬性。 - 輸出格式也是基于文本的,但看起來(lái)與
debug=2非常不同。
下面是返回輸出的截短示例,完整例子可以看 2.pprof.lookup.goroutine.debug1.txt
goroutine?profile:?total?9
2?@?0x103b125?0x106cd1f?0x13ac44a?0x106fd81
#?labels:?{"test_label":"test_value"}
#0x106cd1etime.Sleep+0xbe/usr/local/Cellar/go/1.15.6/libexec/src/runtime/time.go:188
#0x13ac449main.shortSleepLoop+0x29/Users/felix.geisendoerfer/go/src/github.com/felixge/go-profiler-notes/examples/goroutine/main.go:165

1?@?0x103b125?0x10083ef?0x100802b?0x13ac4ed?0x106fd81
#?labels:?{"test_label":"test_value"}
#0x13ac4ecmain.chanReceiveForever+0x4c/Users/felix.geisendoerfer/go/src/github.com/felixge/go-profiler-notes/examples/goroutine/main.go:177

1?@?0x103b125?0x103425b?0x106a1d5?0x10d8185?0x10d91c5?0x10d91a3?0x11b8a8f?0x11cb72e?0x12df52d?0x11707c5?0x117151d?0x1171754?0x1263c2c?0x12d96ca?0x12d96f9?0x12e09ba?0x12e5085?0x106fd81
#0x106a1d4internal/poll.runtime_pollWait+0x54/usr/local/Cellar/go/1.15.6/libexec/src/runtime/netpoll.go:222
#0x10d8184internal/poll.(*pollDesc).wait+0x44/usr/local/Cellar/go/1.15.6/libexec/src/internal/poll/fd_poll_runtime.go:87
#0x10d91c4internal/poll.(*pollDesc).waitRead+0x1a4/usr/local/Cellar/go/1.15.6/libexec/src/internal/poll/fd_poll_runtime.go:92
#0x10d91a2internal/poll.(*FD).Read+0x182/usr/local/Cellar/go/1.15.6/libexec/src/internal/poll/fd_unix.go:159
#0x11b8a8enet.(*netFD).Read+0x4e/usr/local/Cellar/go/1.15.6/libexec/src/net/fd_posix.go:55
#0x11cb72dnet.(*conn).Read+0x8d/usr/local/Cellar/go/1.15.6/libexec/src/net/net.go:182
#0x12df52cnet/http.(*connReader).Read+0x1ac/usr/local/Cellar/go/1.15.6/libexec/src/net/http/server.go:798
#0x11707c4bufio.(*Reader).fill+0x104/usr/local/Cellar/go/1.15.6/libexec/src/bufio/bufio.go:101
#0x117151cbufio.(*Reader).ReadSlice+0x3c/usr/local/Cellar/go/1.15.6/libexec/src/bufio/bufio.go:360
#0x1171753bufio.(*Reader).ReadLine+0x33/usr/local/Cellar/go/1.15.6/libexec/src/bufio/bufio.go:389
#0x1263c2bnet/textproto.(*Reader).readLineSlice+0x6b/usr/local/Cellar/go/1.15.6/libexec/src/net/textproto/reader.go:58
#0x12d96c9net/textproto.(*Reader).ReadLine+0xa9/usr/local/Cellar/go/1.15.6/libexec/src/net/textproto/reader.go:39
#0x12d96f8net/http.readRequest+0xd8/usr/local/Cellar/go/1.15.6/libexec/src/net/http/request.go:1012
#0x12e09b9net/http.(*conn).readRequest+0x199/usr/local/Cellar/go/1.15.6/libexec/src/net/http/server.go:984
#0x12e5084net/http.(*conn).serve+0x704/usr/local/Cellar/go/1.15.6/libexec/src/net/http/server.go:1851

...
pprof.Lookup(debug=0)
該分析方法調(diào)用和pprof.Lookup(debug=1) 一樣,并且產(chǎn)生的數(shù)據(jù)也一樣。唯一的不同技術(shù)數(shù)據(jù)格式是 pprof protocol buffer 格式。
下面是通過(guò) go tool pprof -raw 命令返回輸出的截短示例,完整例子可以看2.pprof.lookup.goroutine.debug0.pb.gz
PeriodType:?goroutine?count
Period:?1
Time:?2021-01-14?16:46:23.697667?+0100?CET
Samples:
goroutine/count
??????????2:?1?2?3?
????????????????test_label:[test_value]
??????????1:?1?4?5?6?
????????????????test_label:[test_value]
??????????1:?1?7?8?9?10?11?12?13?14?15?16?17?18?19?20?
??????????1:?1?7?8?9?10?11?12?21?14?22?23?
????????????????test_label:[test_value]
??????????1:?1?7?8?9?24?25?26?27?28?29?30?
??????????1:?1?31?32?
????????????????test_label:[test_value]
??????????1:?1?2?33?
????????????????test_label:[test_value]
??????????1:?34?35?36?37?38?39?40?41?
????????????????test_label:[test_value]
Locations
?????1:?0x103b124?M=1?runtime.gopark?/usr/local/Cellar/go/1.15.6/libexec/src/runtime/proc.go:306?s=0
?????2:?0x106cd1e?M=1?time.Sleep?/usr/local/Cellar/go/1.15.6/libexec/src/runtime/time.go:188?s=0
?????3:?0x13ac449?M=1?main.shortSleepLoop?/Users/felix.geisendoerfer/go/src/github.com/felixge/go-profiler-notes/examples/goroutine/main.go:165?s=0
?????4:?0x10083ee?M=1?runtime.chanrecv?/usr/local/Cellar/go/1.15.6/libexec/src/runtime/chan.go:577?s=0
?????5:?0x100802a?M=1?runtime.chanrecv1?/usr/local/Cellar/go/1.15.6/libexec/src/runtime/chan.go:439?s=0
?????6:?0x13ac4ec?M=1?main.chanReceiveForever?/Users/felix.geisendoerfer/go/src/github.com/felixge/go-profiler-notes/examples/goroutine/main.go:177?s=0
...
Mappings
1:?0x0/0x0/0x0???[FN]
runtime.GoroutineProfile()
該函數(shù)實(shí)際返回一個(gè) slice,包含了所有活躍 goroutines 和他們當(dāng)前的堆棧跟蹤信息。堆棧跟蹤信息以函數(shù)地址的形式給出,可以使用runtime.CallersFrames()將函數(shù)地址解析為函數(shù)名。
該方法被我的開(kāi)源項(xiàng)目 fgprof 用來(lái)實(shí)現(xiàn)掛鐘分析。
下面的特性是不可用的,但是很期待在未來(lái)的 Go 項(xiàng)目中可能會(huì)被加入進(jìn)去。
- 包含上面但是目前還不能使用的 goroutine 屬性,特別是標(biāo)簽。
- 通過(guò) pprof 標(biāo)簽過(guò)濾,這可以減少 stop-the-world ,但會(huì)需要額外的運(yùn)行時(shí)內(nèi)務(wù)。
- 將返回的 goroutine 的數(shù)量限制為一個(gè)隨機(jī)子集,也可以減少 stop-the-world,而且可能比按標(biāo)簽過(guò)濾更容易實(shí)現(xiàn)。
下面是返回輸出的截短示例,完整例子可以看 2.runtime.goroutineprofile.json 。
[
??{
????"Stack0":?[
??????20629256,
??????20629212,
??????20627047,
??????20628306,
??????17018153,
??????17235329,
??????...
????]
??},
??{
????"Stack0":?[
??????17019173,
??????17222943,
??????20628554,
??????17235329,
??????...
????]
??},
??...
]
net/http/pprof
這個(gè)包通過(guò) HTTP endpoints 暴露上面描述的 pprof.Lookup("goroutine") 分析結(jié)果,輸出和上面 API 是一樣的。
歷史
Goroutine 性能分析是由 Russ Cox 實(shí)現(xiàn) ,第一次出現(xiàn)在 2012-2-22 的周例會(huì)上,在 go1 之前發(fā)布。
免責(zé)聲明
我是 felixge,就職于 Datadog ,主要工作內(nèi)容為 Go 的 持續(xù)性能優(yōu)化。你應(yīng)該了解下。我們也在招聘 : ).
本頁(yè)面的信息可認(rèn)為正確,但不提供任何保證。歡迎反饋!
原文信息
# 原文地址:
https://github.com/DataDog/go-profiler-notes/blob/main/goroutine.md
# 原文作者:felixge
# 本文永久鏈接:
https://github.com/gocn/translator/blob/master/2021/w40_Goroutine_Profiling_in_Go.md
# 譯者:朱亞光
#??完整的 Go 性能分析和采集系列筆記戳這兒(https://github.com/DataDog/go-profiler-notes/blob/main/README.md)
想要了解關(guān)于 Go 的更多資訊,還可以通過(guò)掃描的方式,進(jìn)群一起探討哦~