
SpringBoot+Prometheus+Grafana 實(shí)現(xiàn)自定義監(jiān)控
點(diǎn)擊關(guān)注公眾號(hào),Java干貨及時(shí)送達(dá)
Spring Boot 工程集成 Micrometer 引入依賴(lài) 配置 監(jiān)控jvm信息 創(chuàng)建自定義監(jiān)控 添加具體業(yè)務(wù)代碼監(jiān)控 集成 Prometheus 安裝 集成配置 使用 Grafana Dashboard 展示監(jiān)控項(xiàng) 安裝grafana 配置prometheus數(shù)據(jù)源 增加jvm面板 配置業(yè)務(wù)接口監(jiān)控面板
1.Spring Boot 工程集成 Micrometer
1.1引入依賴(lài)
<dependency>
  <groupId>org.springframework.boot</groupId>
  <artifactId>spring-boot-starter-actuator</artifactId>
</dependency>
<dependency>
  <groupId>io.micrometer</groupId>
  <artifactId>micrometer-registry-prometheus</artifactId>
</dependency>
1.2配置
management.server.port=9003
management.endpoints.web.exposure.include=*
management.endpoint.metrics.enabled=true
management.endpoint.health.show-details=always
management.endpoint.health.probes.enabled=true
management.endpoint.prometheus.enabled=true
management.metrics.export.prometheus.enabled=true
management.metrics.tags.application=voice-qc-backend
這里management.endpoints.web.exposure.include=*配置為開(kāi)啟 Actuator 服務(wù),因?yàn)镾pring Boot Actuator 會(huì)自動(dòng)配置一個(gè) URL 為/actuator/Prometheus的 HTTP 服務(wù)來(lái)供 Prometheus 抓取數(shù)據(jù),不過(guò)默認(rèn)該服務(wù)是關(guān)閉的,該配置將打開(kāi)所有的 Actuator 服務(wù)。
management.metrics.tags.application配置會(huì)將該工程應(yīng)用名稱(chēng)添加到計(jì)量器注冊(cè)表的 tag 中去,方便后邊 Prometheus 根據(jù)應(yīng)用名稱(chēng)來(lái)區(qū)分不同的服務(wù)。
1.3監(jiān)控jvm信息
然后在工程啟動(dòng)主類(lèi)中添加 Bean 如下來(lái)監(jiān)控 JVM 性能指標(biāo)信息:
@SpringBootApplication
public class GatewayDatumApplication {

    public static void main(String[] args) {
        SpringApplication.run(GatewayDatumApplication.class, args);
    }

    @Bean
    MeterRegistryCustomizer<MeterRegistry> configurer(
            @Value("${spring.application.name}") String applicationName) {
        return (registry) -> registry.config().commonTags("application", applicationName);
    }

}
1.4創(chuàng)建自定義監(jiān)控
監(jiān)控請(qǐng)求次數(shù)與響應(yīng)時(shí)間
package com.lianxin.gobot.api.monitor;

import io.micrometer.core.instrument.Counter;
import io.micrometer.core.instrument.MeterRegistry;
import io.micrometer.core.instrument.Timer;
import lombok.Getter;
import org.springframework.beans.factory.annotation.Autowired;
import org.springframework.beans.factory.annotation.Value;
import org.springframework.stereotype.Component;

import javax.annotation.PostConstruct;

/**
 * @Author: GZ
 * @CreateTime: 2022-08-30  10:50
 * @Description: 自定義監(jiān)控服務(wù)
 * @Version: 1.0
 */
@Component
public class PrometheusCustomMonitor {
    /**
     * 上報(bào)撥打請(qǐng)求次數(shù)
     */
    @Getter
    private Counter reportDialRequestCount;
    /**
     * 上報(bào)撥打URL
     */
    @Value("${lx.call-result-report.url}")
    private String callReportUrl;

    /**
     * 上報(bào)撥打響應(yīng)時(shí)間
     */
    @Getter
    private Timer reportDialResponseTime;
    @Getter
    private final MeterRegistry registry;


    @Autowired
    public PrometheusCustomMonitor(MeterRegistry registry) {
        this.registry = registry;
    }

    @PostConstruct
    private void init() {
        reportDialRequestCount = registry.counter("go_api_report_dial_request_count", "url",callReportUrl);
        reportDialResponseTime=  registry.timer("go_api_report_dial_response_time", "url",callReportUrl);
    }
}
1.5添加具體業(yè)務(wù)代碼監(jiān)控
//統(tǒng)計(jì)請(qǐng)求次數(shù)
prometheusCustomMonitor.getReportDialRequestCount().increment();
long startTime = System.currentTimeMillis();
String company = HttpUtils.post(companyUrl,"");
//統(tǒng)計(jì)響應(yīng)時(shí)間
long endTime = System.currentTimeMillis();
prometheusCustomMonitor.getReportDialResponseTime().record(endTime-startTime, TimeUnit.MILLISECONDS);
在瀏覽器訪問(wèn)http://127.0.0.1:9001/actuator/prometheus,就可以看到服務(wù)的一系列不同類(lèi)型 metrics 信息,例如jvm_memory_used_bytes gauge、jvm_gc_memory_promoted_bytes_total counter,go_api_report_dial_request_count等
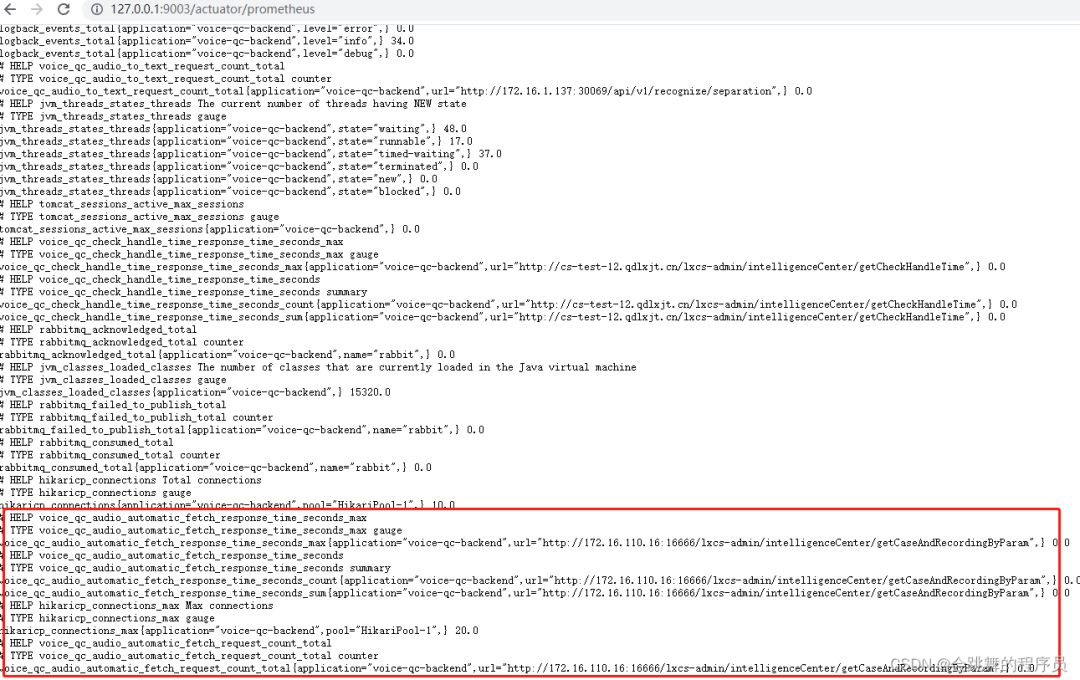
到此,Spring Boot 工程集成 Micrometer 就已經(jīng)完成,接下里就要與 Prometheus 進(jìn)行集成了。
2.集成 Prometheus
2.1安裝
docker pull prom/prometheus
mdkir /usr/local/prometheus
vi prometheus.yml
# my global config
global:
  scrape_interval: 15s # Set the scrape interval to every 15 seconds. Default is every 1 minute.
  evaluation_interval: 15s # Evaluate rules every 15 seconds. The default is every 1 minute.
  # scrape_timeout is set to the global default (10s).

# Alertmanager configuration
alerting:
  alertmanagers:
  - static_configs:
    - targets:
      # - alertmanager:9093

# Load rules once and periodically evaluate them according to the global 'evaluation_interval'.
rule_files:
  # - "first_rules.yml"
  # - "second_rules.yml"

# A scrape configuration containing exactly one endpoint to scrape:
# Here it's Prometheus itself.
scrape_configs:
  # The job name is added as a label `job=<job_name>` to any timeseries scraped from this config.
  - job_name: 'prometheus'

    # metrics_path defaults to '/metrics'
    # scheme defaults to 'http'.

    static_configs:
    - targets: ['192.168.136.129:9090']
docker run -d --name prometheus -p 9090:9090 -v/usr/local/prometheus/prometheus.yml:/etc/prometheus/prometheus.yml prom/prometheus
2.2集成配置
global:
  scrape_interval: 15s

scrape_configs:
  - job_name: "prometheus"
    static_configs:
    - targets: ["localhost:9090"]
  - job_name: "metricsLocalTest"
    metrics_path: "/actuator/prometheus"
    static_configs:
    - targets: ["localhost:9003"]
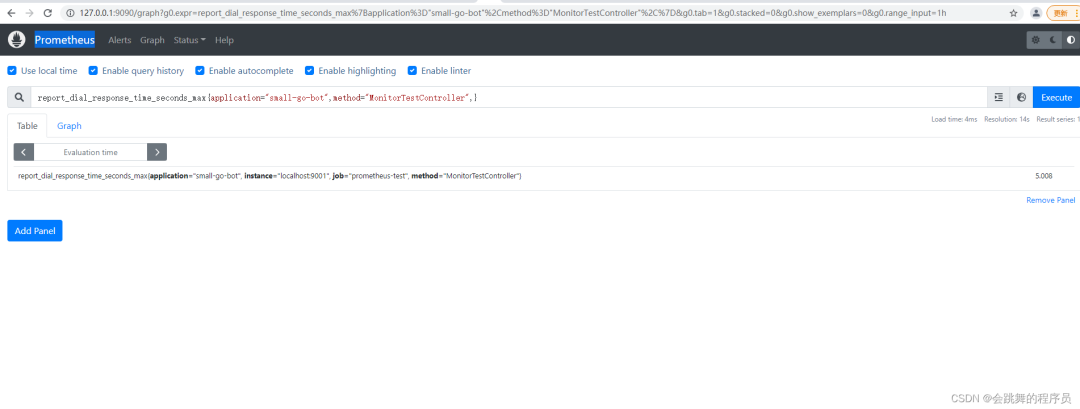
這里localhost:9001就是上邊本地啟動(dòng)的服務(wù)地址,也就是 Prometheus 要監(jiān)控的服務(wù)地址。同時(shí)可以添加一些與應(yīng)用相關(guān)的標(biāo)簽,方便后期執(zhí)行 PromSQL 查詢(xún)語(yǔ)句區(qū)分。最后重啟 Prometheus 服務(wù)

3.使用 Grafana Dashboard 展示監(jiān)控項(xiàng)
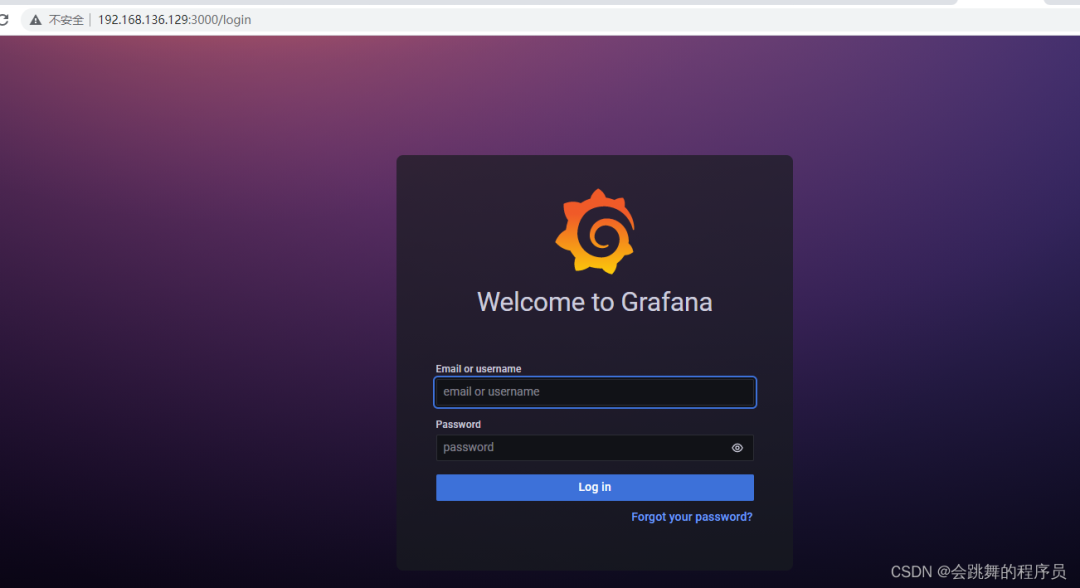
3.1安裝grafana
docker pull grafana/grafana
docker run -d --name grafana -p 3000:3000 -v /usr/local/grafana:/var/lib/grafana grafana/grafana
默認(rèn)用戶(hù)名/密碼 admin/admin
3.2配置prometheus數(shù)據(jù)源

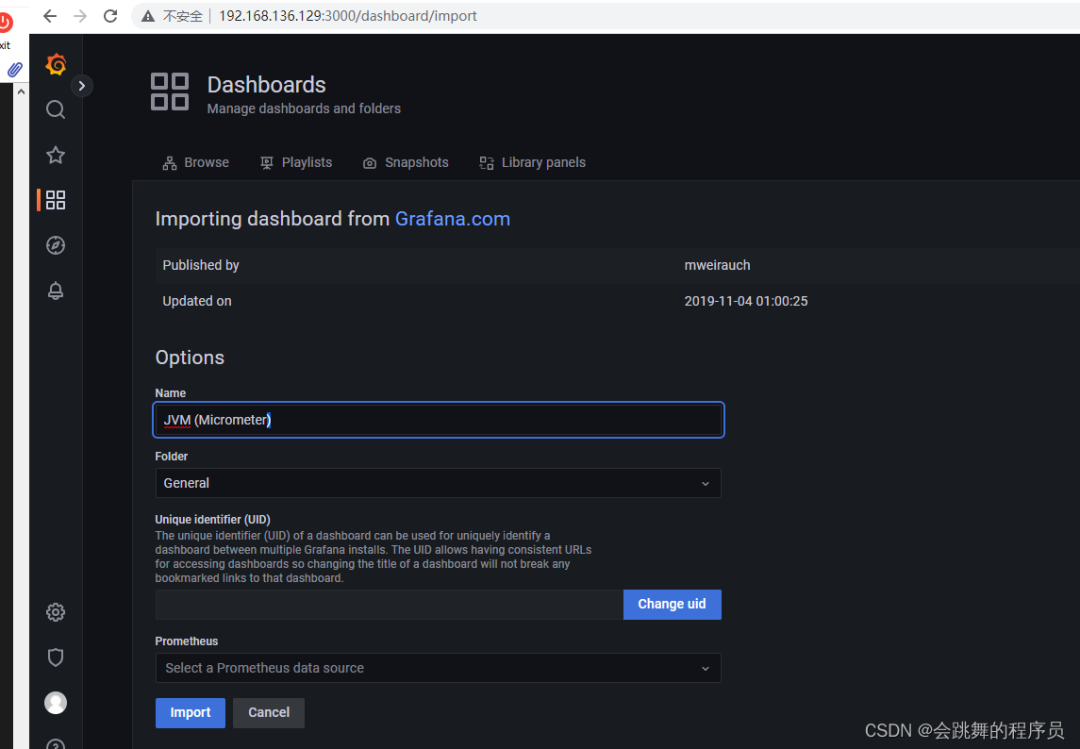
3.3增加jvm面板
模板編號(hào)為4701

3.4配置業(yè)務(wù)接口監(jiān)控面板

來(lái)源:blog.csdn.net/GZ946/article/details/126619218
往 期 推 薦
點(diǎn)分享
點(diǎn)收藏
點(diǎn)點(diǎn)贊
點(diǎn)在看


