
Python 多維數(shù)據(jù)可視化
1.平行坐標
圖中每條垂直的線代表一個特征,表中一行的數(shù)據(jù)在圖中表現(xiàn)為一條折線,不同顏色的線表示不同的類別。
import?pandas?as?pd
import?matplotlib.pyplot?as?plt
from?pandas.plotting?import?parallel_coordinates

data?=?pd.read_csv('D:\\iris.csv')

plt.figure('多維度-parallel_coordinates')
plt.title('parallel_coordinates')
parallel_coordinates(data,?'Species',?color=['blue',?'green',?'red',?'yellow'])
plt.show()

2.RadViz雷達圖
4個特征對應(yīng)于單位圓上的4個點,圓中每一個散點代表表中一行數(shù)據(jù)。可以想象為每個散點上都有4條線分別連接到4個特征點上,而特征值(經(jīng)過標準化處理)就表示這4條線施加在散點上的力,每個點的位置恰好使其受力平衡。
import?pandas?as?pd
import?matplotlib.pyplot?as?plt
from?pandas.plotting?import?radviz

data?=?pd.read_csv('D:\\iris.csv')

plt.figure('多維度-radviz')
plt.title('radviz')
radviz(data,?'Species',?color=['blue',?'green',?'red',?'yellow'])
plt.show()

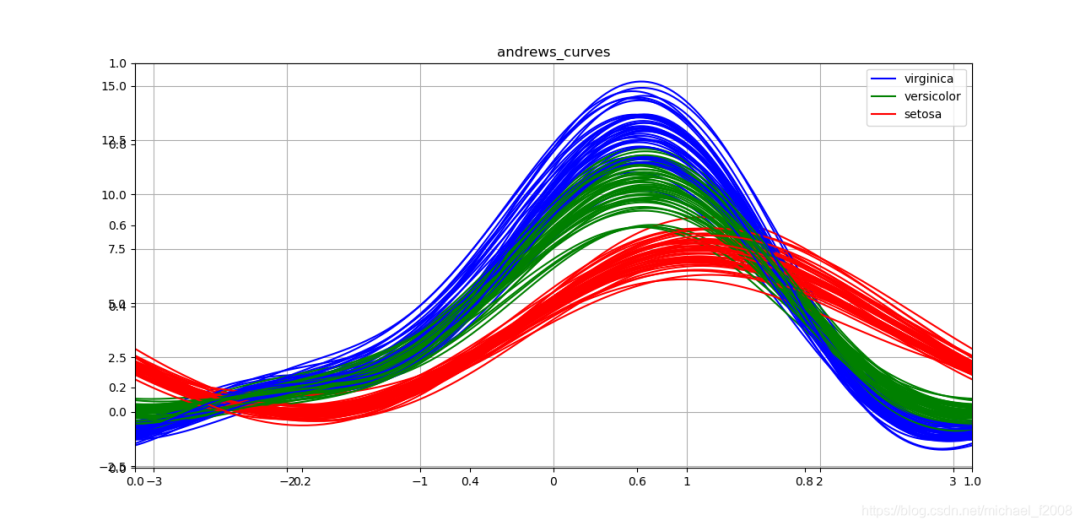
3.Andrews曲線
特征值轉(zhuǎn)化為傅里葉序列的系數(shù),不同顏色的曲線代表不同的類別。
import?pandas?as?pd
import?matplotlib.pyplot?as?plt
from?pandas.plotting?import?andrews_curves

data?=?pd.read_csv('D:\\iris.csv')

plt.figure('多維度-andrews_curves')
plt.title('andrews_curves')
andrews_curves(data,?'Species',?color=['blue',?'green',?'red',?'yellow'])
plt.show()
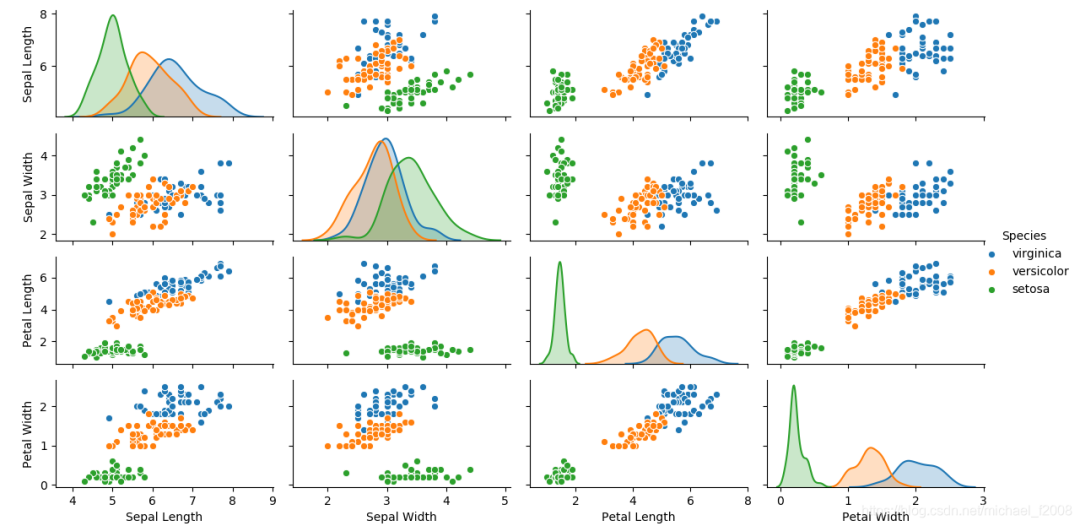
4.矩陣圖
表示不同特征之間的關(guān)系。
import?pandas?as?pd
import?matplotlib.pyplot?as?plt
import?seaborn?as?sns

data?=?pd.read_csv('D:\\iris.csv')

sns.pairplot(data,?hue='Species')
plt.show()
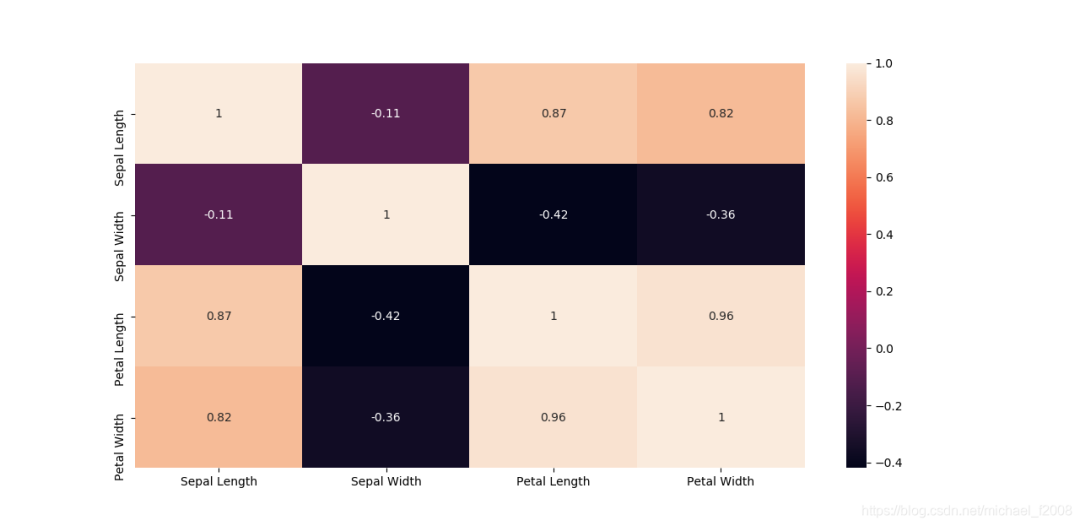
5.相關(guān)系數(shù)熱力圖
表示不同特征之間的相關(guān)性(Pearson相關(guān)系數(shù)),數(shù)值越大,相關(guān)性越高。
import?pandas?as?pd
import?matplotlib.pyplot?as?plt
import?seaborn?as?sns

data?=?pd.read_csv('D:\\iris.csv')

corr?=?data.corr()
sns.heatmap(corr,?annot=True)
plt.show()
公眾號推薦:數(shù)據(jù)思踐
數(shù)據(jù)思踐公眾號記錄和分享數(shù)據(jù)人思考和踐行的內(nèi)容與故事。
《數(shù)據(jù)科學(xué)與人工智能》公眾號推薦朋友們學(xué)習(xí)和使用Python語言,需要加入Python語言群的,請掃碼加我個人微信,備注【姓名-Python群】,我誠邀你入群,大家學(xué)習(xí)和分享。
關(guān)于Python語言,有任何問題或者想法,請留言或者加群討論。
評論
圖片
表情