
Python實現(xiàn)ARMA模型
1.導(dǎo)入相關(guān)包,查看數(shù)據(jù)情況
import?numpy?as?np?
import?pandas?as?pd?
import?matplotlib.pyplot?as?plt
plt.rcParams['font.sans-serif']?=?'SimHei'
%matplotlib?inline
df?=?pd.read_csv('./RFM分析1.csv')
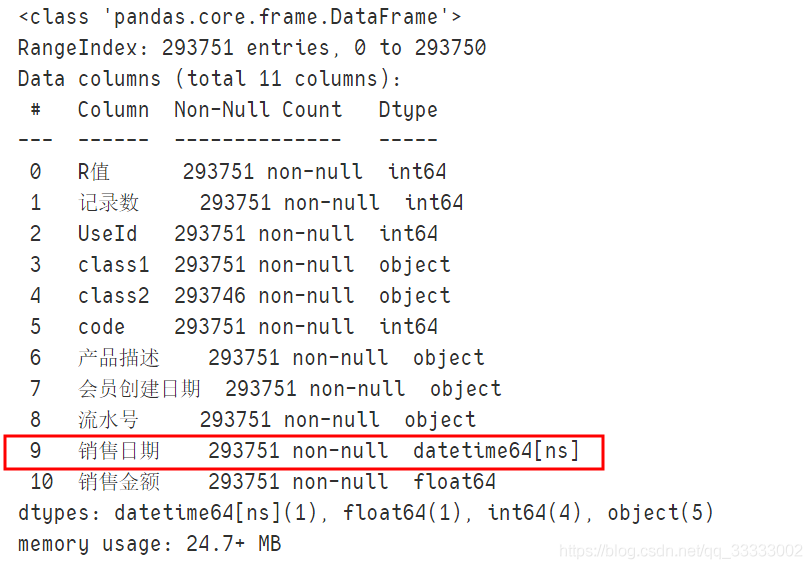
df.info()
輸出:

可以看出這里的數(shù)據(jù)比較完整,沒有缺失值不用清洗缺失值。
2.請洗數(shù)據(jù)
2.1將銷售日期轉(zhuǎn)換成datetime類型
df['銷售日期']?=?pd.to_datetime(df['銷售日期'])
#?查看是否修改成功
df.info()
輸出:
2.2 使用describe查看均值、最大、最小值情況
? ?df.describe()輸出:
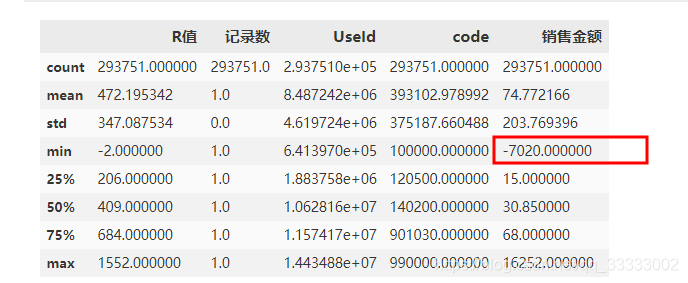
支付金額有負數(shù)。查看負數(shù)的數(shù)據(jù)有多少條。
? ? ?df[df['銷售金額']?

這里有6946條,相對于總數(shù)293751,數(shù)據(jù)比較小,直接當(dāng)異常值來處理。這里直接獲取銷售金額大于0的數(shù)據(jù)來進行分析。
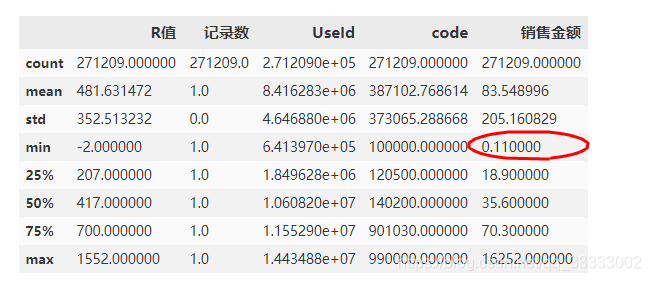
df?=?df[df['銷售金額']?>?0]
#?重新看銷售金額的最小值
df.describe()
2.3 設(shè)置銷售日期為index
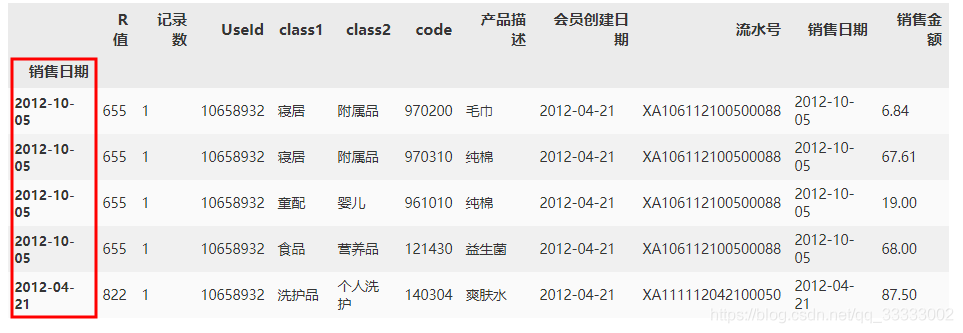
df.index?=?df['銷售日期']
df.head()
輸出:
3.利用ARMA模型進行預(yù)測
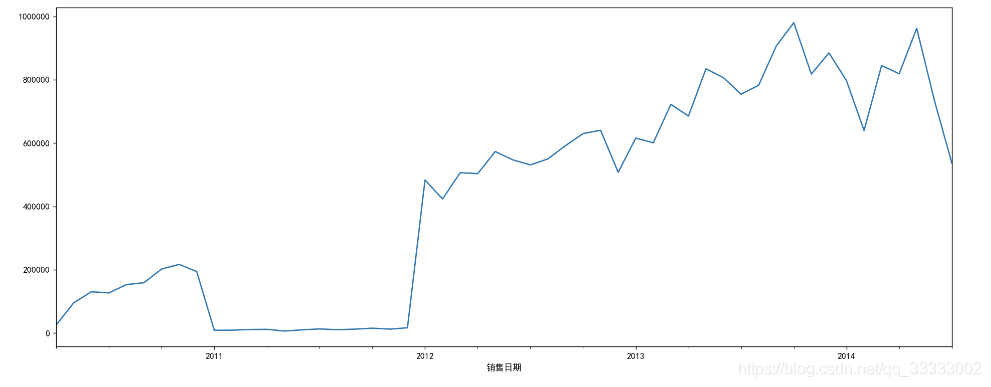
3.1 先查看現(xiàn)有的銷售趨勢
df_Month?=?df.resample('M').sum()
plt.figure(figsize=(18,?7),?dpi=128)
df_Month['銷售金額'].plot()
輸出:
3.2 對數(shù)據(jù)進行訓(xùn)練
from?statsmodels.tsa.arima_model?import?ARMA
from?datetime?import?datetime
from?itertools?import?product
#?設(shè)置p階,q階范圍
#?product?p,q的所有組合
#?設(shè)置最好的aic為無窮大
#?對范圍內(nèi)的p,q階進行模型訓(xùn)練,得到最優(yōu)模型
ps?=?range(0,?6)
qs?=?range(0,?6)
parameters?=?product(ps,?qs)
parameters_list?=?list(parameters)
best_aic?=?float('inf')
results?=?[]
for?param?in?parameters_list:
????try:
????????model?=?ARMA(df_Month['銷售金額'],?order=(param[0],?param[1])).fit()
????except?ValueError:
????????print("參數(shù)錯誤:",?param)
????????continue
????aic?=?model.aic
????if?aic?????????best_model?=?model
????????best_aic?=?model.aic
????????best_param?=?param
????results.append([param,?model.aic])
results_table?=?pd.DataFrame(results)
results_table.columns?=?['parameters',?'aic']
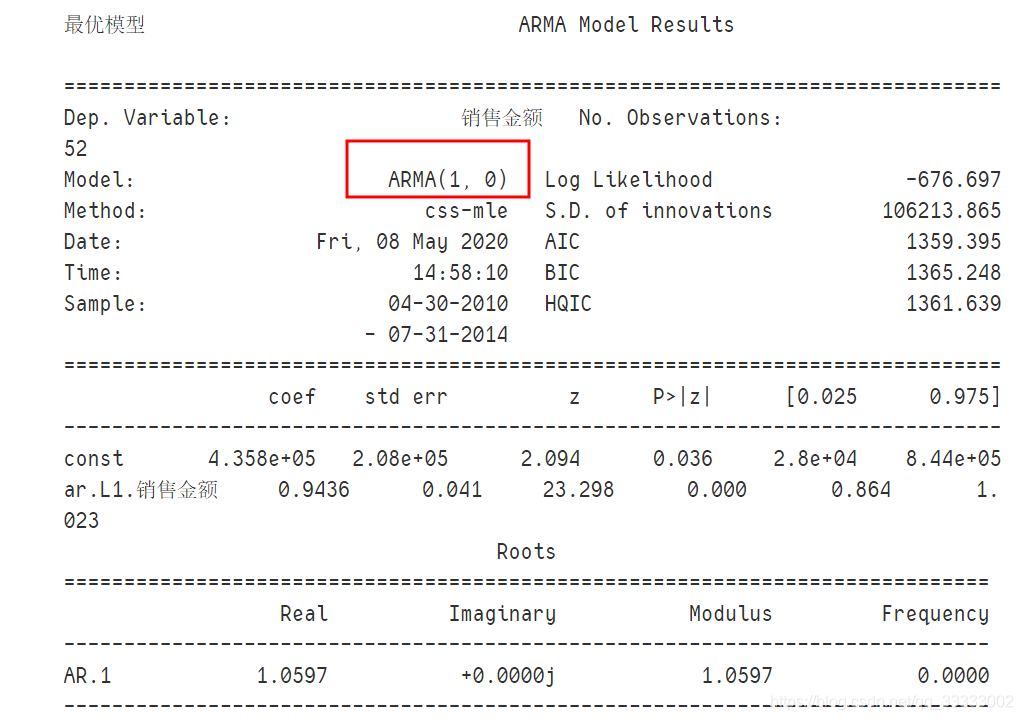
print("最優(yōu)模型",?best_model.summary())
輸出:
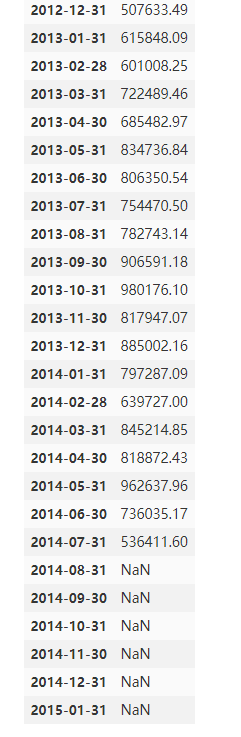
3.3 預(yù)測
#?先增加后幾個月的時間日期,進行合并
date_list?=?[datetime(2014,?8,?31),?datetime(2014,?9,?30),?datetime(2014,?10,?31),
?????????????datetime(2014,?11,?30),?datetime(2014,?12,?31),?
?????????????datetime(2015,?1,?31)]
df_Month?=?df_Month[['銷售金額']]
future?=?pd.DataFrame(index=date_list,?columns=?df_Month.columns)
df_Month?=?pd.concat([df_Month,?future])
df_Month輸出:
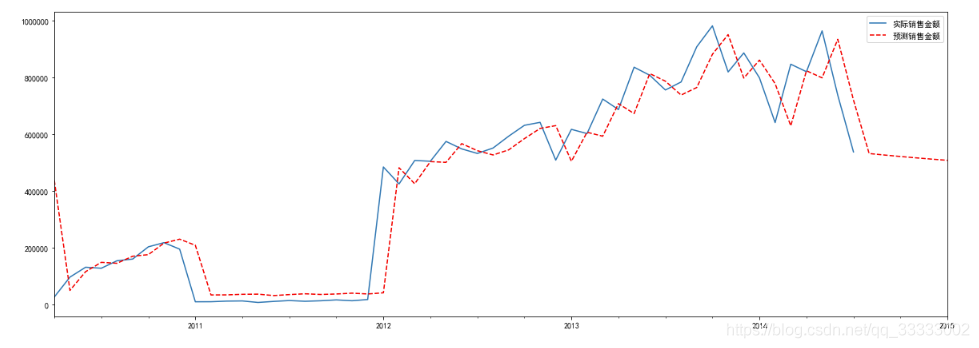
進行預(yù)測,可視化df_Month['forecast']?=?best_model.predict(start=0,?end=58)
plt.figure(figsize=(20,?7))
df_Month['銷售金額'].plot(label='實際銷售金額')
df_Month['forecast'].plot(color='r',?ls='--',?label='預(yù)測銷售金額')
plt.legend()
plt.show()
公眾號推薦:數(shù)據(jù)思踐
數(shù)據(jù)思踐公眾號記錄和分享數(shù)據(jù)人思考和踐行的內(nèi)容與故事。
《數(shù)據(jù)科學(xué)與人工智能》公眾號推薦朋友們學(xué)習(xí)和使用Python語言,需要加入Python語言群的,請掃碼加我個人微信,備注【姓名-Python群】,我誠邀你入群,大家學(xué)習(xí)和分享。
關(guān)于Python語言,有任何問題或者想法,請留言或者加群討論。
評論
圖片
表情