
如何在 ASP.Net Core 中使用 MiniProfiler
web應(yīng)用程序的性能相信是大家普遍關(guān)心的一個問題,也相信大家有很多工具可用來分析應(yīng)用程序的性能并能夠找到其中的瓶頸,MiniProfiler 就是這個領(lǐng)域中的一款產(chǎn)品,它是一款簡單的,功能強(qiáng)大的web應(yīng)用分析工具,MiniProfiler 可用來幫助我們找到 慢查詢, 慢響應(yīng) 等問題。
MiniProfiler 可用在 Asp.Net 和 ASP.Net Core 中,這篇文章將會討論如何使用 MiniProfiler,并通過它找到應(yīng)用程序的性能問題。
安裝 MiniProfiler
要想使用 MiniProfiler,需要通過 nuget 引用 MiniProfiler.AspNetCore.Mvc 包,可以通過 Visual Studio 2019 的 NuGet package manager 可視化界面安裝 或者 通過 NuGet package manager 命令行工具輸入以下命令:
dotnet?add?package?MiniProfiler.AspNetCore.Mvc
安裝好之后,接下來就要將 MiniProfiler 注入到 ServiceCollection 容器中,如下代碼所示:
????????//?This?method?gets?called?by?the?runtime.?Use?this?method?to?add?services?to?the?container.
????????public?void?ConfigureServices(IServiceCollection?services)
????????{
????????????services.AddControllersWithViews();

????????????services.AddMiniProfiler(options?=>?options.RouteBasePath?=?"/profiler");
????????}
注入好之后,接下來就需要使用 UseMiniProfiler 擴(kuò)展方法將其注入到 Request Pipeline 管道中,如下代碼所示:
????????public?void?Configure(IApplicationBuilder?app,?IWebHostEnvironment?env,?ILoggerFactory?loggerFactory)
????????{
????????????app.UseMiniProfiler();

????????????app.UseEndpoints(endpoints?=>
????????????{
????????????????endpoints.MapControllerRoute(
????????????????????name:?"default",
????????????????????pattern:?"{controller=Home}/{action=Index}/{id?}");
????????????});
????????}
然后在 _Layout.cshtml 頁面中增加如下兩行命令。
@using?StackExchange.Profiling
@addTagHelper?*,?MiniProfiler.AspNetCore.Mvc
最后需要在 WebPage 中指定 MiniProfiler 分析窗口應(yīng)該顯示的位置,那如何做呢?在 body 標(biāo)簽內(nèi)使用 mini-profiler 標(biāo)記,如下代碼所示:
"@RenderPosition.Right"?max-traces="5"?/>
在 ASP.Net Core MVC 中使用 MiniProfiler
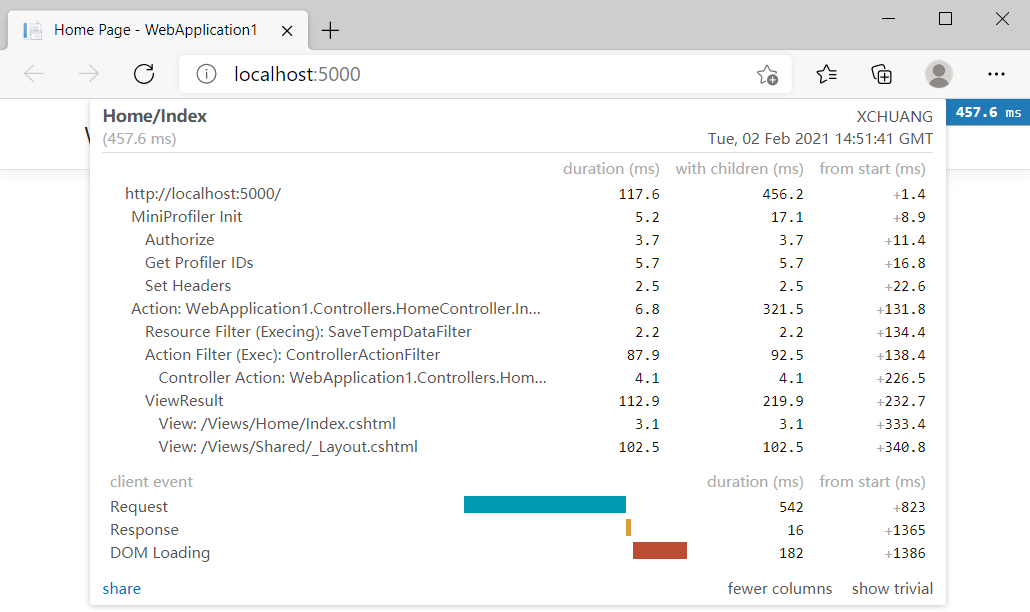
MiniProfiler 會提供 頁面加載時間 和 數(shù)據(jù)庫查詢性能指標(biāo),接下來把程序跑起來,你會看到如下的性能指標(biāo)圖。
有些朋友可能就要問了,大體時間我是知道了,那如果我只想獲取某一指定代碼塊的執(zhí)行時間呢?當(dāng)然也是可以的,下面的代碼展示了如何去實現(xiàn)。
????public?class?HomeController?:?Controller
????{
????????ILogger?logger;
????????public?HomeController(ILogger?logger )
????????{
????????????this.logger?=?logger;
????????}
????????public?IActionResult?Index()
????????{
????????????var?miniProfiler?=?MiniProfiler.Current;
????????????List?authors?=?new?List();
????????????miniProfiler.RenderIncludes(this.HttpContext);
????????????using?(miniProfiler.Step("Get?Authors"))
????????????{
????????????????authors.Add(new?Author()?{?Id?=?1,?FirstName?=?"Joydip",?LastName?=?"Kanjilal",?Address?=?"Hyderabad,?India"?});
????????????????authors.Add(new?Author()?{?Id?=?2,?FirstName?=?"Stephen",?LastName?=?"Smith",?Address?=?"NY,?USA"?});
????????????????authors.Add(new?Author()?{?Id?=?3,?FirstName?=?"Anand",?LastName?=?"Narayanan",?Address?=?"Chennai,?India"?});
????????????????authors.Add(new?Author()?{?Id?=?4,?FirstName?=?"Steve",?LastName?=?"Jones",?Address?=?"London,?UK"?});
????????????}
????????????return?View(authors);
????????}
????}
????public?class?Author
????{
????????public?int?Id?{?get;?set;?}
????????public?string?FirstName?{?get;?set;?}
????????public?string?LastName?{?get;?set;?}
????????public?string?Address?{?get;?set;?}
????}
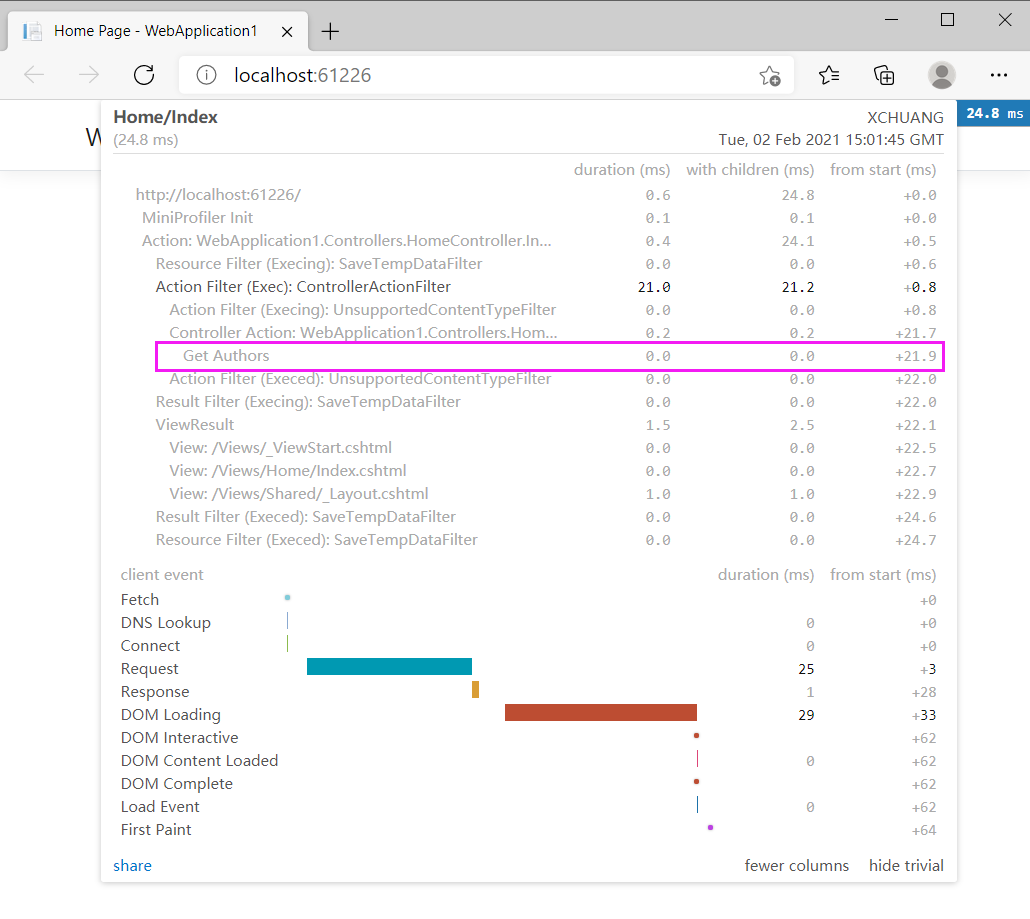
從上面的代碼中可以看到,我用 using (miniProfiler.Step("Get Authors")) 做了語句塊標(biāo)記,理論上 mini-profile 窗口上應(yīng)該有類似 Get Authors 指標(biāo)欄,接下來把程序跑起來,一起來看看效果。
除了順向操作,你也可以指定讓某些代碼塊不要顯示在 mini-profile 中,需要做的是調(diào)用 Ignore() 即可,如下代碼所示:
using?(MiniProfiler.Current.Ignore())
{
??//?Write?code?here?that?you?don't
??//?want?MiniProfiler?to?profile
}
使用 MiniProfile 分析 ADO.NET 查詢
除了做一些常規(guī)的頁面分析,還可以直接對 ADO.NET 查詢性能進(jìn)行分析,這就????了,要這么做的話,需要使用 ProfileDbConnection 和 ProfileDbCommand 即可,如下代碼所示:
????????public?IActionResult?Index()
????????{
????????????using?(SqlConnection?connection?=?new?SqlConnection(@"Data?Source=.;?Initial?Catalog=PYZ_L;?Trusted_Connection=Yes"))
????????????{
????????????????using?(ProfiledDbConnection?profiledDbConnection?=?new?ProfiledDbConnection(connection,?MiniProfiler.Current))
????????????????{
????????????????????if?(profiledDbConnection.State?!=?System.Data.ConnectionState.Open)
????????????????????{
????????????????????????profiledDbConnection.Open();
????????????????????}

????????????????????using?(SqlCommand?command?=?new?SqlCommand("Select?*?From?Clothes",?connection))
????????????????????{
????????????????????????using?(ProfiledDbCommand?profiledDbCommand?=?new?ProfiledDbCommand(command,?connection,?MiniProfiler.Current))
????????????????????????{
????????????????????????????var?data?=?profiledDbCommand.ExecuteReader();
????????????????????????????//Write?code?here?to?populate?the?list?of?Authors
????????????????????????}
????????????????????}
????????????????}
????????????}

????????????return?View();
????????}
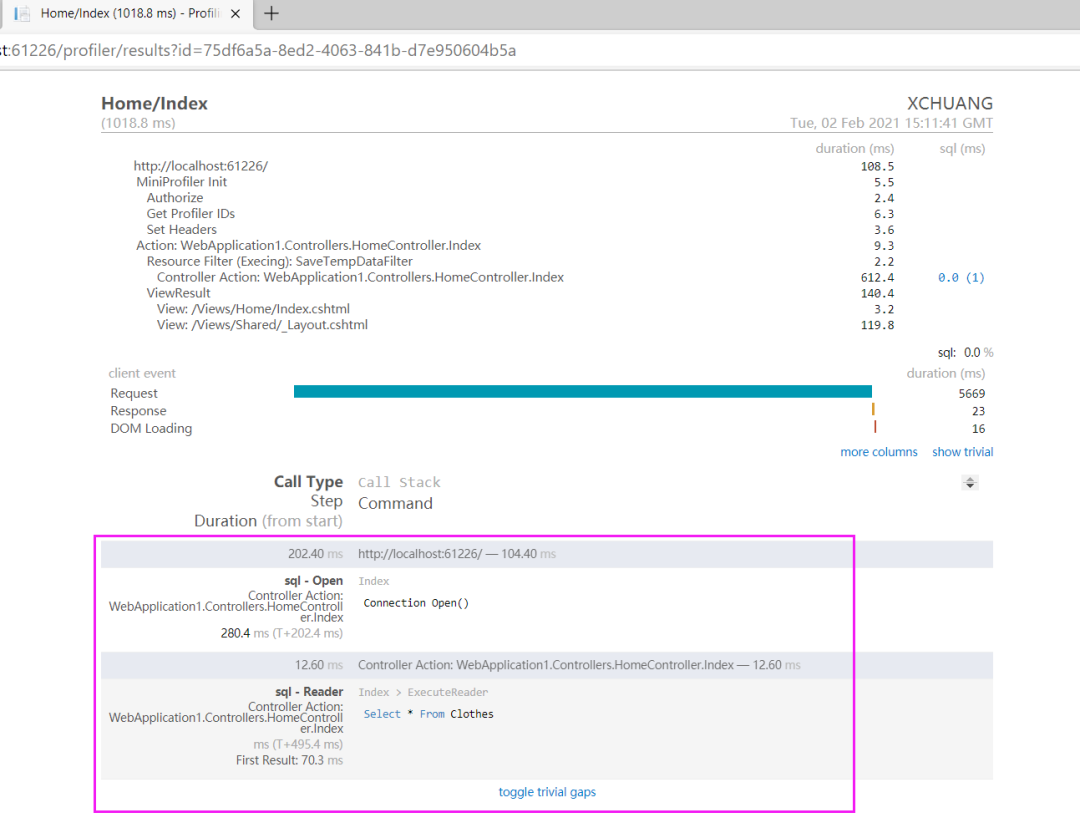
從上圖可以看到,確實對 ADO.NET 查詢有著清晰的分析,相信在幫助大家分析問題時很有幫助。
MiniProfiler 是一個可應(yīng)用于 .NET, Ruby, Go 和 Node.js 的性能分析工具,你可以使用 MiniProfiler 去分析 Dapper,Linq2SQL,Entity Framework 所使用的sql的查詢性能,此外 MimiProfile 之所以 Mini,意味著它介入到你的應(yīng)用程序中所帶來的性能開銷微乎其微,所以大家可放心的丟到生產(chǎn)上去吧!
譯文鏈接:https://www.infoworld.com/article/3330560/how-to-use-miniprofiler-in-aspnet-core.html