
JuiceFS 集成Grafana性能監(jiān)控
1.客戶端設(shè)置
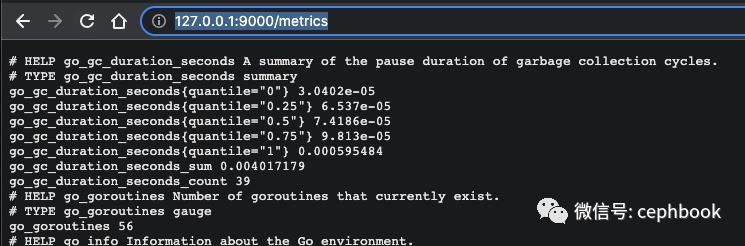
默認mount起來,會在客戶端本地監(jiān)聽127.0.0.1:9567,這里修改了默認配置到127.0.0.1:9000,瀏覽器打開http://127.0.0.1:9000/metrics就能看到對應(yīng)的數(shù)據(jù)
╭─qinmuyang@QinMuYangdeiMac?/Volumes/OS2
╰─$?sudo?./juicefs?mount?--metrics?127.0.0.1:9000?redis://redisxxx?~/jfs
Password:
...
2. prometheus設(shè)置
prometheus的下載和安裝過程網(wǎng)上文章翻翻就有了,這里略過。只需要在prometheus.yml配置中加上對應(yīng)客戶端的信息即可。
scrape_configs:
??-?job_name:?'juicefs'
????scrape_interval:?15s
????scheme:?'http'
????metrics_path:?'/metrics'
????static_configs:
??????-?targets:?['localhost:9000']
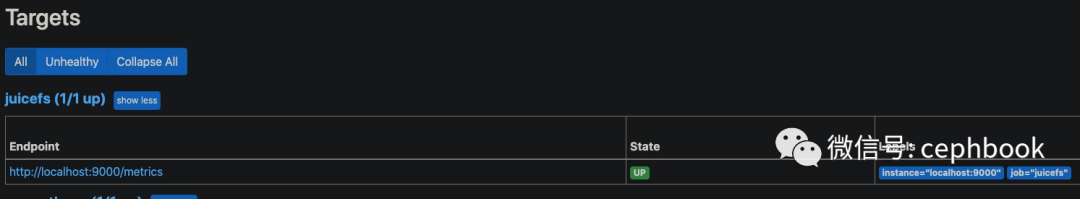
配置成功以后,打開prometheus的管理界面http://127.0.0.1:9090/targets,就可以看到對應(yīng)的job信息,注意State=UP才算正常。
3. Grafana配置
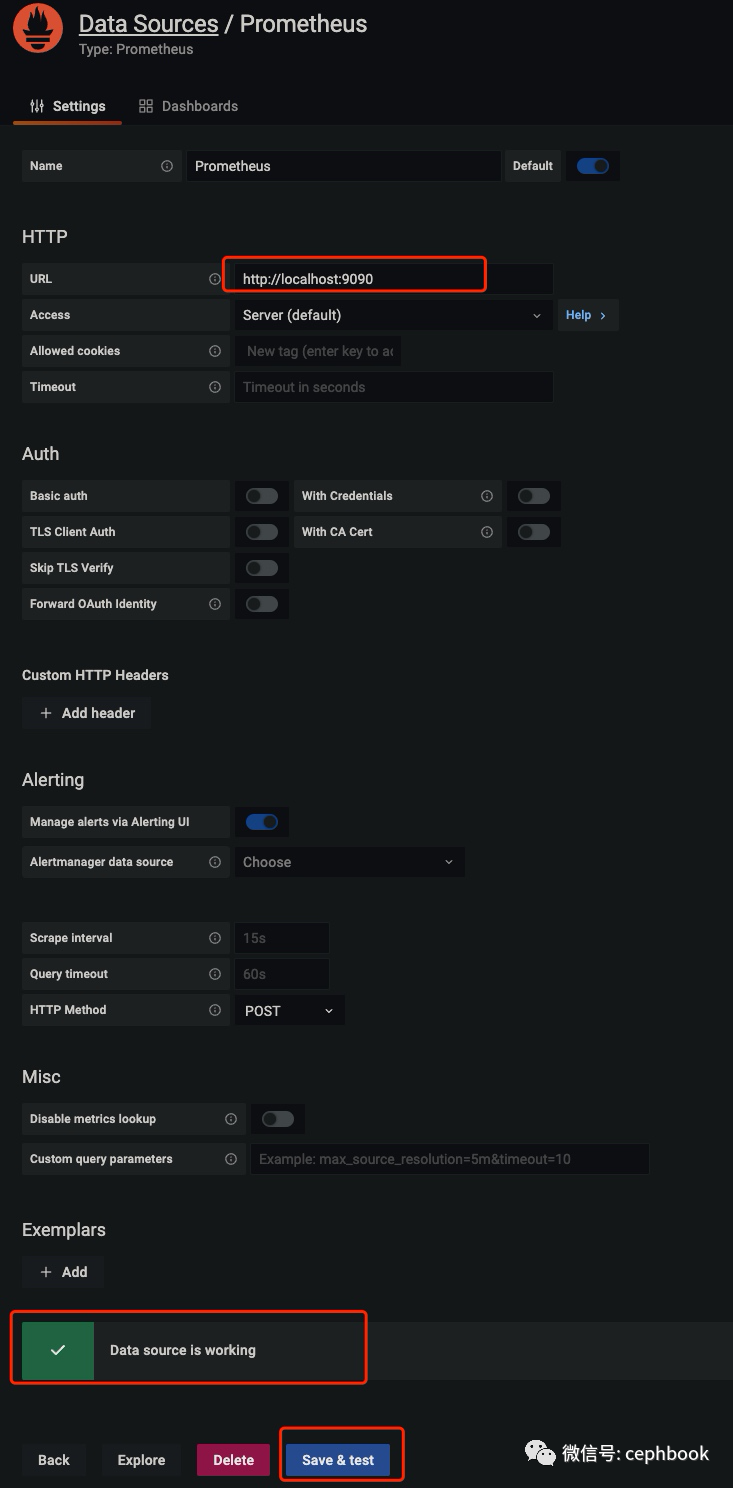
先導入數(shù)據(jù)源,選擇Prometheus類型,添加對應(yīng)的Prometheus服務(wù)地址,點擊Save&Test,看到Data source is working就成功了
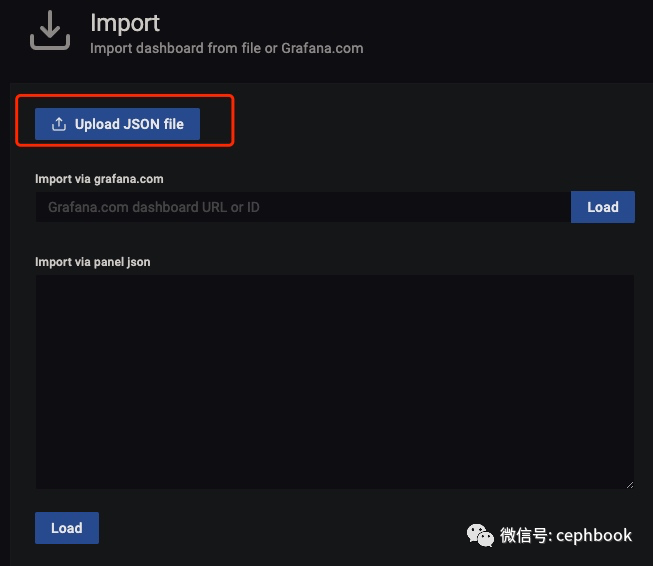
之后從Juicefs官方下載儀表盤模板,首頁的+選擇Import,選擇對應(yīng)的json文件即可完成導入
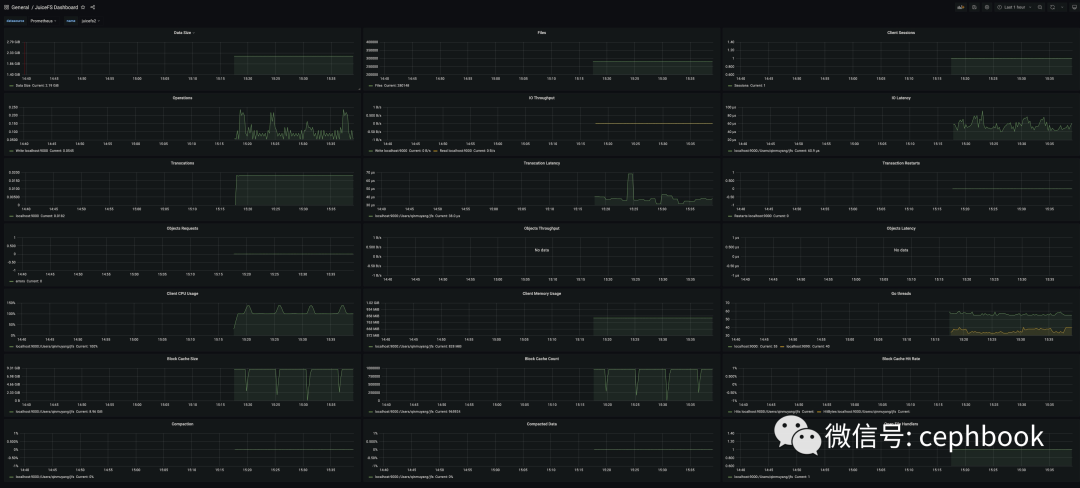
之后就可以在dashboard界面看到監(jiān)控數(shù)據(jù)了
其他
儀表盤模板:https://github.com/juicedata/juicefs/blob/main/docs/en/grafana_template.json
參考資源 https://github.com/juicedata/juicefs/blob/0c40e3a9919731fd97ab538dc0ba393086090a4b/docs/zh_cn/administration/monitoring.md#%E7%9B%91%E6%8E%A7
評論
圖片
表情