
Prometheus + Grafana 搭建監(jiān)控報警系統(tǒng)
“?Prometheus 作為云原生下繼 kubernetes 之后的第二個寵兒, 未來很可能是監(jiān)控報警領(lǐng)域的翹楚, 而任何系統(tǒng)都離不開監(jiān)控和報警, 因此學(xué)習(xí)?Prometheus 一定會對開發(fā)人員現(xiàn)在及以后產(chǎn)生巨大的幫助!”
1. 簡介
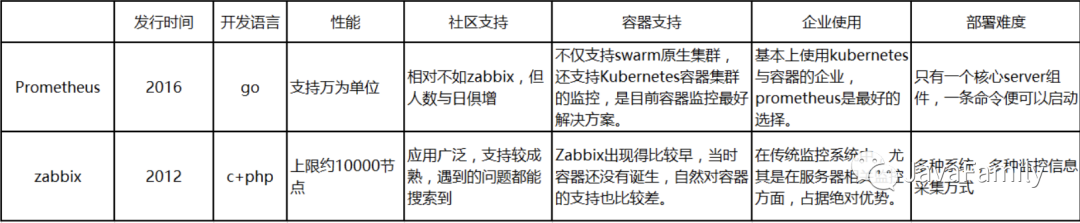
? ? ? 監(jiān)控報警目前比較主流的解決方案有云原生新秀 Prometheus 、老牌 Zabbix 等等, 下圖是兩種技術(shù) Prometheus 與 Zabbix 的對比, 本文將介紹 Prometheus + Grafana 搭建服務(wù)器/虛擬機、SpringBoot 應(yīng)用服務(wù)的監(jiān)控報警及可視化.
? ? ? 掃碼參與討論, 分享您現(xiàn)在正在用的監(jiān)控報警系統(tǒng)架構(gòu), 去幫助更多的人.
1.1 Prometheus
? ? ? Kubernetes 自從2012年開源以來便以不可阻擋之勢成為容器領(lǐng)域調(diào)度和編排的領(lǐng)頭羊,Kubernetes 是 Google Borg 系統(tǒng)的開源實現(xiàn),于此對應(yīng) Prometheus 則是 Google BorgMon 的開源實現(xiàn)。Prometheus(中文名:普羅米修斯)是由SoundCloud開發(fā)的開源監(jiān)控報警系統(tǒng)和時序列數(shù)據(jù)庫(TSDB). Prometheus使用Go語言開發(fā), 2016年,由Google發(fā)起的 Linux 基金會旗下的云原生基金會(Cloud Native Computing Foundation)將Prometheus 納入繼 Kubernetes 之后的其第二大開源項目。Prometheus 在開源社區(qū)也十分活躍,在GitHub上擁有兩萬多Star,并且系統(tǒng)每隔一兩周就會有一個小版本的更新,而Prometheus與它的“師兄”Kubernetes" 都自帶云原生的光環(huán),天然能夠友好協(xié)作。
1.1.1 Prometheus
? ? ? Prometheus的基本原理是通過HTTP協(xié)議周期性抓取被監(jiān)控組件的狀態(tài), 任意組件只要提供對應(yīng)的HTTP接口就可以接入監(jiān)控. 不需要任何SDK或者其他的集成過程。輸出被監(jiān)控組件信息的HTTP接口被叫做exporter,目前開發(fā)常用的組件大部分都有exporter可以直接使用, 比如Nginx、MySQL、Linux系統(tǒng)信息、Mongo、ES等
1.1.2 Exporter
? ? ? Prometheus可以理解為一個數(shù)據(jù)庫+數(shù)據(jù)抓取工具, 工具從各處抓來統(tǒng)一的數(shù)據(jù), 放入 prometheus 這一個時間序列數(shù)據(jù)庫中. 那如何保證各處的數(shù)據(jù)格式是統(tǒng)一的呢? 就是通過這個exporter. Exporter是一類數(shù)據(jù)采集組件的總稱. Exporter負(fù)責(zé)從目標(biāo)處搜集數(shù)據(jù), 并將其轉(zhuǎn)化為 Prometheus 支持的格式, 它開放了一個http接口(以便Prometheus來抓取數(shù)據(jù)). 與傳統(tǒng)的數(shù)據(jù)采集組件不同的是, Exporter 并不向中央服務(wù)器發(fā)送數(shù)據(jù), 而是等待中央服務(wù)器(如Prometheus等)主動前來抓取。https://github.com/prometheus 有很多寫好的 exporter, 可以直接下載使用。
1.1.3 架構(gòu)
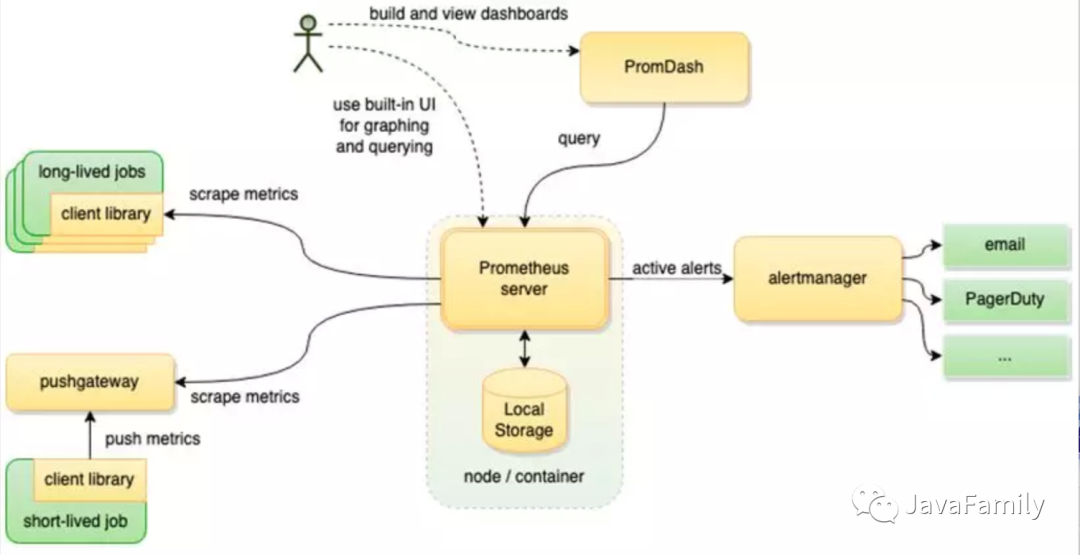
Prometheus Server負(fù)責(zé)定時在目標(biāo)上抓取metrics(指標(biāo))數(shù)據(jù)并保存到本地存儲里面。Prometheus采用了一種Pull(拉)的方式獲取數(shù)據(jù),不僅降低客戶端的復(fù)雜度,客戶端只需要采集數(shù)據(jù),無需了解服務(wù)端情況,而且服務(wù)端可以更加方便的水平擴展。如果監(jiān)控數(shù)據(jù)達(dá)到告警閾值 Prometheus Server 會通過 HTTP 將告警發(fā)送到告警模塊alertmanger,通過告警的抑制后觸發(fā)郵件或者webhook。Prometheus 支持 PromQL 提供多維度數(shù)據(jù)模型和靈活的查詢,通過監(jiān)控指標(biāo)關(guān)聯(lián)多個 tag 的方式,將監(jiān)控數(shù)據(jù)進(jìn)行任意維度的組合以及聚合。
1.2 Grafana
Grafana是一個圖形化工具, 它可以從很多種數(shù)據(jù)源(例如Prometheus)中讀取數(shù)據(jù)信息, 使用很漂亮的圖表來展示數(shù)據(jù), 并且有很多開源的 dashborad 可以使用, 可以快速地搭建起一個非常精美的監(jiān)控平臺。它與Prometheus的關(guān)系就類似于Kibana與ElasticSearch。所有的 Dashboard 都可以在 https://grafana.com/grafana/dashboards 檢索到.
2. 通過 Docker 部署
部署采用 Docker(Docker-Compose) 容器化部署. ------ 能不安裝的絕不手動安裝.
2.1 部署 Prometheus
2.1.1 創(chuàng)建配置文件 prometheus.yml
所有配置文件可以先通過
2.1.2啟動過程中不掛載配置文件路徑啟動, 然后通過docker cp命令從容器里面 copy 到本地磁盤, 再通過掛載路徑啟動.
# my global config
global:
  scrape_interval: 15s # Set the scrape interval to every 15 seconds. Default is every 1 minute.
  evaluation_interval: 15s # Evaluate rules every 15 seconds. The default is every 1 minute.
  # scrape_timeout is set to the global default (10s).

alerting:
  alertmanagers:
    - static_configs:
        - targets:
          # - alertmanager:9093

rule_files:
  # - "first_rules.yml"
  # - "second_rules.yml"

scrape_configs:
  # 配置監(jiān)控的 Job
  - job_name: "prometheus"
    # 拉取監(jiān)控數(shù)據(jù)的地址 --> 完整路徑即為 targets[i]/metrics_path, 本 Job 即為http://localhost:9090/metrics
    metrics_path: '/metrics'
    static_configs:
      # 監(jiān)控的目標(biāo) -- 這里配置的是監(jiān)控 prometheus 自身
      - targets: ['localhost:9090']
        # 添加一個標(biāo)示
        labels:
          instance: prometheus
2.1.2 啟動 Prometheus
docker run  -d --name prometheus \
  -p 9090:9090 \
  -v ${CONF_DIR}/prometheus/prometheus.yml:/etc/prometheus/prometheus.yml  \
  prom/prometheus
2.1.3 測試
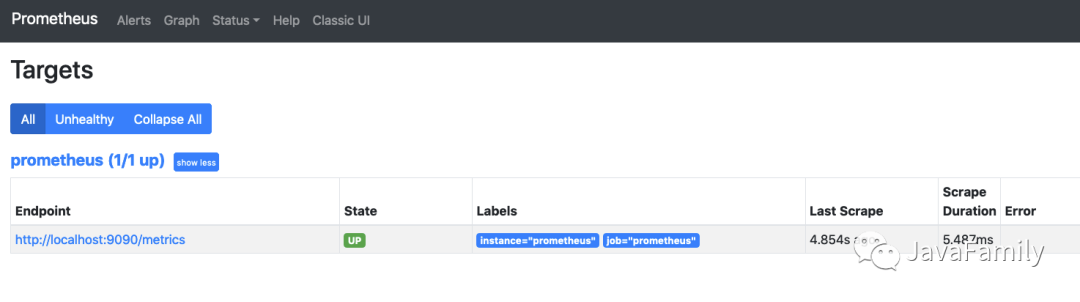
通過訪問 http://localhost:9090/targets 就可以看到打開 Prometheus 自帶的可視化頁面并查看監(jiān)控 Job 的狀態(tài)
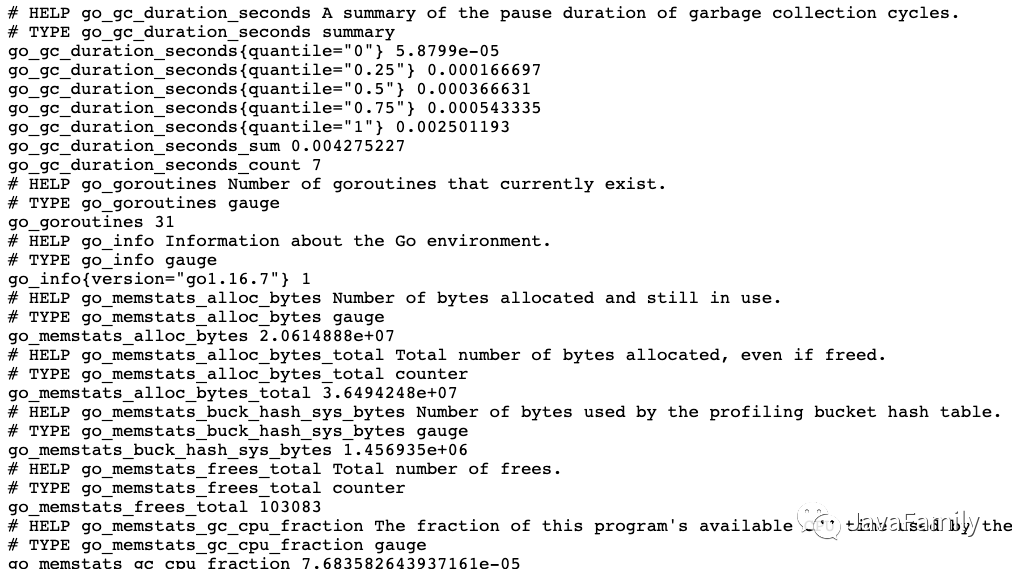
通過訪問 [http://localhost:9090/metrics] 也可以看到 Prometheus 拉取的數(shù)據(jù)詳情
2.2 部署 Grafana
2.2.1 部署
docker run -d \
  -p 3000:3000 \
  --name=grafana \
  -v ${CONF_DIR}/grafana/:/var/lib/grafana \
  grafana/grafana
2.2.2 測試
通過訪問 http://localhost:3000 就可以看到
grafana的登錄界面, 默認(rèn)用戶名密碼是admin/admin.

3. 監(jiān)控服務(wù)器/虛擬機
上面已經(jīng)介紹過, Prometheus 監(jiān)控是通過各種 Exportor 進(jìn)行信息采集, 監(jiān)控服務(wù)器/虛擬機常用的 Exportor 就是
Node_Exportor;
3.1 部署 Node_Exportor 采集服務(wù)器/虛擬機信息
docker run -d --name node-exporter -p 9100:9100 \
  -v "/proc:/host/proc:ro" \
  -v "/sys:/host/sys:ro" \
  -v "/:/rootfs:ro" \
  prom/node-exporter
需要注意的是需要將物理機的
proc、/sys等路徑掛載, 不然采集到的數(shù)據(jù)就是容器的數(shù)據(jù)而不是服務(wù)器/物理機的數(shù)據(jù).
3.2 添加 Prometheus 監(jiān)控 Job
編輯
prometheus.yml配置文件
scrape_configs:
  # 配置監(jiān)控的 Job
  - job_name: "prometheus"
    static_configs:
      # 監(jiān)控的目標(biāo) -- 這里配置的是監(jiān)控 prometheus 自身
      - targets: ['localhost:9090']
        # 添加一個標(biāo)示
        labels:
          instance: prometheus

  - job_name: "self-node-exportor"
    static_configs:
      - targets: ['192.168.1.88:9100', '192.168.1.89:9100']
3.3 配置 Grafana 數(shù)據(jù)源
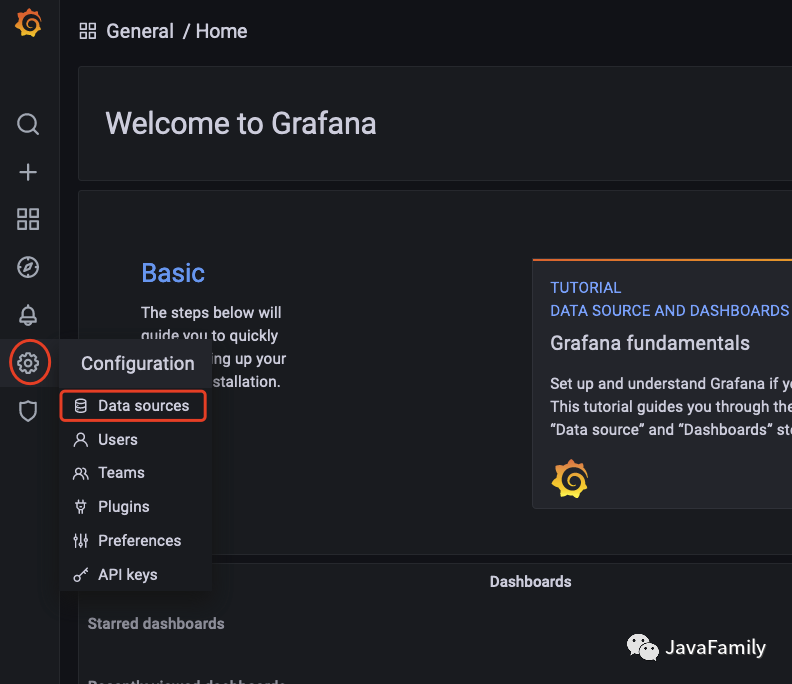
Grafana 要對 Prometheus 進(jìn)行可視化的第一步先需要配置 Prometheus 為 Grafana 的數(shù)據(jù)源
選擇數(shù)據(jù)源
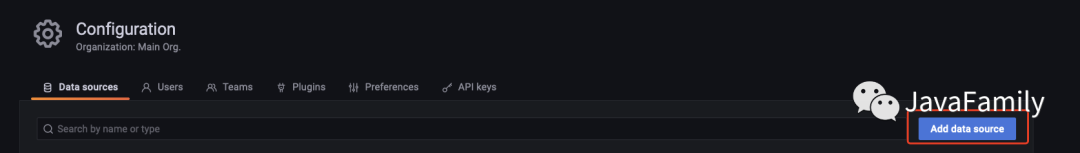
添加數(shù)據(jù)源
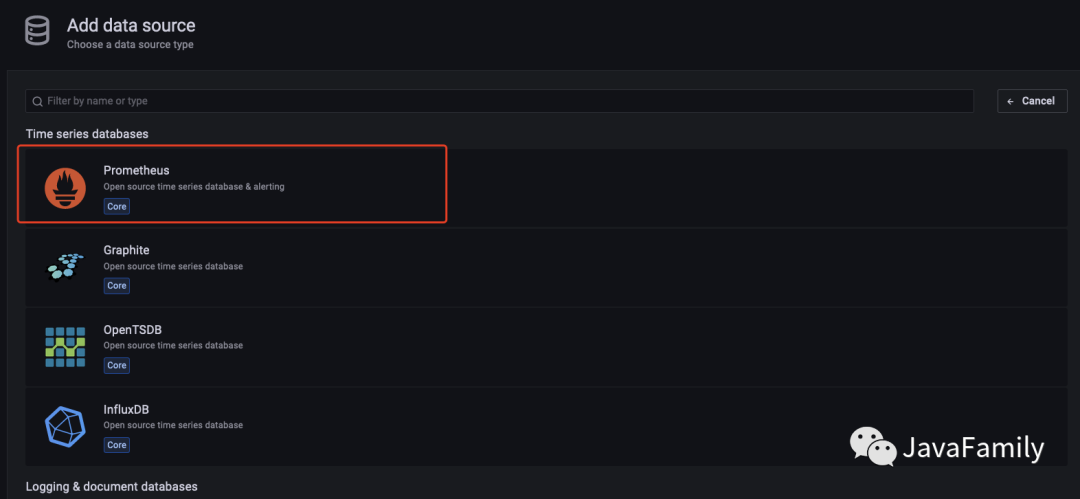
填入 Prometheus 信息
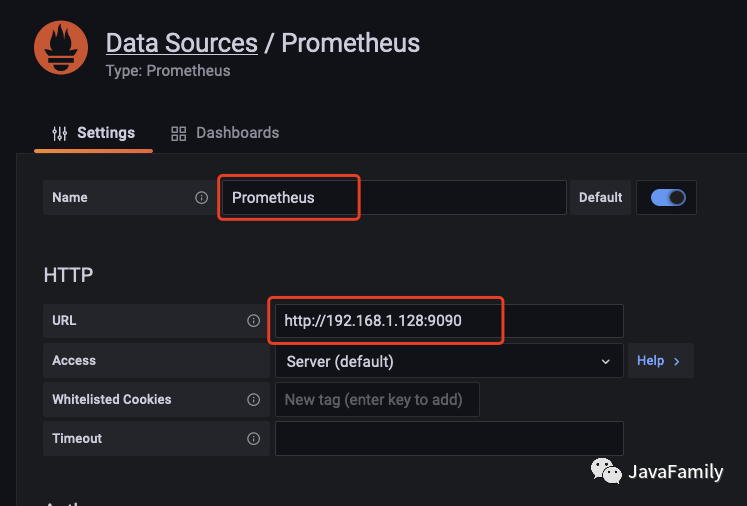
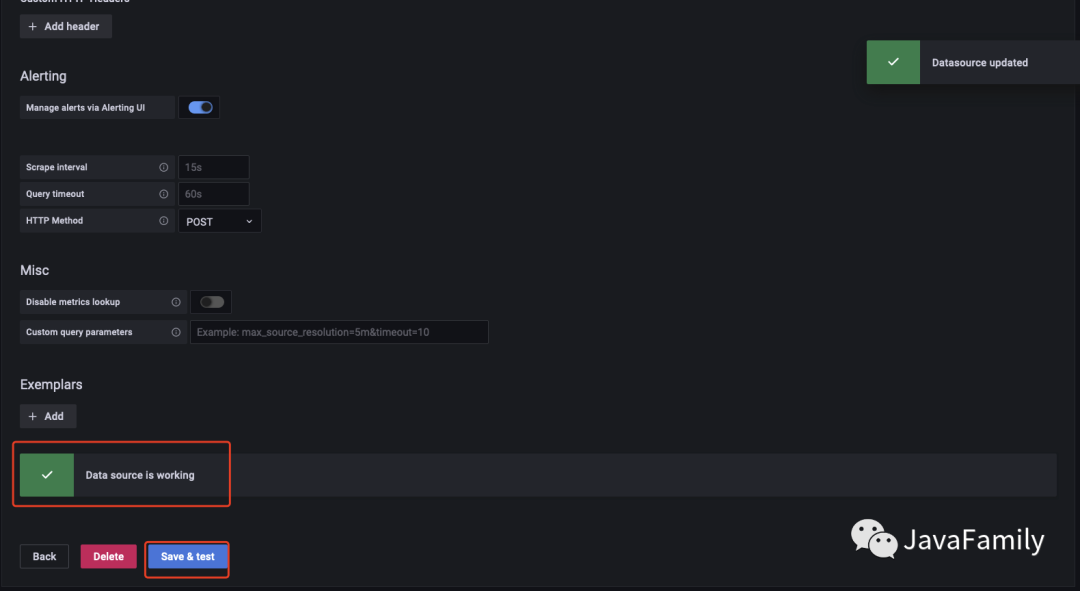
測試保存
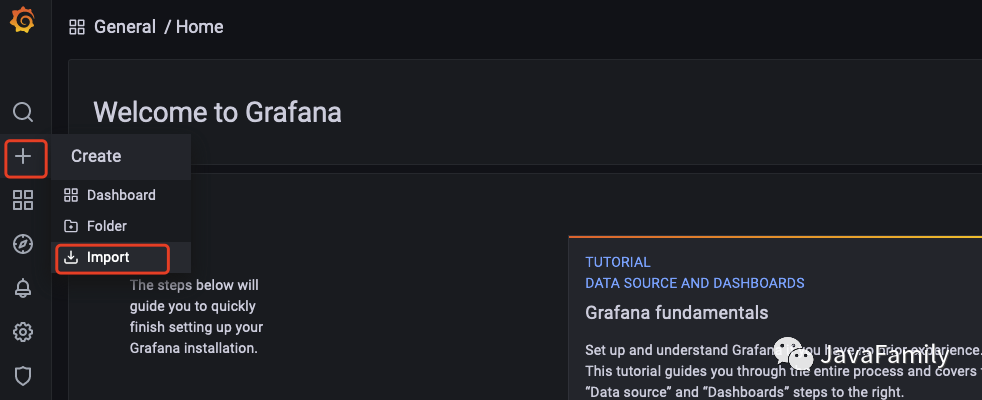
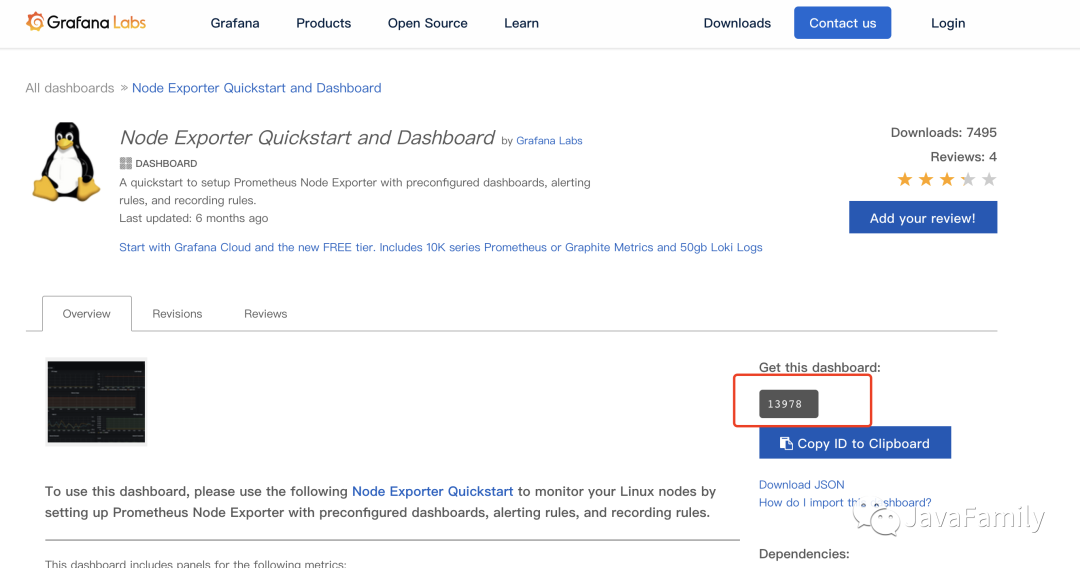
3.4 配置 Grafana 可視化儀表盤
選擇 Import
輸入
Dashboard ID再加載
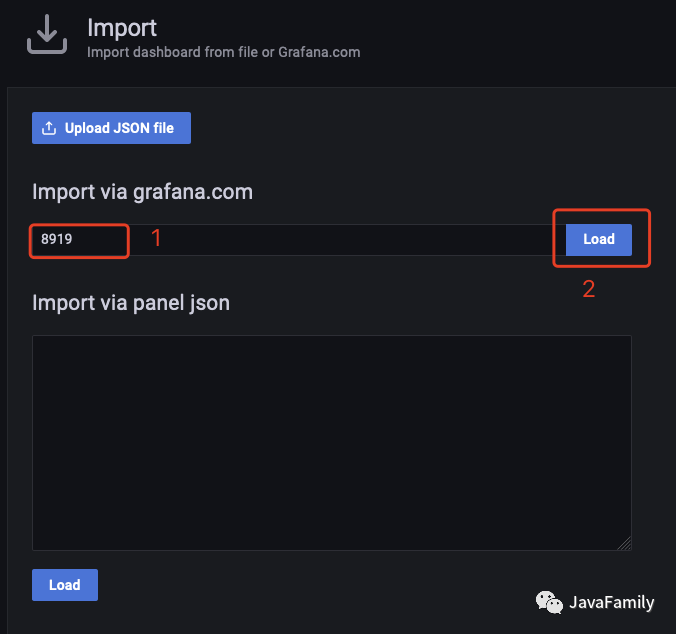
Dashboard ID可以在 https://grafana.com/grafana/dashboards 中檢索.
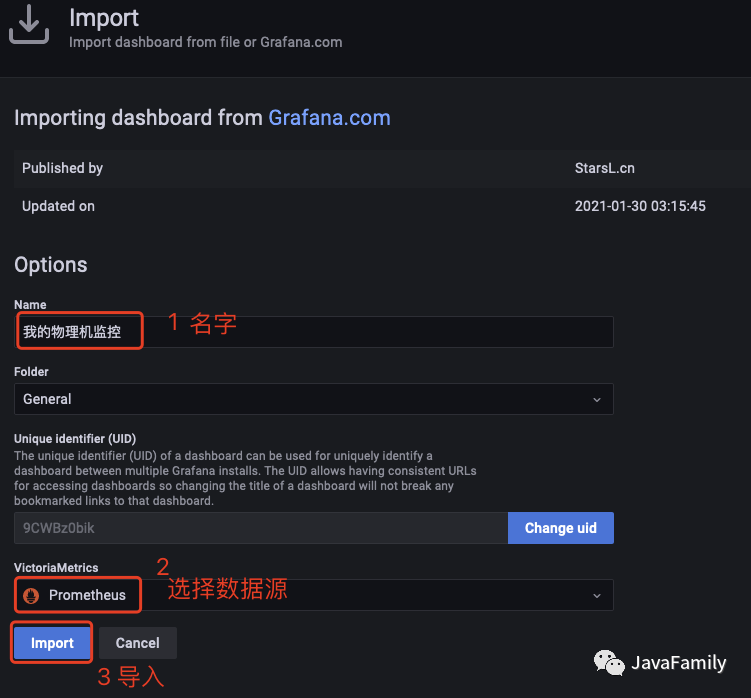
編輯 Name 和數(shù)據(jù)源, 點擊 Import
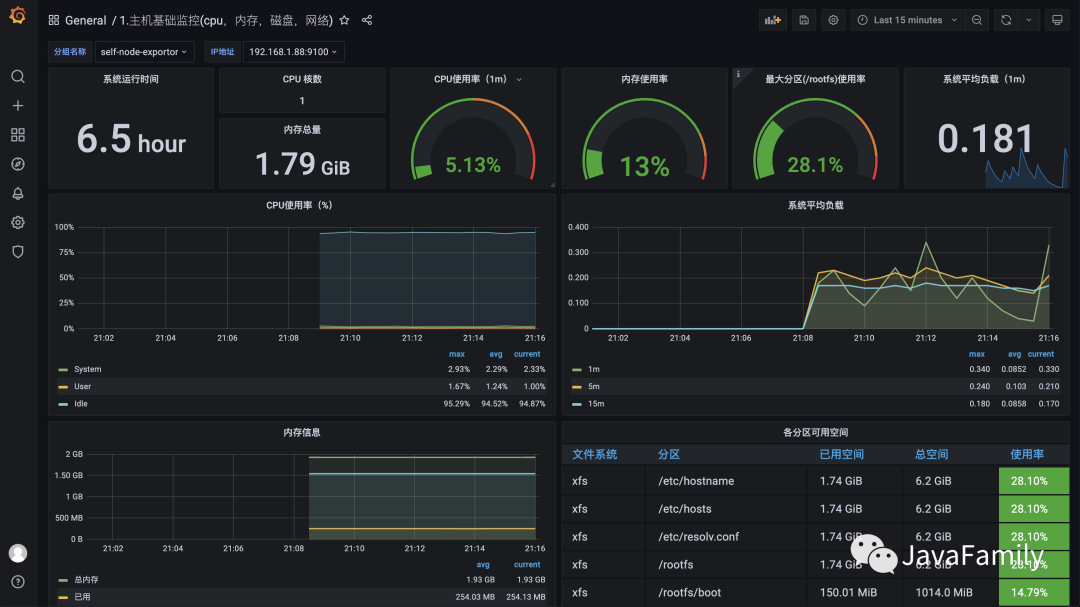
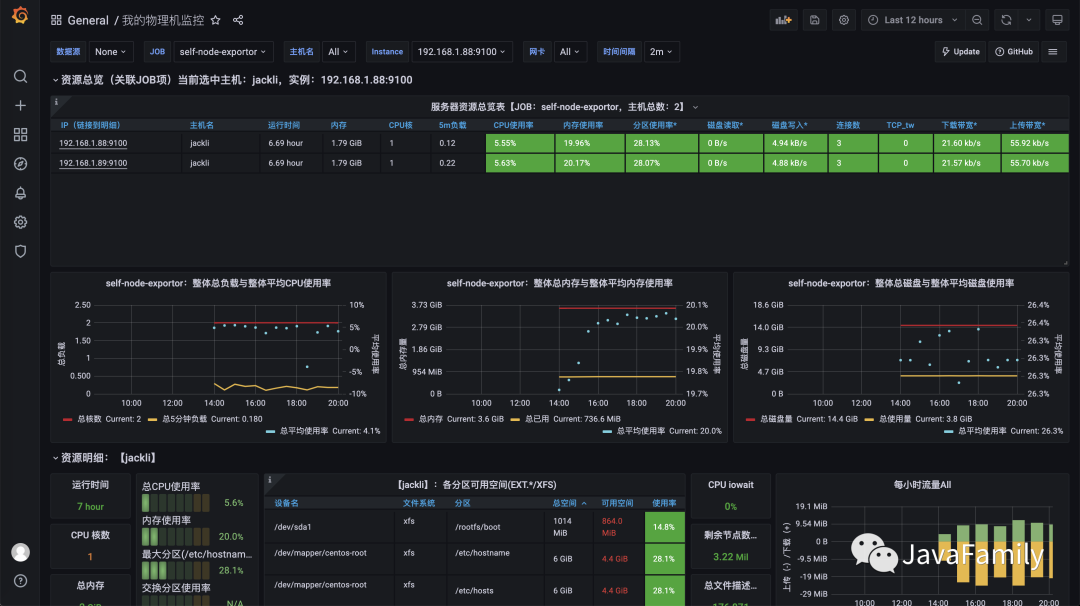
3.4 效果展示
Dashboard 9276
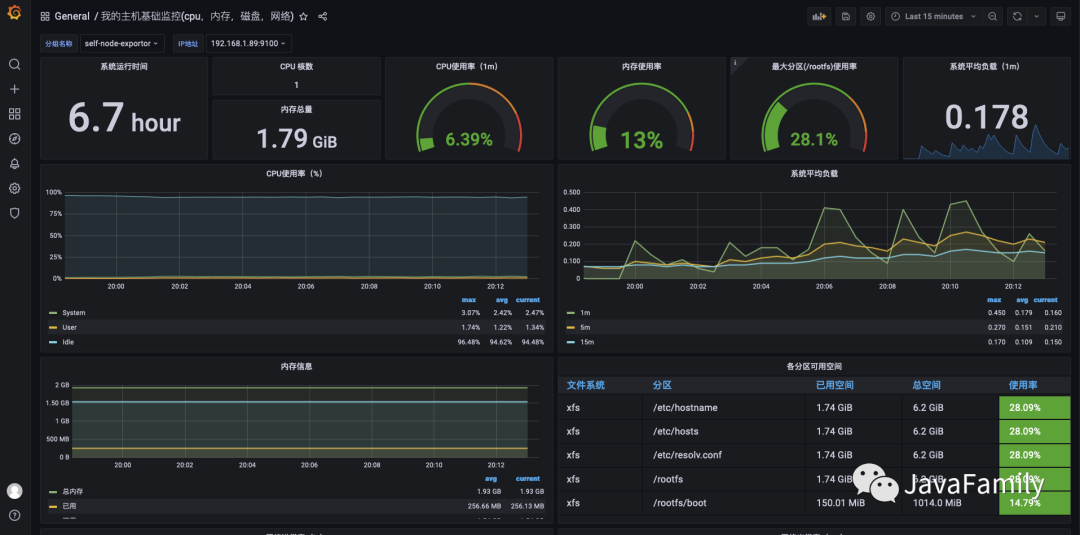
Dashboard 8919
4. 監(jiān)控 SpringBoot
隨著微服務(wù)架構(gòu)的迅猛發(fā)展, 服務(wù)水平化拆分越來越多, 系統(tǒng)服務(wù)數(shù)量也在不斷劇增, 因此, 對后臺服務(wù)的監(jiān)控報警也越來越重要. Prometheus 的 Exportor 已經(jīng)有了對 SpringBoot 數(shù)據(jù)采集的實現(xiàn) ----
micrometer-registry-prometheus, 因此便可以直接在 Prometheus 和 Grafana 的基礎(chǔ)上快速搭建起來一個 SpringBoot 的監(jiān)控報警系統(tǒng).
4.1 環(huán)境
Spring Boot: 2.3.2.RELEASE
4.2 引入依賴
micrometer-registry-prometheus需要actuator的支持.
<dependency>
     <groupId>io.micrometer</groupId>
     <artifactId>micrometer-registry-prometheus</artifactId>
</dependency>
<dependency>
     <groupId>org.springframework.boot</groupId>
     <artifactId>spring-boot-starter-actuator</artifactId>
</dependency>
4.3 配置 application.yml
server:
   port: 9411

management:
   endpoints:
      web:
         exposure:
            include: '*'
   endpoint:
      health:
         show-details: always
4.5 添加 Prometheus 監(jiān)控 Job
  - job_name: "prometheus-sb"

    # 多久采集一次數(shù)據(jù)
    scrape_interval: 15s
    # 采集時的超時時間
    scrape_timeout: 10s
    # 采集的路徑
    metrics_path: '/actuator/prometheus'

    static_configs:
      - targets: ["host.docker.internal:9411"]
其中
host.docker.internal指向 SpringBoot 的應(yīng)用地址, 由于這里 Prometheus 是在 docker 中安裝, 因此localhost和127.0.0,1都是容器內(nèi)的地址, 通過host.docker.internal可以將其映射到宿主機上. 當(dāng)然, 你也可以直接配置成你真實的 IP 地址(192.168.1.128)也是可以的.
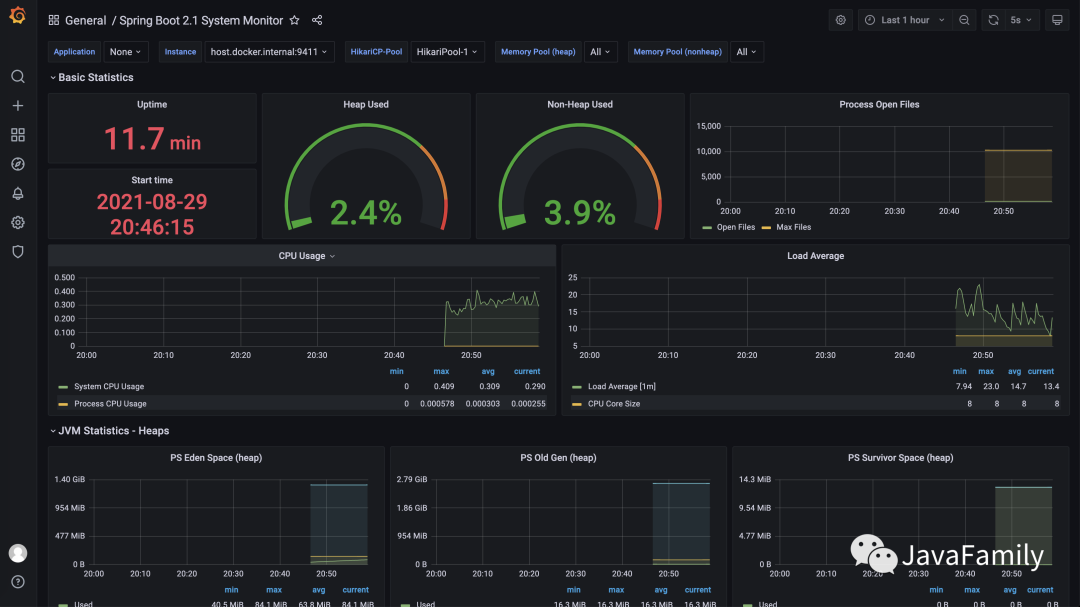
4.6 配置 Grafana 儀表板
Grafana 監(jiān)控 SpringBoot, SpringCloud, k8s 等都有現(xiàn)成的 Dashboard, 帥帥這里找了一個 ---
11378, 大家按照上面的步驟添加就可以使用
4.7 效果展示
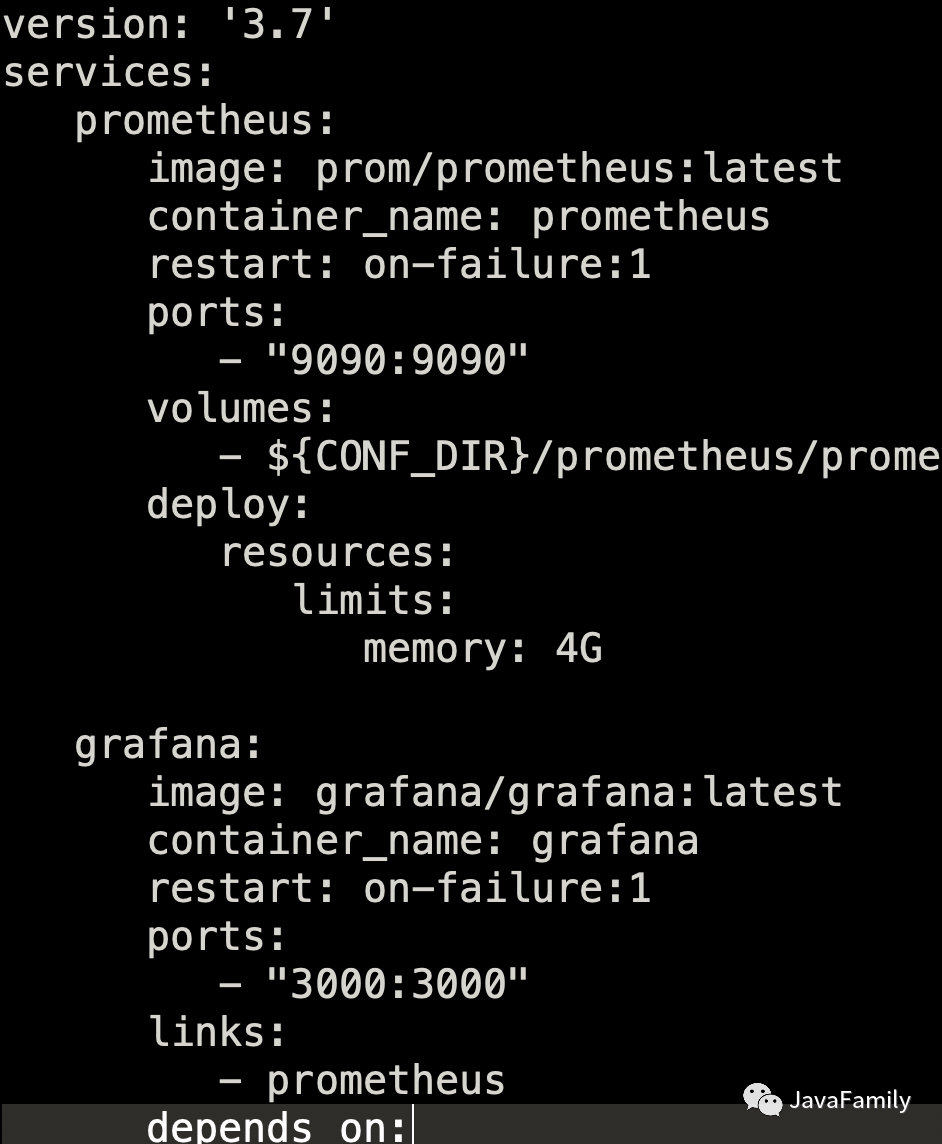
5. Docker-Compose 一鍵部署 Prometheus 和 Grafana
還是那句老話, 既然大俠已經(jīng)看到這里了, 那小弟也不藏著掖著了, 公眾號后臺回復(fù) PGM 即可拿到帥帥整理好的 Prometheus 和 Grafana 的 docker compose 配置文件以及 Prometheus 配置文件, 一個 up 命令啟動 Prometheus 和 Grafana, 一個 down 命令停止 , 它? 不香嗎?
? ? ? ?
? ? ? ? 如果有任何相關(guān)的問題都可以加入 QQ/微信群一起討論, 學(xué)習(xí), 進(jìn)步. 此外如果有任何對于本公眾號的意見和建議也歡迎大家留言積極批評指正, 最后, 愿你我都能成為更好的自己.?
? ? ? ? 我是帥帥, 一個集帥氣, 幽默與內(nèi)涵, 并且熱愛編程, 擁抱開源, 喜歡烹飪與旅游的暖男, 我們下期再見.?拜了個拜!
? ? ? ??老規(guī)矩別忘了哦,?點擊原文鏈接跳轉(zhuǎn)到我們官方的博客平臺哦.
悄悄話
————
每文一句
————
紐約時間比加州時間早三個小時,
New York is 3 hours ahead of California,
但加州時間并沒有變慢。
but it does not make California slow.
有人22歲就畢業(yè)了,
Someone graduated at the age of 22,
但等了五年才找到穩(wěn)定的工作!
but waited 5 years before securing a good job!
有人25歲就當(dāng)上CEO,
Someone became a CEO at 25,
卻在50歲去世。
and died at 50.
也有人直到50歲才當(dāng)上CEO,
While another became a CEO at 50,
然后活到90歲。
and lived to 90 years.
有人單身,
Someone is still single,
同時也有人已婚。
while someone else got married.
奧巴馬55歲就退休,
Obama retires at 55,
川普70歲才開始當(dāng)總統(tǒng)。
but Trump starts at 70.
世上每個人本來就有自己的發(fā)展時區(qū)。
Absolutely everyone in this world works based on their Time Zone.
身邊有些人看似走在你前面,
People around you might seem to go ahead of you,
也有人看似走在你后面。
some might seem to be behind you.
但其實每個人在自己的時區(qū), 有自己的步程。
But everyone is running their own RACE, in their own TIME.
不用嫉妒或嘲笑他們。
Don’t envy them or mock them.
他們都在自己的時區(qū)里,你也是!
They are in their TIME ZONE, and you are in yours!
生命就是等待正確的行動時機。
Life is about waiting for the right moment to act.
所以,放輕松。
So, RELAX.
你沒有落后。
You’re not LATE.
你也沒有領(lǐng)先。
You’re not EARLY.
在上帝為你安排的屬于自己的時區(qū)里,一切都準(zhǔn)時。
You are very much ON TIME, and in your TIME ZONE GOD set up for you.?
日常求贊
————
? ? ? 你們白漂的力量就是我拖更的史詩級動力, 點贊, 評論, 再看, 贊賞, 看都看到這了, 隨便點一個咯.
關(guān)注加好友
拉你進(jìn)大佬交流群
————————————————