
用Python繪制超酷的gif動圖,驚艷了所有人

Python當中的gif模塊來制作gif格式的圖表,gif格式圖表的新方法,調用的是matplotlib的相關模塊,其中的步驟與方法也是相當?shù)睾唵我锥?/section>下載和導入數(shù)據(jù)庫
bokeh模塊自帶的數(shù)據(jù)集,通過下面這一行代碼直接就可以下載import?bokeh
bokeh.sampledata.download()
from?bokeh.sampledata.population?import?data
import?numpy?as?np
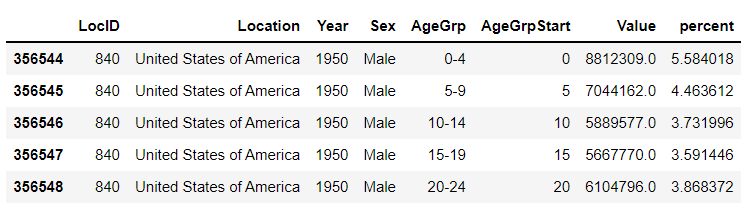
data?=?filter_loc('United?States?of?America')
data.head()
output
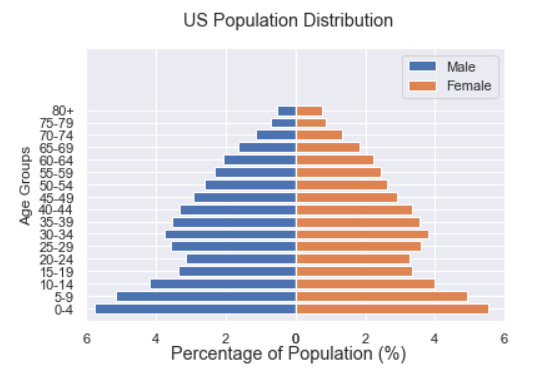
先繪制若干張靜態(tài)的圖表
我們可以先繪制若干張靜態(tài)的圖表,然后將這幾張圖表合成一張gif格式的動圖即可,代碼如下
import?seaborn?as?sns
import?matplotlib.pyplot?as?plt
import?matplotlib.patheffects?as?fx

#?繪制圖表的函數(shù)
def?make_plot(year):
????
????#?根據(jù)年份來篩選出數(shù)據(jù)
????df?=?data[data.Year?==?year]
????????
????#?制作圖表
????fig,?(ax1,?ax2)?=?plt.subplots(1,?2,?sharey?=?True)
????ax1.invert_xaxis()
????fig.subplots_adjust(wspace?=?0)?
????
????ax1.barh(df[df.Sex?==?'Male'].AgeGrp,?df[df.Sex?==?'Male'].percent,?label?=?'Male')
????ax2.barh(df[df.Sex?==?'Female'].AgeGrp,?df[df.Sex?==?'Female'].percent,?label?=?'Female',?color?=?'C1')
????
????country?=?df.Location.iloc[0]
????if?country?==?'United?States?of?America':?country?==?'US'
????????
????fig.suptitle(f'......')
????fig.supxlabel('......')
????fig.legend(bbox_to_anchor?=?(0.9,?0.88),?loc?=?'upper?right')
????ax1.set_ylabel('Age?Groups')
????
????return?fig
我們自定義了一個繪制圖表的函數(shù),其中的參數(shù)是年份,邏輯很簡單,我們是想根據(jù)年份來篩選出數(shù)據(jù),然后根據(jù)篩選出的數(shù)據(jù)來繪制圖表,每一年的圖表不盡相同
years?=?[i?for?i?in?set(data.Year)?if?i?years.sort()

for?year?in?years:
????fig?=?make_plot(year)
????fig.savefig(f'{year}.jpeg',bbox_inches?=?'tight')
output
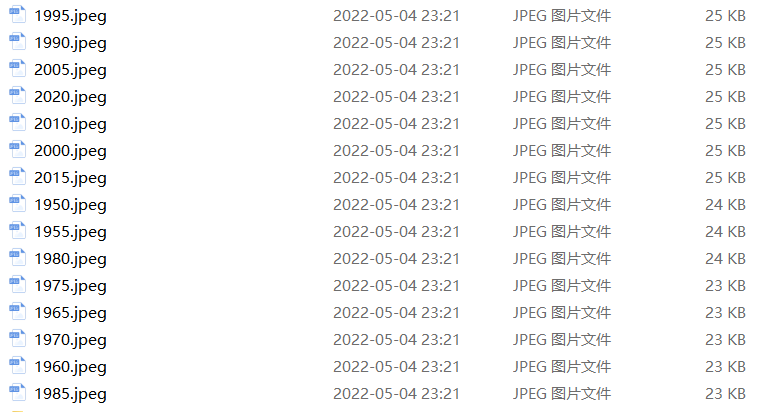
這樣我們就生成了若干張靜態(tài)的圖表,然后集合成gif格式的圖表幾個,代碼如下
import?matplotlib.animation?as?animation
fig,?ax?=?plt.subplots()
ims?=?[]

for?year?in?years:
????im?=?ax.imshow(plt.imread(f'{year}.jpeg'),?animated?=?True)
????ims.append([im])

ani?=?animation.ArtistAnimation(fig,?ims,?interval=600)
ani.save('us_population.gif')
output
還有另外一種思路
fig,?(ax1,?ax2)?=?plt.subplots(1,?2,?sharey?=?True)
???
df?=?data[data.Year?==?1955]

y_pos?=?[i?for?i?in?range(len(df[df.Sex?==?'Male']))]
male?=?ax1.barh(y_pos,?df[df.Sex?==?'Male'].percent,?label?=?'Male',
???????????????tick_label?=?df[df.Sex?==?'Male'].AgeGrp)
female?=?ax2.barh(y_pos,?df[df.Sex?==?'Female'].percent,?label?=?'Female',?
??????????????????color?=?'C1',?tick_label?=?df[df.Sex?==?'Male'].AgeGrp)

ax1.invert_xaxis()
fig.suptitle('.......')
fig.supxlabel('.......?(%)')
fig.legend(bbox_to_anchor?=?(0.9,?0.88),?loc?=?'upper?right')
ax1.set_ylabel('Age?Groups')
output
def?run(year):
????#?通過年份來篩選出數(shù)據(jù)
????df?=?data[data.Year?==?year]
????#?針對不同地性別來繪制
????total_pop?=?df.Value.sum()
????df['percent']?=?df.Value?/?total_pop?*?100
????male.remove()
????y_pos?=?[i?for?i?in?range(len(df[df.Sex?==?'Male']))]
????male.patches?=?ax1.barh(y_pos,?df[df.Sex?==?'Male'].percent,?label?=?'Male',?
?????????????????????color?=?'C0',?tick_label?=?df[df.Sex?==?'Male'].AgeGrp)
????female.remove()
????female.patches?=?ax2.barh(y_pos,?df[df.Sex?==?'Female'].percent,?label?=?'Female',
?????????????????
?????????????????color?=?'C1',?tick_label?=?df[df.Sex?==?'Female'].AgeGrp)

????text.set_text(year)
????return?male#,?female
然后我們調用animation.FuncAnimation()方法,
ani?=?animation.FuncAnimation(fig,?run,?years,?blit?=?True,?repeat?=?True,?
??????????????????????????????interval?=?600)
ani.save('文件名.gif')
output
這樣就可以一步到位生成gif格式的圖表,避免生成數(shù)十張繁多地靜態(tài)圖片了。
將若干張gif動圖放置在一張大圖當中
最后我們可以將若干張gif動圖放置在一張大的圖表當中,代碼如下
import?matplotlib.animation?as?animation

#?創(chuàng)建一個新的畫布
fig,?(ax,?ax2,?ax3)?=?plt.subplots(1,?3,?figsize?=?(10,?3))

ims?=?[]
for?year?in?years:
????im?=?ax.imshow(plt.imread(f'文件1{year}.jpeg'),?animated?=?True)
????im2?=?ax2.imshow(plt.imread(f'文件2{year}.jpeg'),?animated?=?True)
????im3?=?ax3.imshow(plt.imread(f'文件3{year}.jpeg'),?animated?=?True)
????ims.append([im,?im2,?im3])

ani?=?animation.ArtistAnimation(fig,?ims,?interval=600)
ani.save('comparison.gif')
output
推薦閱讀:
入門:?最全的零基礎學Python的問題? |?零基礎學了8個月的Python??|?實戰(zhàn)項目?|學Python就是這條捷徑
干貨:爬取豆瓣短評,電影《后來的我們》?|?38年NBA最佳球員分析?|? ?從萬眾期待到口碑撲街!唐探3令人失望? |?笑看新倚天屠龍記?|?燈謎答題王?|用Python做個海量小姐姐素描圖?|碟中諜這么火,我用機器學習做個迷你推薦系統(tǒng)電影
趣味:彈球游戲? |?九宮格? |?漂亮的花?|?兩百行Python《天天酷跑》游戲!
AI:?會做詩的機器人?|?給圖片上色?|?預測收入?|?碟中諜這么火,我用機器學習做個迷你推薦系統(tǒng)電影
小工具:?Pdf轉Word,輕松搞定表格和水印!?|?一鍵把html網頁保存為pdf!|??再見PDF提取收費!?|?用90行代碼打造最強PDF轉換器,word、PPT、excel、markdown、html一鍵轉換?|?制作一款釘釘?shù)蛢r機票提示器!?|60行代碼做了一個語音壁紙切換器天天看小姐姐!|
年度爆款文案
點閱讀原文,看B站我的視頻!
