
再見笨重的ELK,輕量化日志 Loki 牛逼,奉上全攻略教程!

大家好,我是寶哥!
1、前言
2、簡介
Loki 是 Grafana Labs 團隊最新的開源項目,是一個水平可擴展,高可用性,多租戶的日志聚合系統(tǒng)。它的設(shè)計非常經(jīng)濟高效且易于操作,因為它不會為日志內(nèi)容編制索引,而是為每個日志流編制一組標(biāo)簽,專門為 Prometheus 和 Kubernetes 用戶做了相關(guān)優(yōu)化。該項目受 Prometheus 啟發(fā),官方的介紹就是:Like Prometheus,But For Logs.,類似于 Prometheus 的日志系統(tǒng);
項目地址:https://github.com/grafana/loki/
不對日志進(jìn)行全文索引。通過存儲壓縮非結(jié)構(gòu)化日志和僅索引元數(shù)據(jù),Loki 操作起來會更簡單,更省成本。 通過使用與 Prometheus 相同的標(biāo)簽記錄流對日志進(jìn)行索引和分組,這使得日志的擴展和操作效率更高,能對接 alertmanager; 特別適合儲存 Kubernetes Pod 日志;諸如 Pod 標(biāo)簽之類的元數(shù)據(jù)會被自動刪除和編入索引; 受 Grafana 原生支持,避免kibana和grafana來回切換;
3、架構(gòu)說明
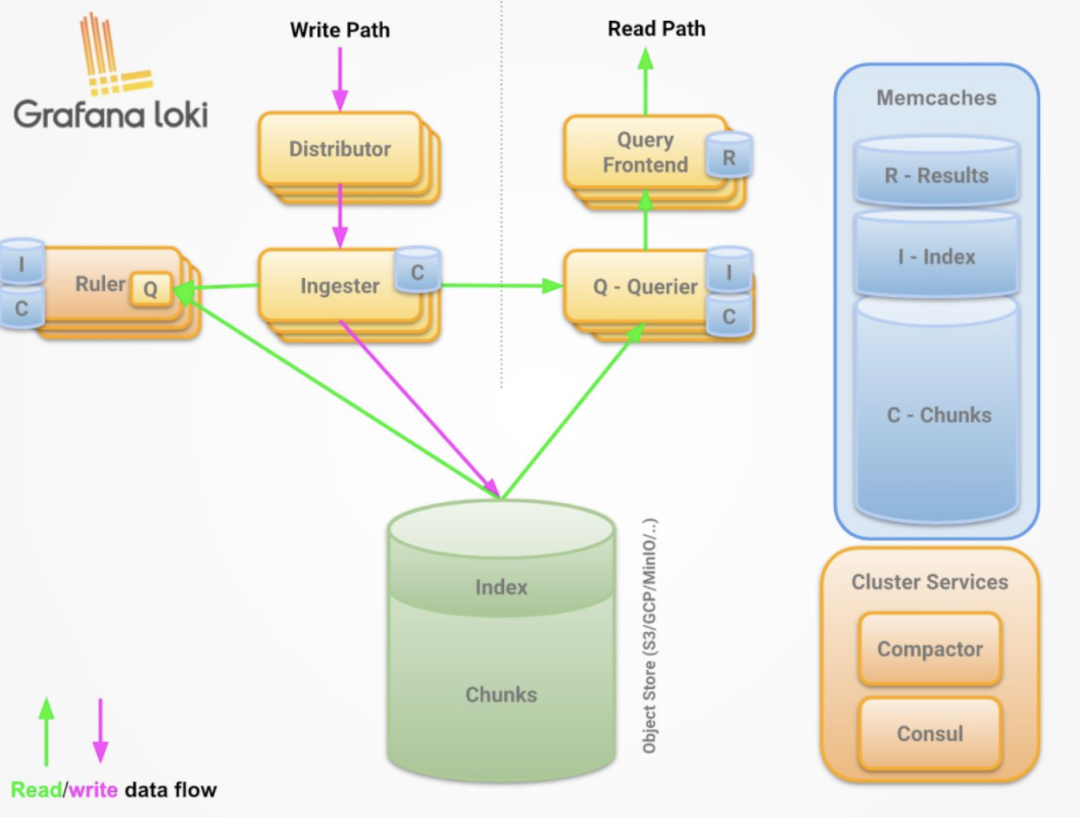
3.1 組件說明
Promtail 作為采集器,類比filebeat
loki 相當(dāng)于服務(wù)端,類比es
querier 查詢器
inester 日志存儲器
query-frontend 前置查詢器
distributor 寫入分發(fā)器
3.2 read path
查詢器將查詢傳遞給所有ingesters請求內(nèi)存中的數(shù)據(jù)
接收器接受讀取的請求,并返回與查詢匹配的數(shù)據(jù)(如果有)
如果沒有接受者返回數(shù)據(jù), 則查詢器會從后備存儲中延遲加載數(shù)據(jù)并對其執(zhí)行查詢;
查詢器將迭代所有接收到的數(shù)據(jù)并進(jìn)行重復(fù)數(shù)據(jù)刪除, 從而通過HTTP/1連接返回最終數(shù)據(jù)集;
3.3 write path
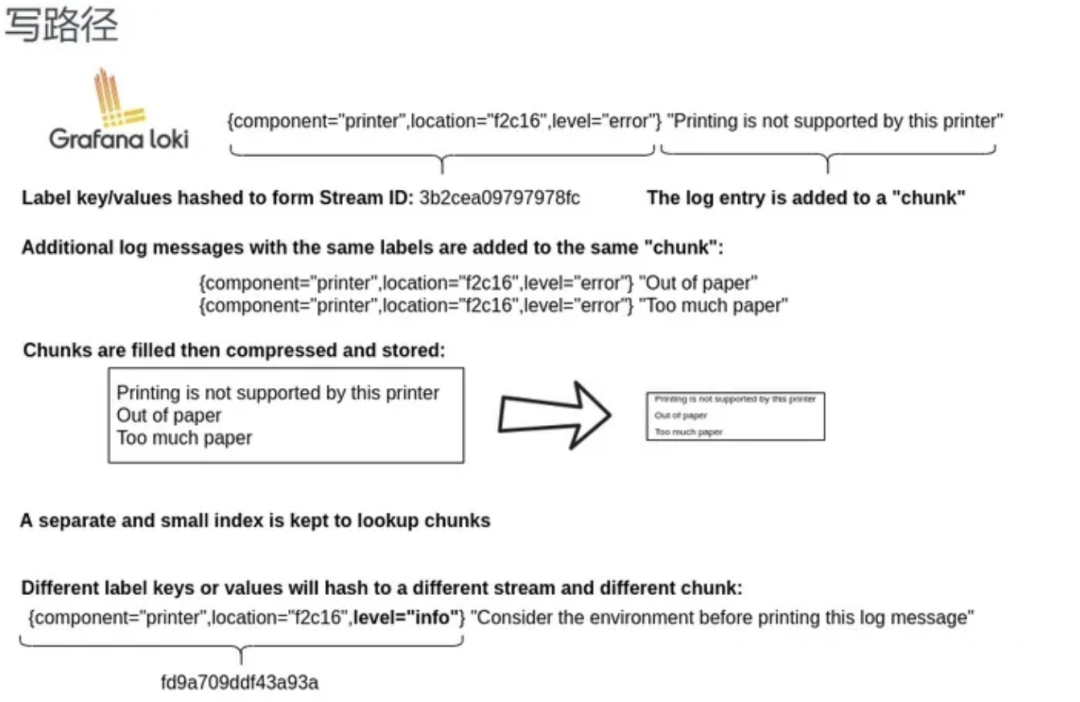
每個流都使用散列環(huán)散列;
分發(fā)程序?qū)⒚總€流發(fā)送到適當(dāng)?shù)膇nester和其副本(基于配置的復(fù)制因子);
每個實例將為流的數(shù)據(jù)創(chuàng)建一個塊或?qū)⑵渥芳拥浆F(xiàn)有塊中, 每個租戶和每個標(biāo)簽集的塊都是唯一的;
分發(fā)服務(wù)器通過HTTP/1鏈接以成功代碼作為響應(yīng);
4、部署
4.1 本地化模式安裝
下載 Promtail 和 Loki
wget https://github.com/grafana/loki/releases/download/v2.2.1/loki-linux-amd64.zipwget https://github.com/grafana/loki/releases/download/v2.2.1/promtail-linux-amd64.zip
安裝 Promtail
$ mkdir /opt/app/{promtail,loki} -pv# promtail配置文件$ cat </opt/app/promtail/promtail.yaml server:http_listen_port: 9080grpc_listen_port: 0positions:filename: /var/log/positions.yaml # This location needs to be writeable by promtail.client:url: http://localhost:3100/loki/api/v1/pushscrape_configs:- job_name: systempipeline_stages:static_configs:- targets:- localhostlabels:job: varlogshost: yourhost__path__: /var/log/*.logEOF# 解壓安裝包unzip promtail-linux-amd64.zipmv promtail-linux-amd64 /opt/app/promtail/promtail# service文件$ cat </etc/systemd/system/promtail.service [Unit]Description=promtail serverWants=network-online.targetAfter=network-online.target[Service]ExecStart=/opt/app/promtail/promtail -config.file=/opt/app/promtail/promtail.yamlStandardOutput=syslogStandardError=syslogSyslogIdentifier=promtail[Install]WantedBy=default.targetEOFsystemctl daemon-reloadsystemctl restart promtailsystemctl status promtail
安裝loki
$ mkdir /opt/app/{promtail,loki} -pv# promtail配置文件$ cat </opt/app/loki/loki.yaml auth_enabled: falseserver:http_listen_port: 3100grpc_listen_port: 9096ingester:wal:enabled: truedir: /opt/app/loki/wallifecycler:address: 127.0.0.1ring:kvstore:store: inmemoryreplication_factor: 1final_sleep: 0schunk_idle_period: 1h # Any chunk not receiving new logs in this time will be flushedmax_chunk_age: 1h # All chunks will be flushed when they hit this age, default is 1hchunk_target_size: 1048576 # Loki will attempt to build chunks up to 1.5MB, flushing first if chunk_idle_period or max_chunk_age is reached firstchunk_retain_period: 30s # Must be greater than index read cache TTL if using an index cache (Default index read cache TTL is 5m)max_transfer_retries: 0 # Chunk transfers disabledschema_config:configs:- from: 2020-10-24store: boltdb-shipperobject_store: filesystemschema: v11index:prefix: index_period: 24hstorage_config:boltdb_shipper:active_index_directory: /opt/app/loki/boltdb-shipper-activecache_location: /opt/app/loki/boltdb-shipper-cachecache_ttl: 24h # Can be increased for faster performance over longer query periods, uses more disk spaceshared_store: filesystemfilesystem:directory: /opt/app/loki/chunkscompactor:working_directory: /opt/app/loki/boltdb-shipper-compactorshared_store: filesystemlimits_config:reject_old_samples: truereject_old_samples_max_age: 168hchunk_store_config:max_look_back_period: 0stable_manager:retention_deletes_enabled: falseretention_period: 0sruler:storage:type: locallocal:directory: /opt/app/loki/rulesrule_path: /opt/app/loki/rules-tempalertmanager_url: http://localhost:9093ring:kvstore:store: inmemoryenable_api: trueEOF# 解壓包unzip loki-linux-amd64.zipmv loki-linux-amd64 /opt/app/loki/loki# service文件$ cat </etc/systemd/system/loki.service [Unit]Description=loki serverWants=network-online.targetAfter=network-online.target[Service]ExecStart=/opt/app/loki/loki -config.file=/opt/app/loki/loki.yamlStandardOutput=syslogStandardError=syslogSyslogIdentifier=loki[Install]WantedBy=default.targetEOFsystemctl daemon-reloadsystemctl restart lokisystemctl status loki
5、使用
5.1 grafana上配置loki數(shù)據(jù)源
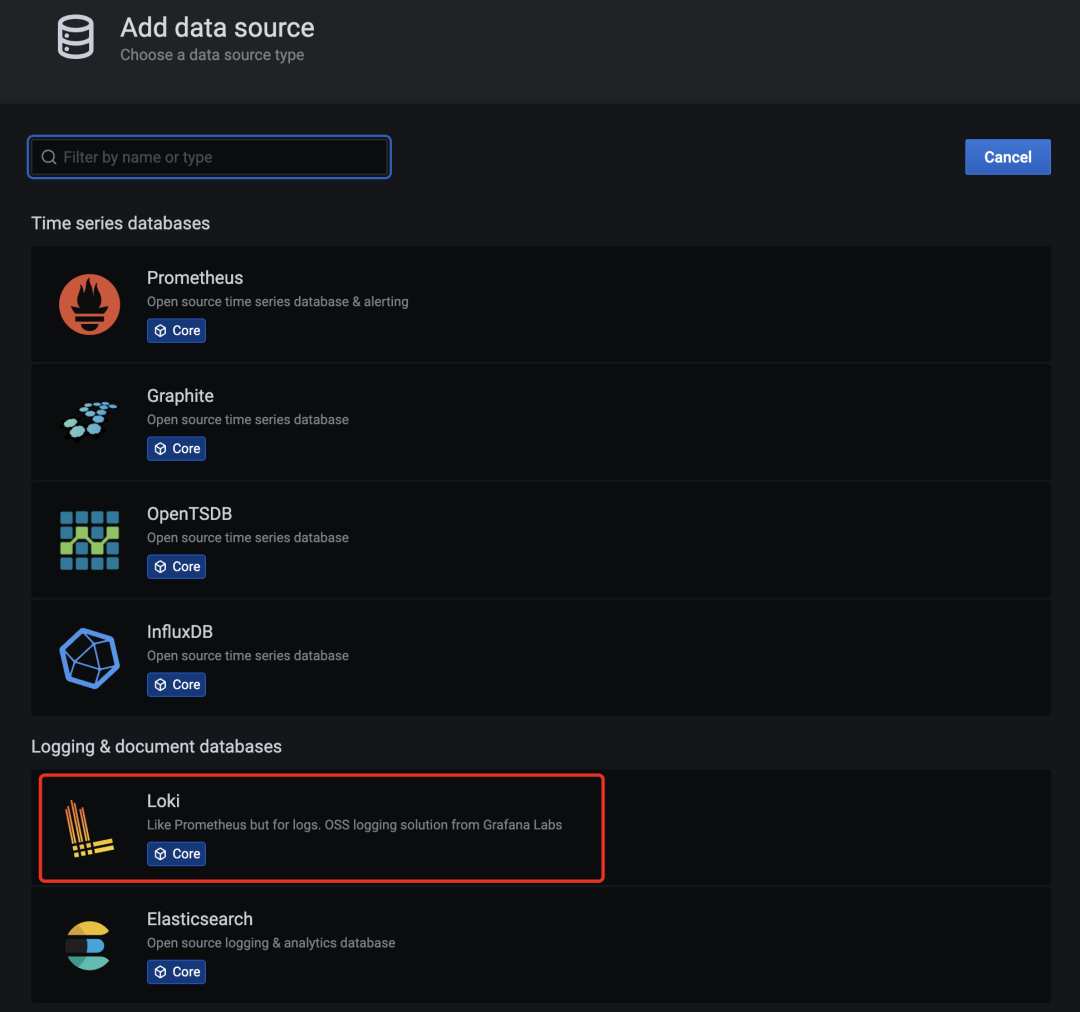
grafana-loki-dashsource
在數(shù)據(jù)源列表中選擇 Loki,配置 Loki 源地址:
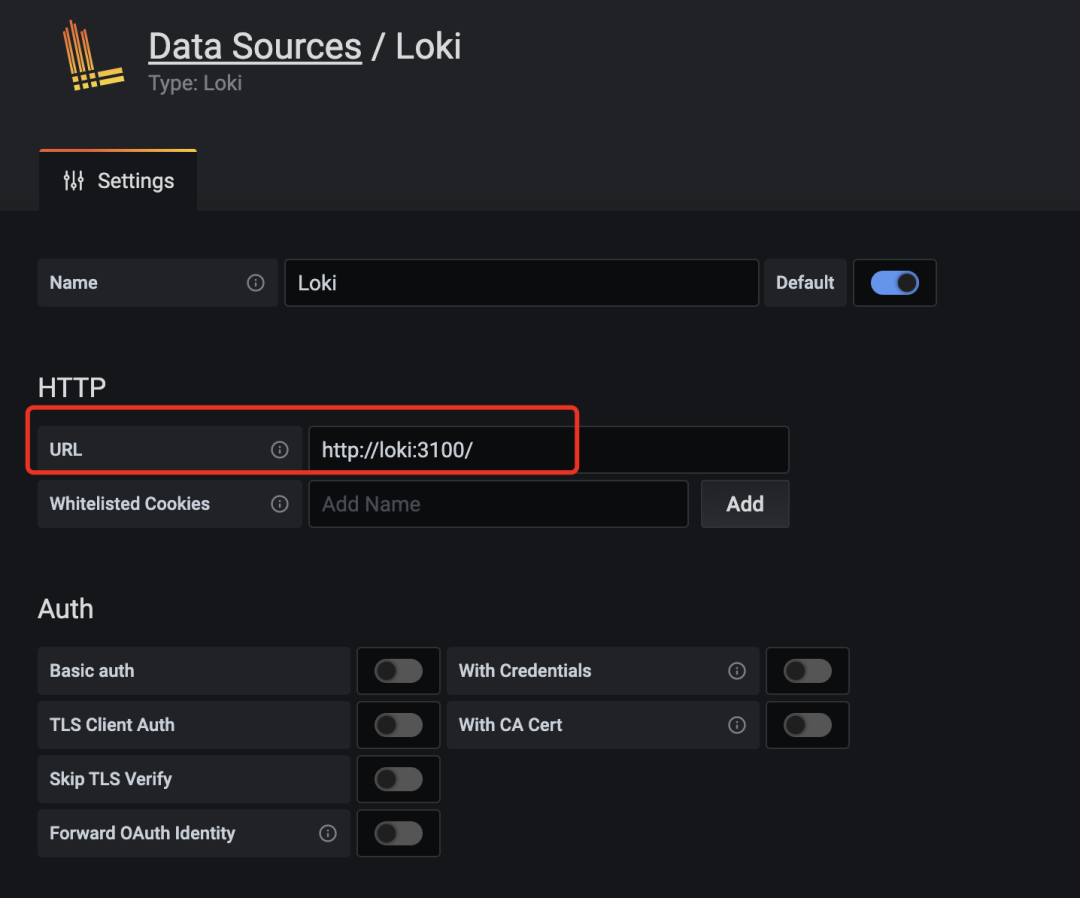
源地址配置 http://loki:3100 即可,保存。
保存完成后,切換到 grafana 左側(cè)區(qū)域的 Explore,即可進(jìn)入到 Loki 的頁面
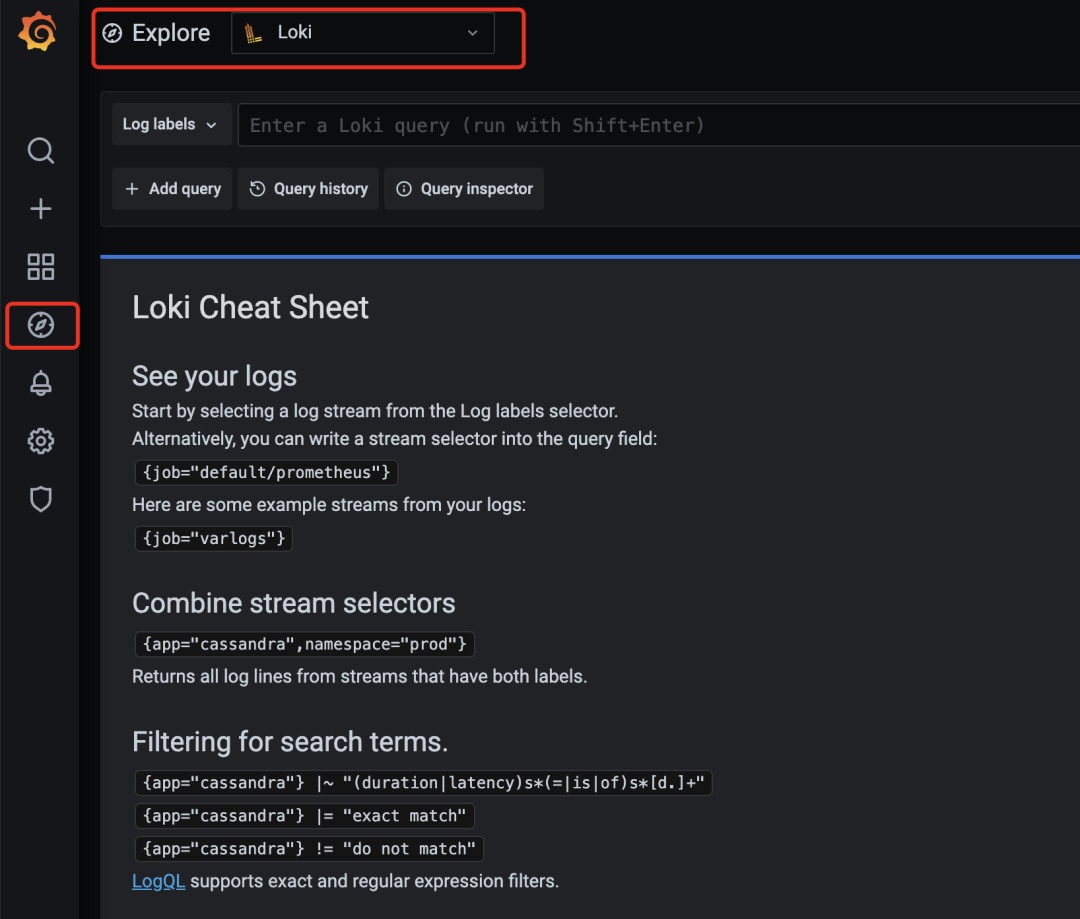
然后我們點擊 Log labels 就可以把當(dāng)前系統(tǒng)采集的日志標(biāo)簽給顯示出來,可以根據(jù)這些標(biāo)簽進(jìn)行日志的過濾查詢:
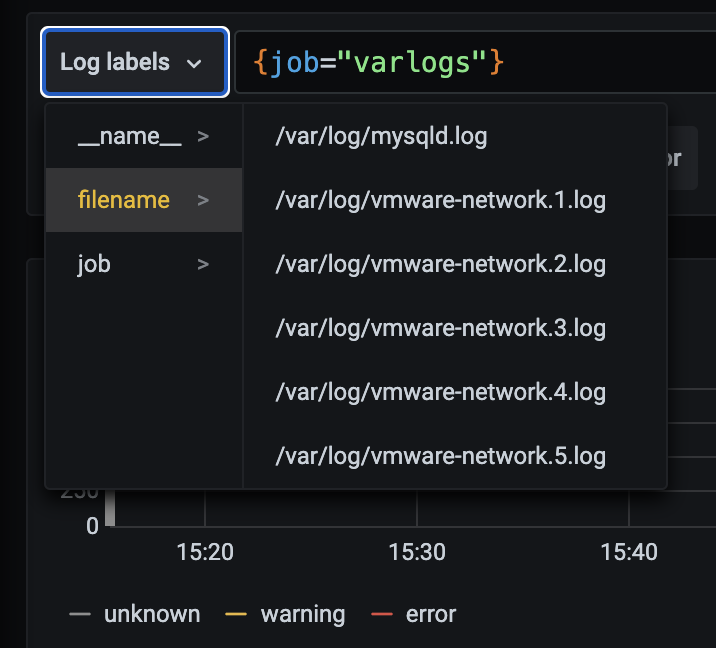
比如我們這里選擇 /var/log/messages,就會把該文件下面的日志過濾展示出來,不過由于時區(qū)的問題,可能還需要設(shè)置下時間才可以看到數(shù)據(jù):
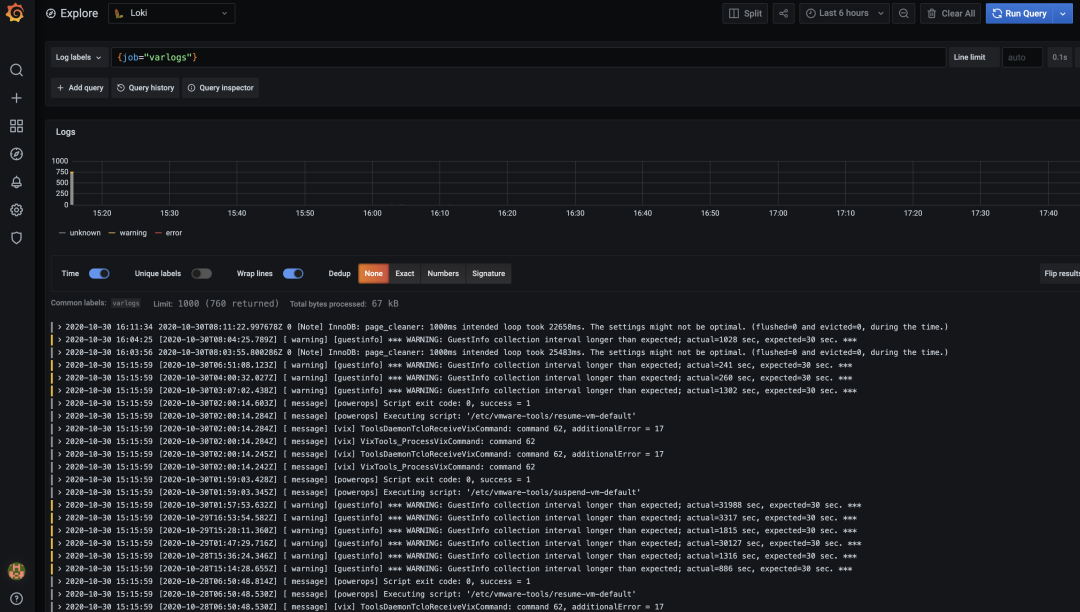
這里展示的是 promtail 容器里面 / var/log 目錄中的日志
promtail 容器 /etc/promtail/config.yml
server:http_listen_port: 9080grpc_listen_port: 0positions:filename: /tmp/positions.yamlclients:- url: http://loki:3100/loki/api/v1/pushscrape_configs:- job_name: systemstatic_configs:- targets:- localhostlabels:job: varlogs__path__: /var/log/*log
這里的 job 就是 varlog,文件路徑就是 /var/log/*log
5.2 在grafana explore上配置查看日志
查看日志 rate({job="message"} |="kubelet"
算 qps rate({job=”message”} |=”kubelet” [1m])
5.3 只索引標(biāo)簽
之前多次提到 loki 和 es 最大的不同是 loki 只對標(biāo)簽進(jìn)行索引而不對內(nèi)容索引 下面我們舉例來看下
以簡單的 promtail 配置舉例
配置解讀
scrape_configs:- job_name: systempipeline_stages:static_configs:- targets:- localhostlabels:job: message__path__: /var/log/messages
上面這段配置代表啟動一個日志采集任務(wù) 這個任務(wù)有 1 個固定標(biāo)簽job=”syslog” 采集日志路徑為 /var/log/messages,會以一個名為 filename 的固定標(biāo)簽 在 promtail 的 web 頁面上可以看到類似 prometheus 的 target 信息頁面
scrape_configs:- job_name: systempipeline_stages:static_configs:- targets:- localhostlabels:job: syslog__path__: /var/log/syslog- job_name: systempipeline_stages:static_configs:- targets:- localhostlabels:job: apache__path__: /var/log/apache.log
同時也支持正則和正則非匹配
5.3 標(biāo)簽匹配模式的特點
原理
prometheus 中標(biāo)簽一致對應(yīng)的同一個 hash 值和 refid(正整數(shù)遞增的 id),也就是同一個 series
時序數(shù)據(jù)不斷的 append 追加到這個 memseries 中
當(dāng)有任意標(biāo)簽發(fā)生變化時會產(chǎn)生新的 hash 值和 refid,對應(yīng)新的 series
loki 處理日志的模式 - 和 prometheus 一致,loki 一組標(biāo)簽值會生成一個 stream - 日志隨著時間的遞增會追加到這個 stream 中,最后壓縮為 chunk - 當(dāng)有任意標(biāo)簽發(fā)生變化時會產(chǎn)生新的 hash 值,對應(yīng)新的 stream
查詢過程
所以 loki 先根據(jù)標(biāo)簽算出 hash 值在倒排索引中找到對應(yīng)的 chunk? 然后再根據(jù)查詢語句中的關(guān)鍵詞等進(jìn)行過濾,這樣能大大的提速 因為這種根據(jù)標(biāo)簽算哈希在倒排中查找 id,對應(yīng)找到存儲的塊在 prometheus 中已經(jīng)被驗證過了 屬于開銷低 速度快
5.5 動態(tài)標(biāo)簽和高基數(shù)
何為動態(tài)標(biāo)簽:說白了就是標(biāo)簽的 value 不固定
何為高基數(shù)標(biāo)簽:說白了就是標(biāo)簽的 value 可能性太多了,達(dá)到 10 萬,100 萬甚至更多
11.11.11.11 - frank [25/Jan/2000:14:00:01 -0500] "GET /1986.js HTTP/1.1" 200 932 "-" "Mozilla/5.0 (Windows; U; Windows NT 5.1; de; rv:1.9.1.7) Gecko/20091221 Firefox/3.5.7 GTB6"
在 Promtail 中使用 regex 想要匹配 action 和 status_code 兩個標(biāo)簽
scrape_configs:- job_name: systempipeline_stages:static_configs:- targets:- localhostlabels:job: syslog__path__: /var/log/syslog- job_name: systempipeline_stages:static_configs:- targets:- localhostlabels:job: apache__path__: /var/log/apache.log- job_name: systempipeline_stages:- regex:expression: "^(?P\\S+) (?P \\S+) (?P \\S+) \\[(?P [\\w:/]+\\s[+\\-]\\d{4})\\] \"(?P \\S+)\\s?(?P \\S+)?\\s?(?P \\S+)?\" (?P \\d{3}|-) (?P \\d+|-)\\s?\"?(?P [^\"]*)\"?\\s?\"?(?P [^\"]*)?\"?$" - labels:action:status_code:static_configs:- targets:- localhostlabels:job: apacheenv: dev__path__: /var/log/apache.log
11.11.11.11 - frank [25/Jan/2000:14:00:01 -0500] "GET /1986.js HTTP/1.1" 200 932 "-" "Mozilla/5.0 (Windows; U; Windows NT 5.1; de; rv:1.9.1.7) Gecko/20091221 Firefox/3.5.7 GTB6"11.11.11.12 - frank [25/Jan/2000:14:00:02 -0500] "POST /1986.js HTTP/1.1" 200 932 "-" "Mozilla/5.0 (Windows; U; Windows NT 5.1; de; rv:1.9.1.7) Gecko/20091221 Firefox/3.5.7 GTB6"11.11.11.13 - frank [25/Jan/2000:14:00:03 -0500] "GET /1986.js HTTP/1.1" 400 932 "-" "Mozilla/5.0 (Windows; U; Windows NT 5.1; de; rv:1.9.1.7) Gecko/20091221 Firefox/3.5.7 GTB6"11.11.11.14 - frank [25/Jan/2000:14:00:04 -0500] "POST /1986.js HTTP/1.1" 400 932 "-" "Mozilla/5.0 (Windows; U; Windows NT 5.1; de; rv:1.9.1.7) Gecko/20091221 Firefox/3.5.7 GTB6"
如果出現(xiàn)另一個獨特的標(biāo)簽組合(例如 status_code =“500”),則會創(chuàng)建另一個新流
高基數(shù)問題
可以快速生成成千上萬的流,這是高基數(shù),這可以殺死 Loki
Loki 的超級能力是將查詢分解為小塊并并行分發(fā),以便您可以在短時間內(nèi)查詢大量日志數(shù)據(jù)
5.6 全文索引問題
要查詢?nèi)罩緮?shù)據(jù),需要加載此索引,并且為了提高性能,它可能應(yīng)該在內(nèi)存中。這很難擴展,并且隨著您攝入更多日志,索引會迅速變大。
Loki 的索引通常比攝取的日志量小一個數(shù)量級,索引的增長非常緩慢
加速查詢沒標(biāo)簽字段
以上邊提到的 ip 字段為例 - 使用過濾器表達(dá)式查詢
{job="apache"} |= "11.11.11.11"
loki查詢時的分片(按時間范圍分段grep)
這些分片的大小和并行化的數(shù)量是可配置的,并取決于您提供的資源
如果需要,您可以將分片間隔配置為 5m,部署 20 個查詢器,并在幾秒鐘內(nèi)處理千兆字節(jié)的日志
或者,您可以發(fā)瘋并設(shè)置 200 個查詢器并處理 TB 的日志!
兩種索引模式對比
loki 的邏輯是查詢時再啟動多個分段并行查詢
日志量少時少加標(biāo)簽
舉例,如果該查詢是 {app=”loki”,level!=”debug”}
在沒加 level 標(biāo)簽的情況下只需加載一個 chunk 即 app=“l(fā)oki” 的標(biāo)簽
如果加了 level 的情況,則需要把 level=info,warn,error,critical 5 個 chunk 都加載再查詢
需要標(biāo)簽時再去添加
對應(yīng)的原始日志大小在 5MB-10MB,如果日志在 max_chunk_age 時間內(nèi)能達(dá)到 10MB,考慮添加標(biāo)簽
日志應(yīng)當(dāng)按時間遞增
目前 loki 為了性能考慮直接拒絕掉舊數(shù)據(jù)
來源:https://www.cnblogs.com/you-men/p/14900249.html
精彩推薦:
現(xiàn)在大火的低代碼是怎么回事?從實現(xiàn)原理談?wù)劦痛a
XXL-JOB分布式任務(wù)調(diào)度平臺(真·保姆級教程)