
Pandas 表格樣式設(shè)置指南,看這一篇就夠了!
Pandas 表格樣式設(shè)置指南
最近這些年,Python在數(shù)據(jù)分析以及人工智能領(lǐng)域是越來越火。
這離不開pandas、numpy、sklearn、TensorFlow、PyTorch等數(shù)據(jù)科學(xué)包,尤其是 Pandas,幾乎是每一個從事Python數(shù)據(jù)科學(xué)相關(guān)的同學(xué)都繞不過去的。
Pandas是一種高效的數(shù)據(jù)處理庫,它以 dataframe 和 series 為基本數(shù)據(jù)類型,呈現(xiàn)出類似excel的二維數(shù)據(jù)。
在 Jupyter 中(jupyter notebook 或者 jupyter lab),可以對數(shù)據(jù)表格按照條件進(jìn)行個性化的設(shè)置,方便形象的查看和使用數(shù)據(jù)。
Pandas提供了 DataFrame.style 屬性,它會返回 Styler對象,用于數(shù)據(jù)樣式的設(shè)置。
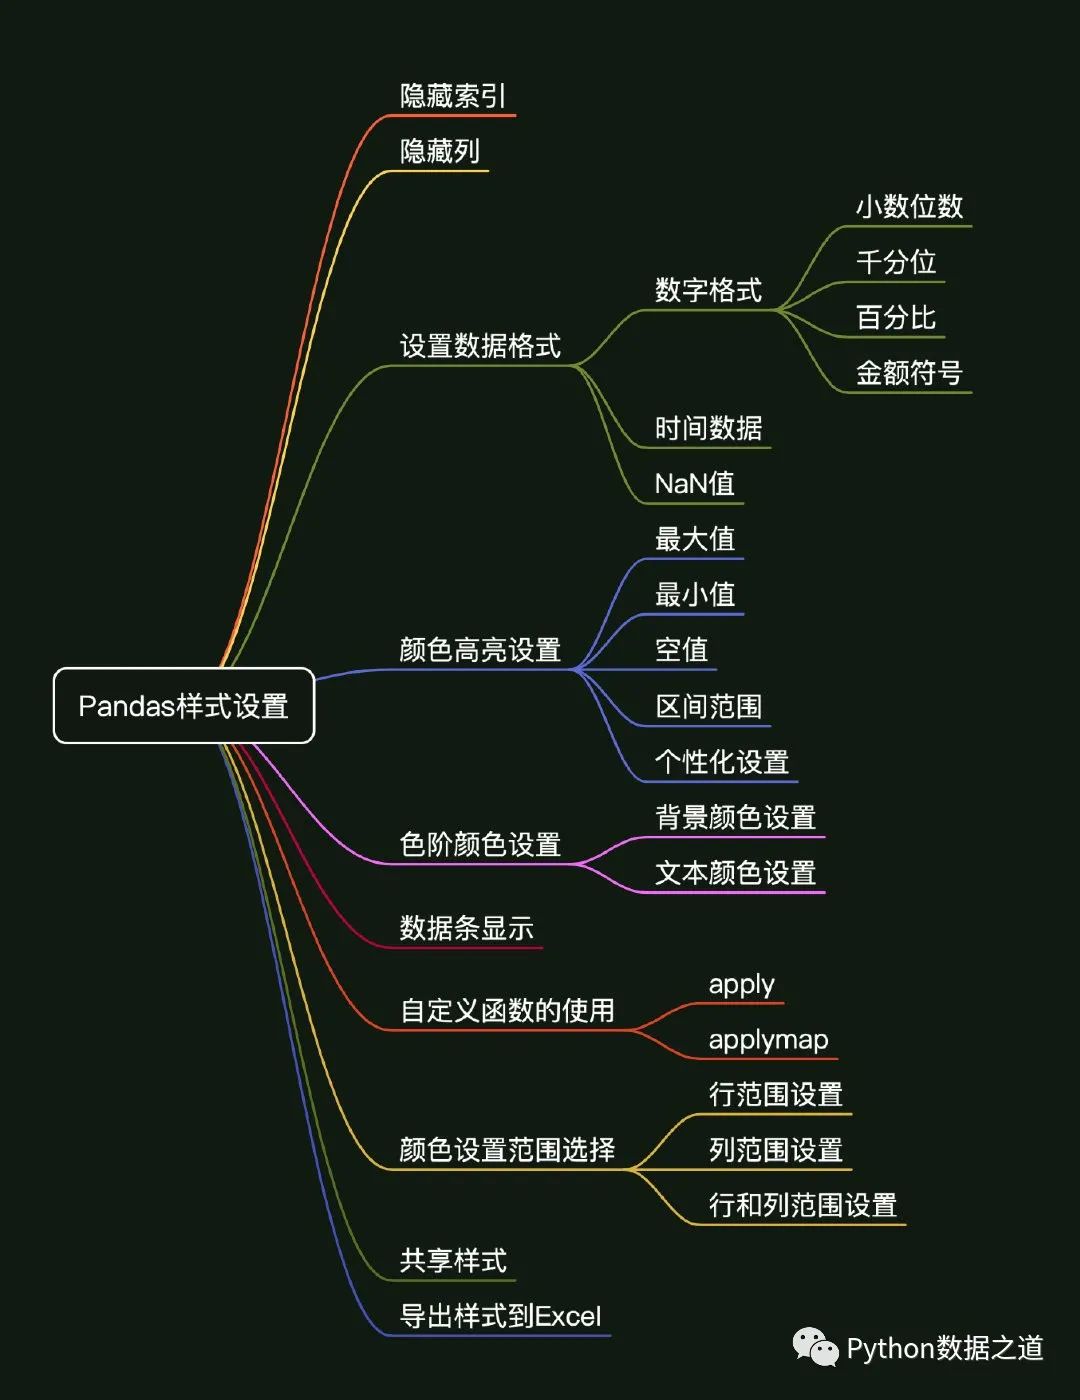
基于 Pandas提供的方法,本文主要內(nèi)容概括如下:
01 環(huán)境準(zhǔn)備
使用環(huán)境
本次使用的環(huán)境如下:
MacOS系統(tǒng) Python 3.8 Jupyter Notebook
Pandas 和 Numpy 的版本為:
pandas version:1.3.0rc1
numpy version:1.19.2
首先導(dǎo)入 pandas 和 numpy 庫,這次咱們本次需要用到的兩個 Python 庫,如下:
import pandas as pd
import numpy as np

print(f'pandas version:{pd.__version__}')
print(f'numpy version:{np.__version__}')
數(shù)據(jù)準(zhǔn)備
本次咱們使用的兩份數(shù)據(jù)是關(guān)于主動基金以及消費行業(yè)指數(shù)基金的數(shù)據(jù),本次演示用的數(shù)據(jù)僅為展示Pandas圖表美化功能,對投資沒有參考建議哈。
數(shù)據(jù)文件在文末有獲取方式。
數(shù)據(jù)1
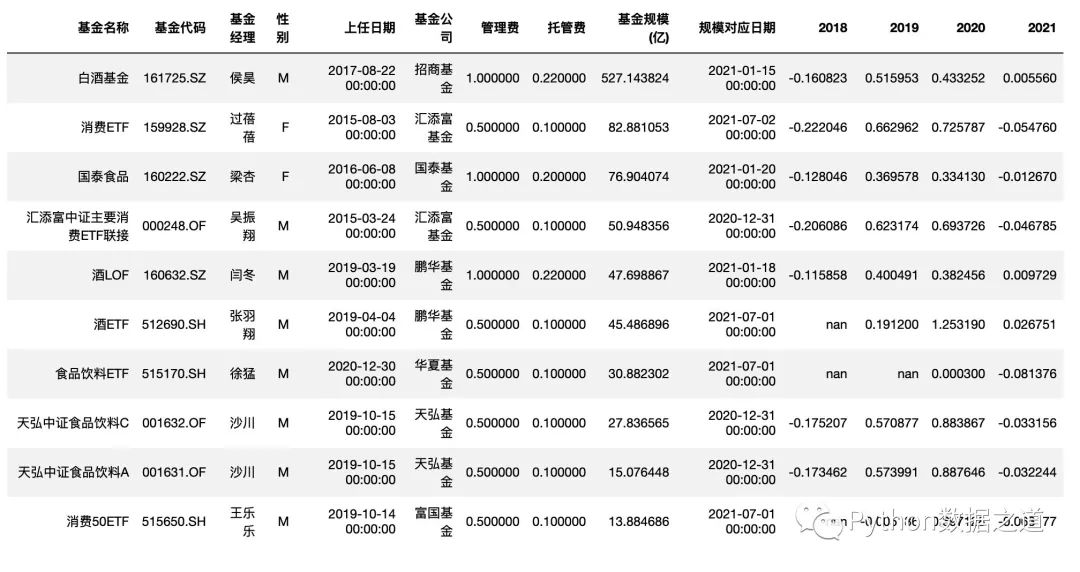
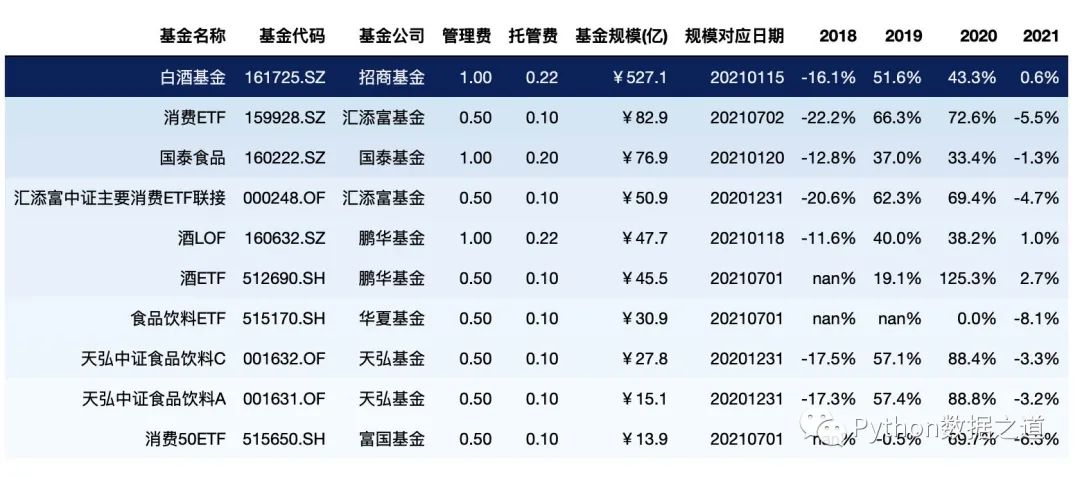
消費行業(yè)指數(shù)基金相關(guān)的數(shù)據(jù),導(dǎo)入如下:
df_consume = pd.read_csv('./data/fund_consume.csv',index_col=0,parse_dates=['上任日期','規(guī)模對應(yīng)日期'])
df_consume = df_consume.sort_values('基金規(guī)模(億)',ascending=False).head(10)
df_consume = df_consume.reset_index(drop=True)
df_consume
數(shù)據(jù)2
主動基金數(shù)據(jù),導(dǎo)入如下:
df_fund = pd.read_csv('./data/fund-analysis.csv',index_col=0,parse_dates=['上任日期','規(guī)模對應(yīng)日期'])
df_fund = df_fund.sort_values('基金規(guī)模(億)',ascending=False).head(10)
df_fund = df_fund.reset_index(drop=True)
df_fund.head(2)
文章中主要使用第一份數(shù)據(jù)。
02 隱藏索引
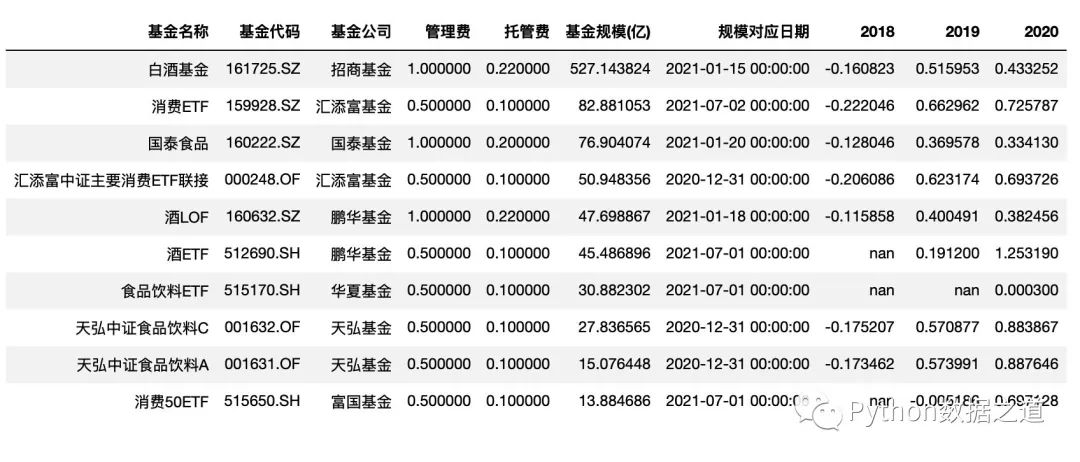
用 hide_index() 方法可以選擇隱藏索引,代碼如下:
df_consume.style.hide_index()
效果如下:
03 隱藏列
用 hide_columns() 方法可以選擇隱藏一列或者多列,代碼如下:
df_consume.style.hide_index().hide_columns(['性別','基金經(jīng)理','上任日期','2021'])
效果如下:
04 設(shè)置數(shù)據(jù)格式
在設(shè)置數(shù)據(jù)格式之前,需要注意下,所在列的數(shù)值的數(shù)據(jù)類型應(yīng)該為數(shù)字格式,如果包含字符串、時間或者其他非數(shù)字格式,則會報錯。
可以用 DataFrame.dtypes 屬性來查看數(shù)據(jù)格式。
df_consume.dtypes
格式如下:
基金名稱               object
基金代碼               object
基金經(jīng)理               object
性別                 object
上任日期       datetime64[ns]
基金公司               object
管理費               float64
托管費               float64
基金規(guī)模(億)           float64
規(guī)模對應(yīng)日期     datetime64[ns]
2018              float64
2019              float64
2020              float64
2021              float64
dtype: object
從上面來看,數(shù)據(jù)格式主要包括字符串、數(shù)字和時間這三種常見的類型,此外,空值(NaN,NaT等)也是我們需要處理的數(shù)據(jù)類型之一。
對于字符串類型,一般不要進(jìn)行格式設(shè)置;
對于數(shù)字類型,是格式設(shè)置用的最多的,包括設(shè)置小數(shù)的位數(shù)、千分位、百分?jǐn)?shù)形式、金額類型等;
對于時間類型,經(jīng)常會需要轉(zhuǎn)換為字符串類型進(jìn)行顯示;
對于空值,可以通過
na_rep參數(shù)來設(shè)置顯示內(nèi)容;
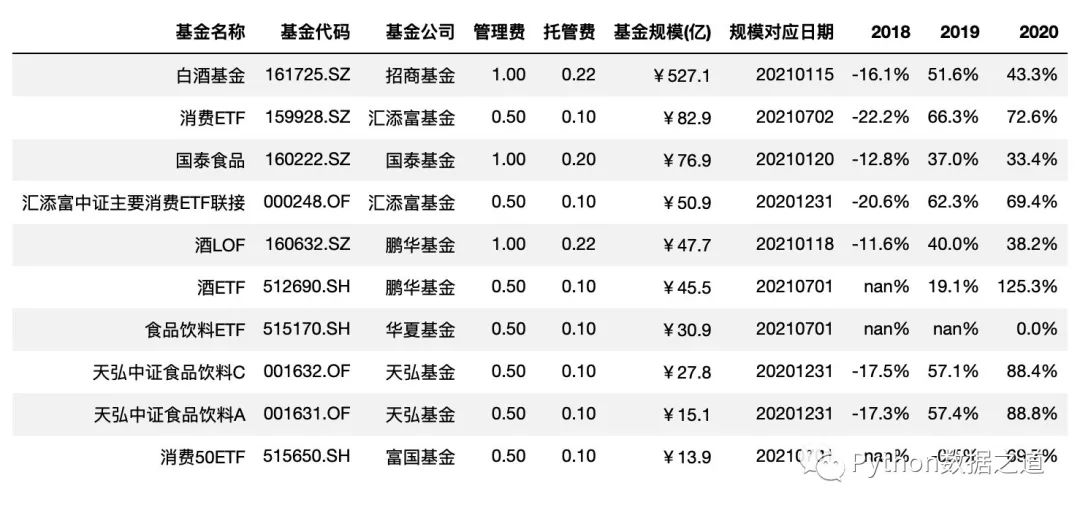
Pandas 中可以通過 style.format() 函數(shù)來對數(shù)據(jù)格式進(jìn)行設(shè)置。
format_dict = {'基金規(guī)模(億)': '¥{0:.1f}',
               '管理費': '{0:.2f}',
               '托管費': '{0:.2f}',
               '規(guī)模對應(yīng)日期':lambda x: "{}".format(x.strftime('%Y%m%d')),
               '2018': '{0:.1%}',
               '2019': '{0:.1%}',
               '2020': '{0:.1%}',
               '2021': '{0:.1%}'
                }

df_consume.style.hide_index()\
                .hide_columns(['性別','基金經(jīng)理','上任日期','2021'])\
                .format(format_dict)
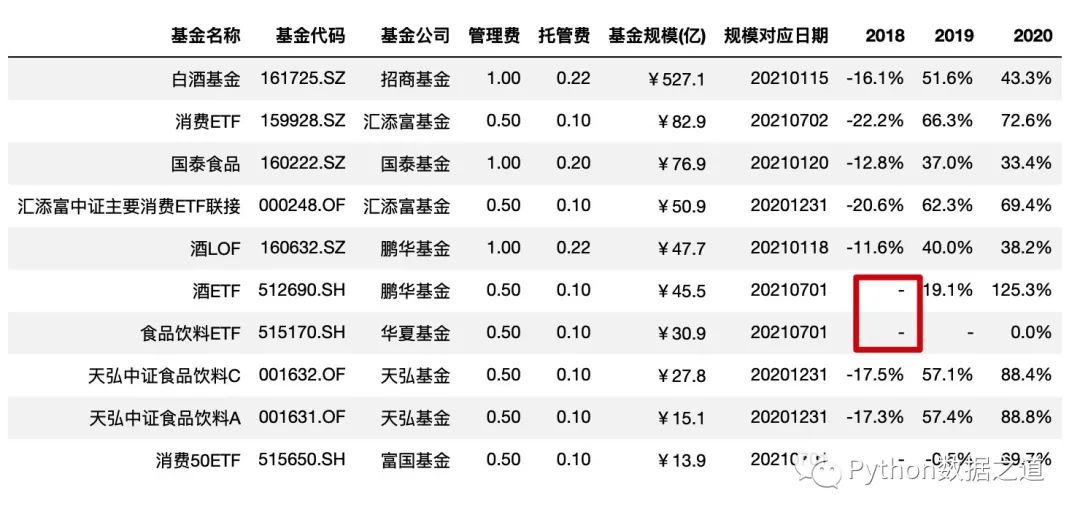
空值設(shè)置
使用 na_rep 設(shè)置空值的顯示,一般可以用 -、/、MISSING 等來表示:
df_consume.style.hide_index()\
                .hide_columns(['性別','基金經(jīng)理','上任日期','2021'])\
                .format(format_dict,na_rep='-')
05 顏色高亮設(shè)置
對于最大值、最小值、NaN等各類值的顏色高亮設(shè)置,pandas 已經(jīng)有專門的函數(shù)來處理,配合 axis 參數(shù)可以對行或者列進(jìn)行應(yīng)用:
highlight_max() highlight_min() highlight_null() highlight_between()
highlight_max
通過 highlight_max()來高亮最大值,其中 axis=0 是按列進(jìn)行統(tǒng)計:
df_consume.style.hide_index()\
                .hide_columns(['性別','基金經(jīng)理','上任日期',])\
                .format(format_dict)\
                .highlight_max(axis=0,subset=['2018','2019','2020'])
highlight_min
通過 highlight_min()來高亮最小值,其中 axis=1 是按行進(jìn)行統(tǒng)計:
df_consume.style.hide_index()\
                .hide_columns(['性別','基金經(jīng)理','上任日期',])\
                .format(format_dict)\
                .highlight_min(axis=1,subset=['2018','2019','2020'])
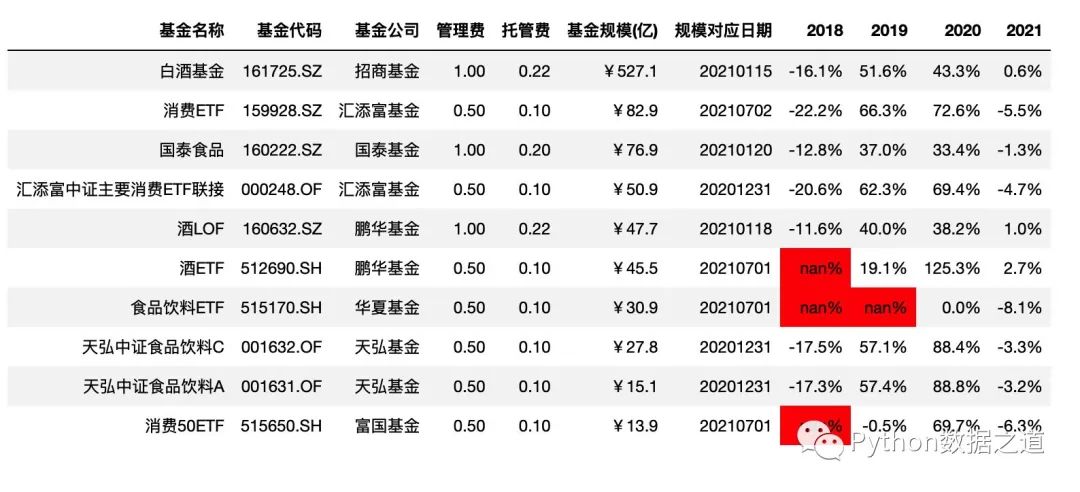
highlight_null
通過 highlight_null()來高亮空值(NaN值)
df_consume.style.hide_index()\
                .hide_columns(['性別','基金經(jīng)理','上任日期',])\
                .format(format_dict)\
                .highlight_null()
效果如下:
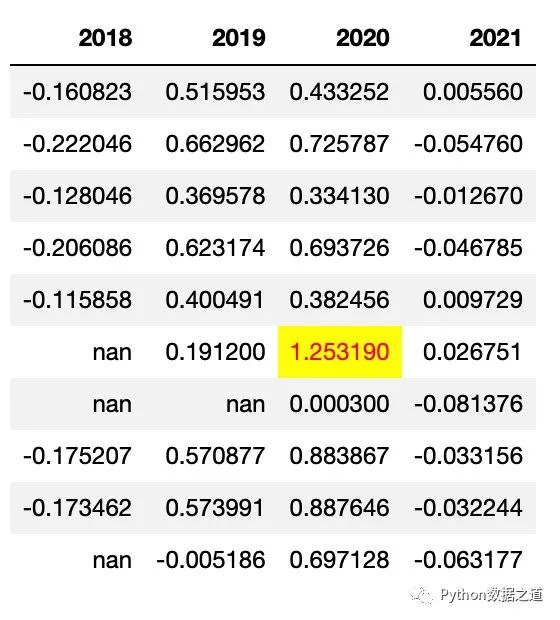
highlight_between
highlight_between() 函數(shù),對處于范圍內(nèi)的數(shù)據(jù)進(jìn)行高亮顯示。
highlight_between() 函數(shù)的使用參數(shù)如下:
Styler.highlight_between(subset=None, color='yellow', axis=0, left=None, right=None, inclusive='both', props=None)
highlight_between() 函數(shù),對處于范圍內(nèi)的數(shù)據(jù)進(jìn)行高亮顯示,通過 left 和 right 參數(shù)來設(shè)置兩邊的范圍。
需要注意下,highlight_between() 函數(shù)從 pandas 1.3.0版本開始才有,舊的版本可能不能使用哦。
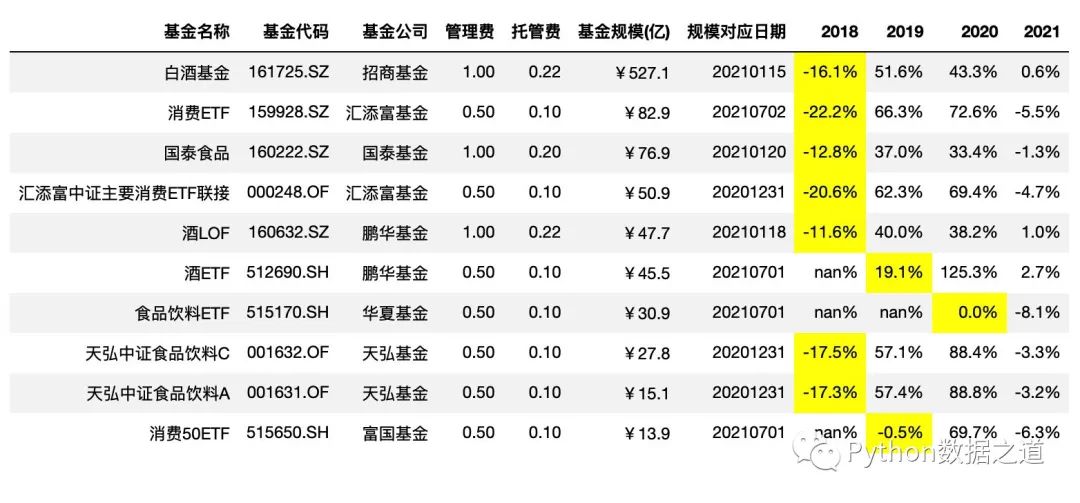
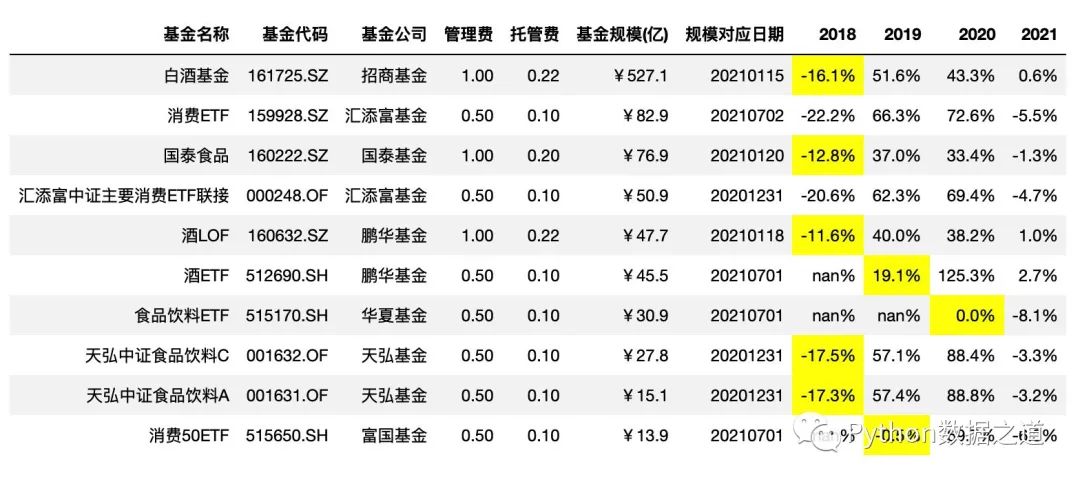
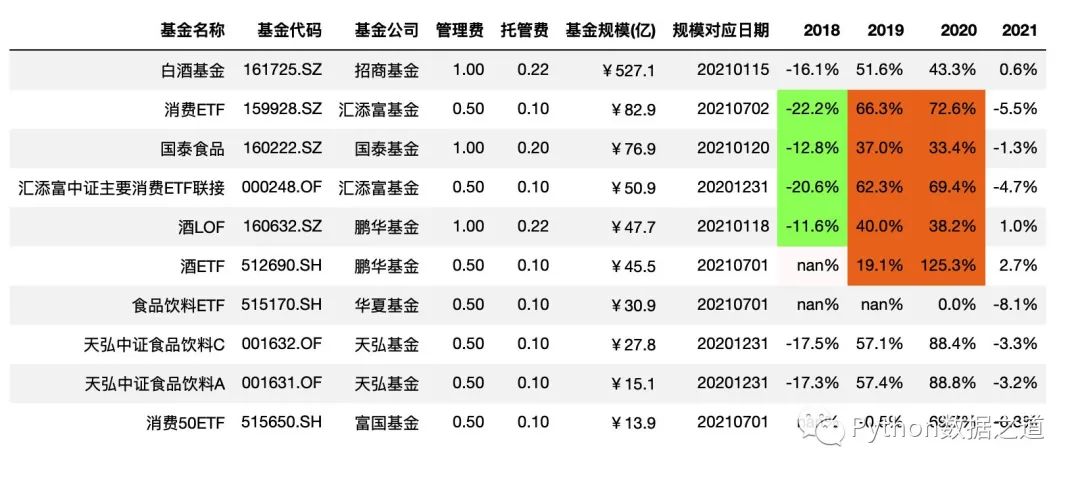
下面示例中 對2018年至2020年的年度漲跌幅度 -20%~+20% 范圍內(nèi)的數(shù)據(jù)進(jìn)行高亮標(biāo)注.
df_consume.style.hide_index()\
                .hide_columns(['性別','基金經(jīng)理','上任日期',])\
                .format(format_dict)\
                .highlight_between(left=-0.2,right=0.2,subset=['2018','2019','2020'])
效果如下:
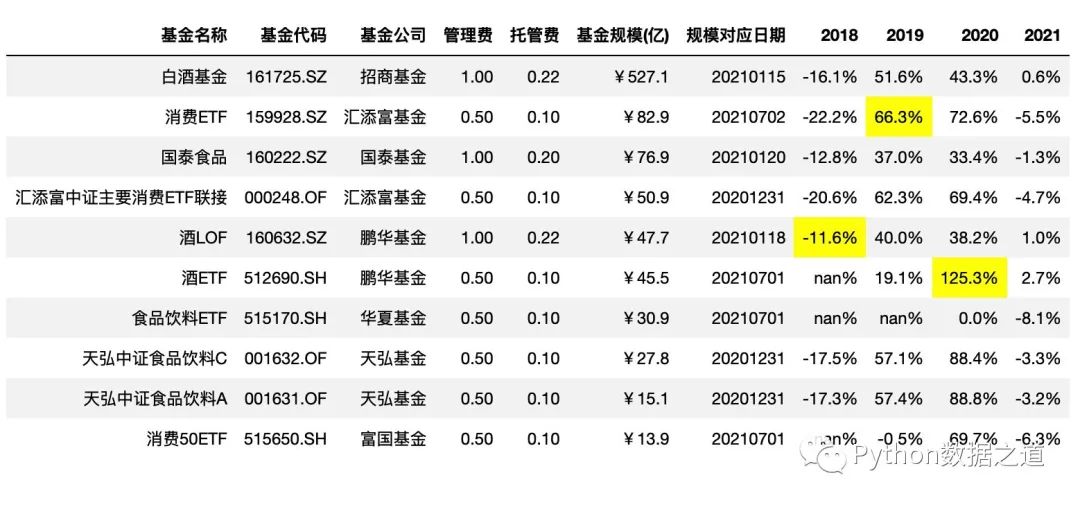
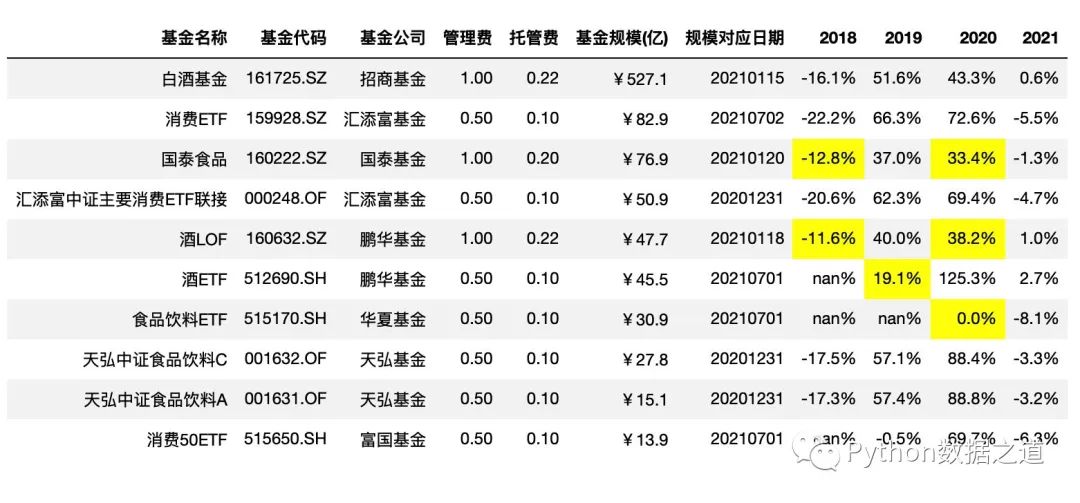
也可以分別對不同年度的不同漲跌范圍進(jìn)行設(shè)置,比如下面示例中:
2018年的年度漲跌幅度 -15%~+0%范圍;2019年的年度漲跌幅度 0%~20%%范圍;2020年的年度漲跌幅度 0%~40%范圍。
df_consume.style.hide_index()\
                .hide_columns(['性別','基金經(jīng)理','上任日期',])\
                .format(format_dict)\
                .highlight_between(left=[-0.15,0,0],right=[0,0.2,0.4],subset=['2018','2019','2020'],axis=1)
效果如下:
個性化設(shè)置
highlight_max()、highlight_min()、highlight_null() 等函數(shù)的默認(rèn)顏色設(shè)置,我們不一定滿意,可以通過 props 參數(shù)來進(jìn)行修改。
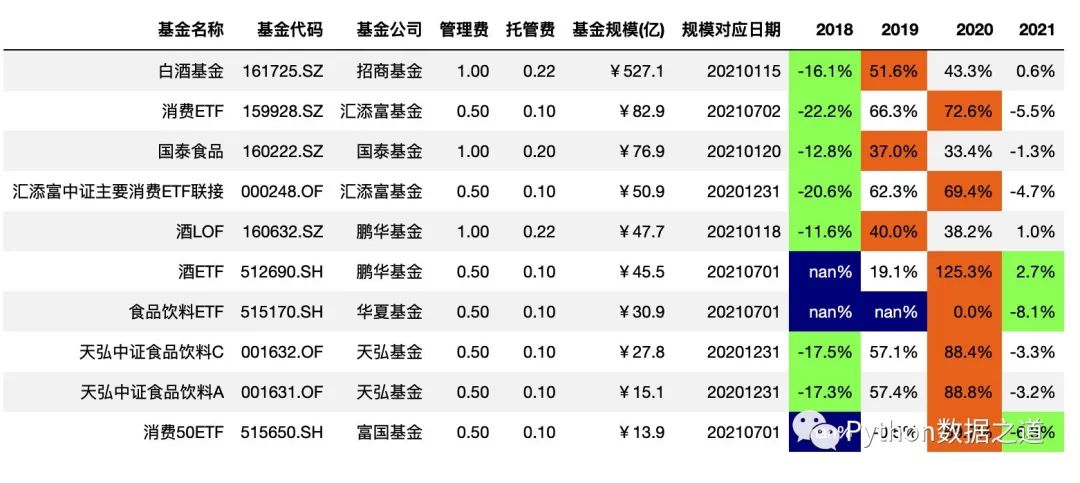
字體顏色和背景顏色設(shè)置
df_consume.style.hide_index()\
.hide_columns(['性別','基金經(jīng)理','上任日期',])\
.format(format_dict)\
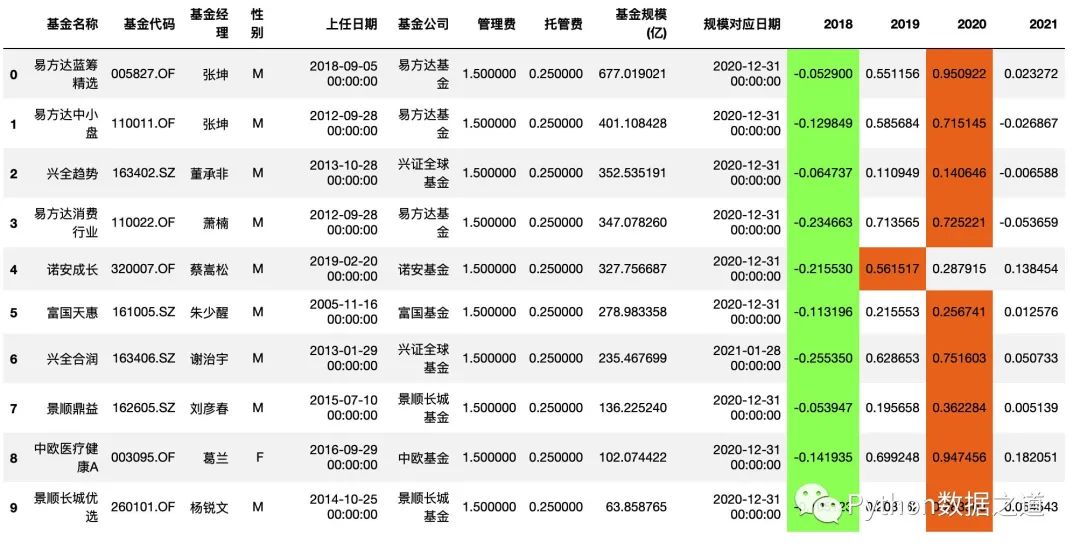
.highlight_min(axis=1,subset=['2018','2019','2020','2021'],props='color:black;background-color:#99ff66')\
.highlight_max(axis=1,subset=['2018','2019','2020','2021'],props='color:black;background-color:#ee7621')\
.highlight_null(props='color:white;background-color:darkblue')
效果如下:
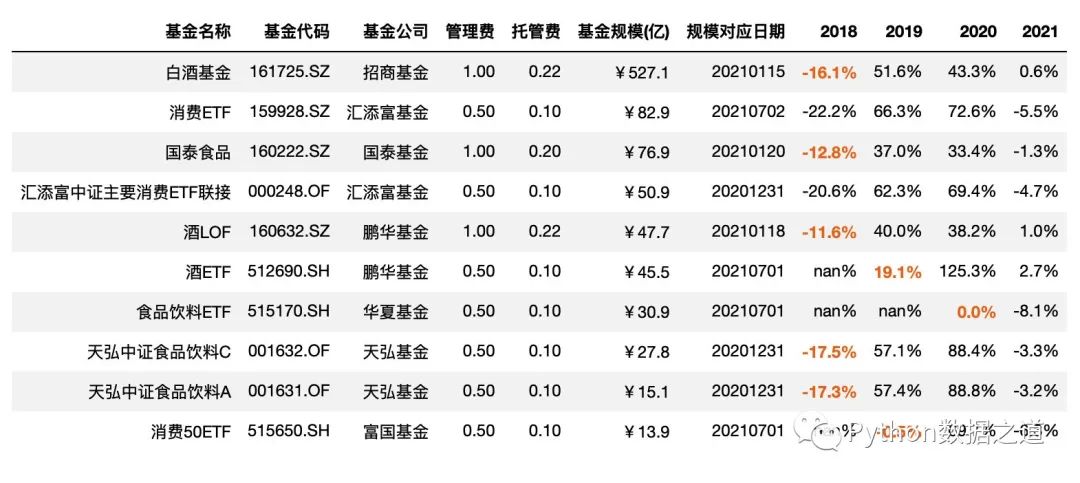
字體加粗以及字體顏色設(shè)置
df_consume.style.hide_index()\
                .hide_columns(['性別','基金經(jīng)理','上任日期',])\
                .format(format_dict)\
                .highlight_between(left=-0.2,right=0.2,subset=['2018','2019','2020'],props='font-weight:bold;color:#ee7621')
效果如下:
類似的個性化設(shè)置,在本文后續(xù)內(nèi)容中也是適用的。
06 色階顏色設(shè)置
背景色階顏色設(shè)置
使用 background_gradient() 函數(shù)可以對背景顏色進(jìn)行設(shè)置。
該函數(shù)的參數(shù)如下:
Styler.background_gradient(cmap='PuBu', low=0, high=0, axis=0, subset=None, text_color_threshold=0.408, vmin=None, vmax=None, gmap=None)
使用如下:
df_consume.style.hide_index()\
.hide_columns(['性別','基金經(jīng)理','上任日期'])\
.format(format_dict)\
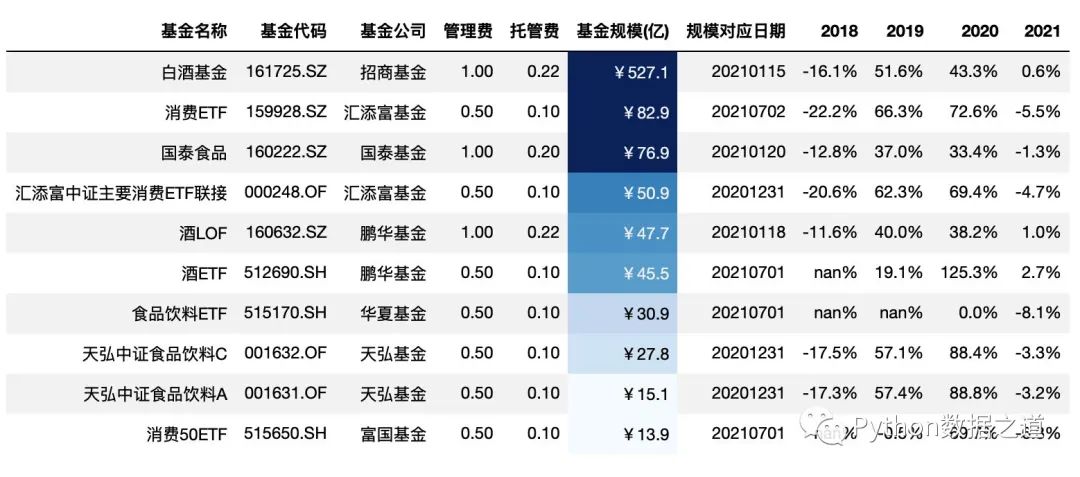
.background_gradient(cmap='Blues')
效果如下:
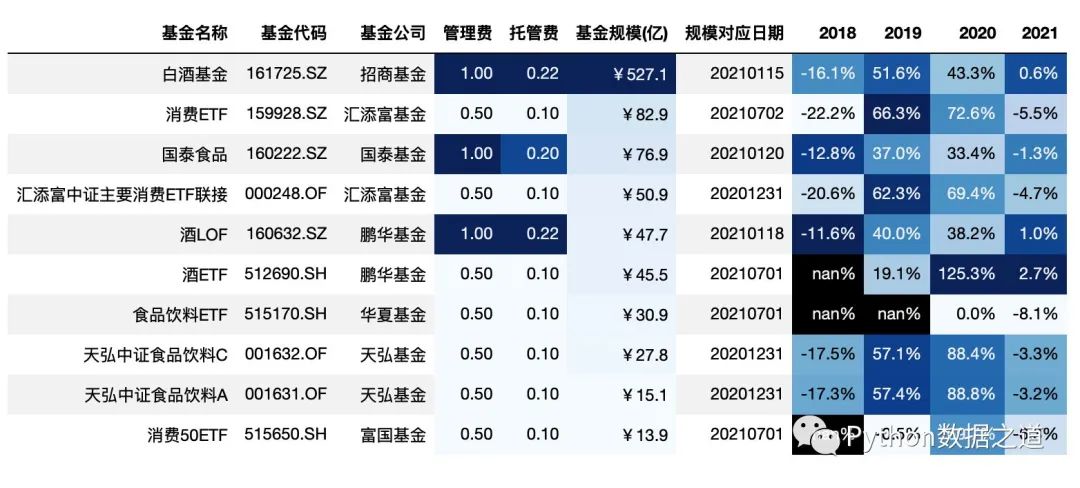
如果不對 subset 進(jìn)行設(shè)置,background_gradient 函數(shù)將默認(rèn)對所有數(shù)值類型的列進(jìn)行背景顏色標(biāo)注。
對 subset 進(jìn)行設(shè)置后,可以選擇特定的列或特定的范圍進(jìn)行背景顏色的設(shè)置。
# 對基金規(guī)模以色階顏色進(jìn)行標(biāo)注

df_consume.style.hide_index()\
                .hide_columns(['性別','基金經(jīng)理','上任日期'])\
                .format(format_dict)\
                .background_gradient(subset=['基金規(guī)模(億)'],cmap='Blues')
效果如下:
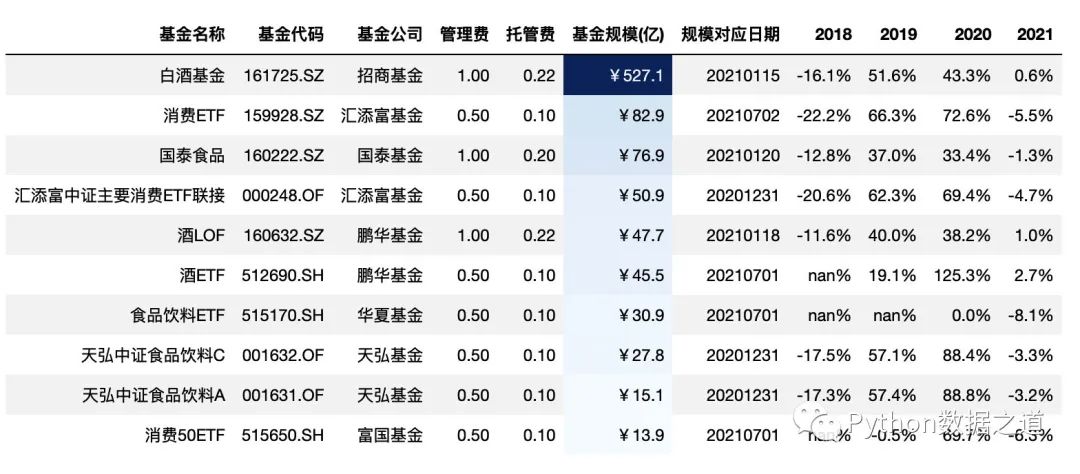
此外,可以通過對 low 和 high 值的設(shè)置,可以來調(diào)節(jié)背景顏色的范圍,low 和 high 分別是壓縮 低端和高端的顏色范圍,其數(shù)值范圍一般是 0~1 ,各位可以調(diào)試下。
# 對基金規(guī)模以色階顏色進(jìn)行標(biāo)注
# 通過對 low 和 high 值的設(shè)置,可以來調(diào)節(jié)背景顏色的范圍
# low 和 high 分別是壓縮 低端和高端的顏色范圍,其數(shù)值范圍一般是 0~1 ,各位可以調(diào)試下

df_consume.style.hide_index()\
                .hide_columns(['性別','基金經(jīng)理','上任日期'])\
                .format(format_dict)\
                .background_gradient(subset=['基金規(guī)模(億)'],cmap='Blues',low=0.3,high=0.9)
效果如下:
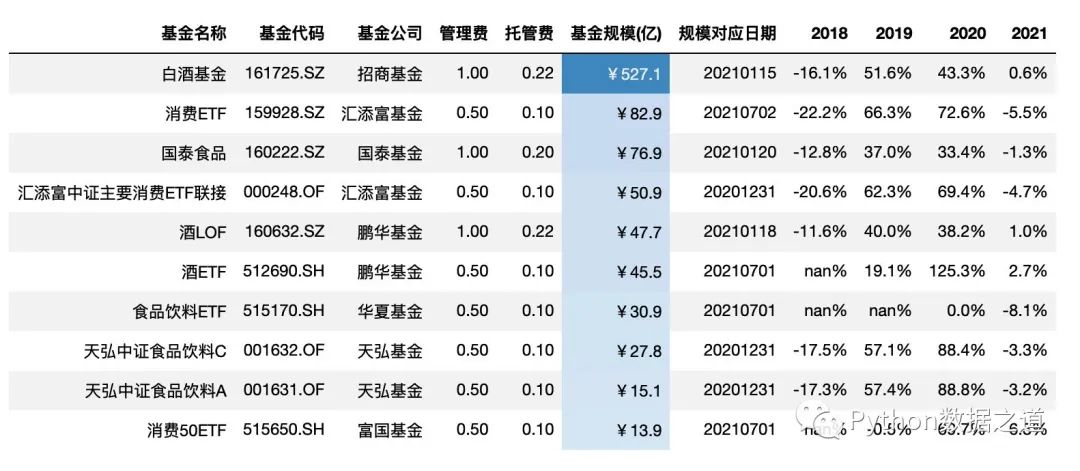
當(dāng)數(shù)據(jù)范圍比較大時,可以通過設(shè)置 vmin 和 vmax 來設(shè)置最小和最大的顏色的設(shè)置起始點。
比如下面,基金規(guī)模在20億以下的,顏色最淺,規(guī)模70億以上的,顏色最深,20~70億之間的,顏色漸變。
# 對基金規(guī)模以色階顏色進(jìn)行標(biāo)注
df_consume.style.hide_index()\
                .hide_columns(['性別','基金經(jīng)理','上任日期'])\
                .format(format_dict)\
                .background_gradient(subset=['基金規(guī)模(億)'],cmap='Blues',vmin=20,vmax=70)
通過 gmap 的設(shè)置,可以方便的按照某列的值,對行進(jìn)行全部的背景設(shè)置
df_consume.style.hide_index()\
                .hide_columns(['性別','基金經(jīng)理','上任日期'])\
                .format(format_dict)\
                .background_gradient(cmap='Blues',gmap=df_consume['基金規(guī)模(億)'])
效果如下:
gmap 還可以以矩陣的形式對數(shù)據(jù)進(jìn)行樣式設(shè)置,如下:
df_gmap = df_consume.loc[:2,['基金名稱','管理費','基金規(guī)模(億)','2020']]

gmap = np.array([[1,2,3], [2,3,4], [3,4,5]])  # 3*3 矩陣,后面需要進(jìn)行顏色設(shè)置的形狀也需要是 3*3,需要保持一致
df_gmap.style.background_gradient(axis=None, gmap=gmap,
    cmap='Blues', subset=['管理費','基金規(guī)模(億)','2020']
)
效果如下:
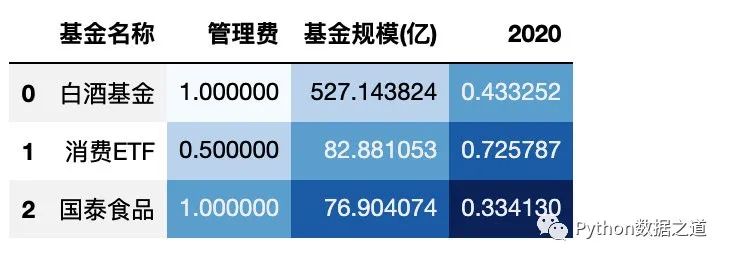
上面 gmap 是 3*3 矩陣,后面需要進(jìn)行顏色設(shè)置的形狀也需要是 3*3,需要保持一致。
需要注意的是 顏色設(shè)置是根據(jù) gmap中的值來設(shè)置顏色深淺的,而不是根據(jù) DataFrame 中的數(shù)值來的。
這個在某些特定的情況下可能會用到。
文本色階顏色設(shè)置
類似于背景色階顏色設(shè)置,文本也是可以進(jìn)行顏色設(shè)置的。
使用 text_gradient() 函數(shù)可以實現(xiàn)這個功能,其參數(shù)如下:
Styler.text_gradient(cmap='PuBu', low=0, high=0, axis=0, subset=None, vmin=None, vmax=None, gmap=None)
text_gradient() 函數(shù)的用法跟 background_gradient() 函數(shù)的用法基本是一樣的。
下面演示兩個使用案例,其他的用法參考 background_gradient() 函數(shù)。
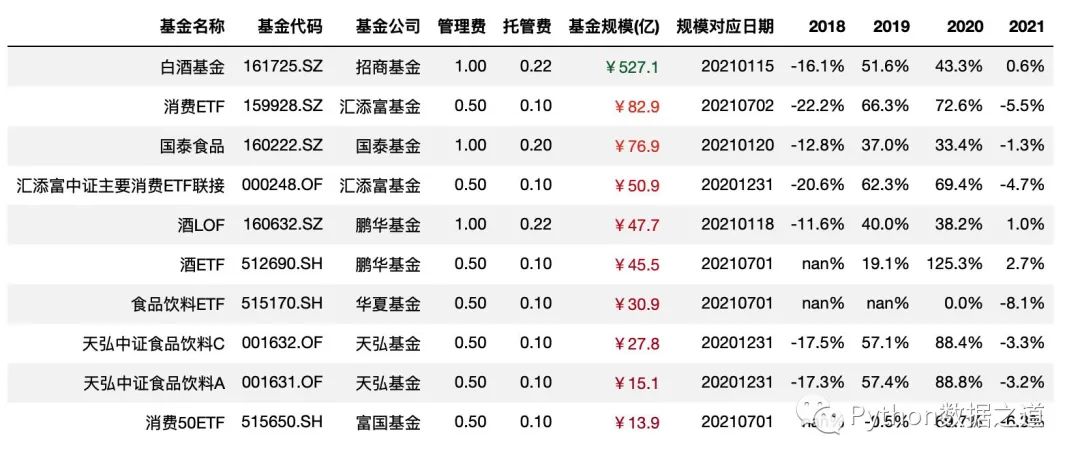
某列的文本色階顯示
# 對基金規(guī)模以色階顏色進(jìn)行標(biāo)注

df_consume.style.hide_index()\
                .hide_columns(['性別','基金經(jīng)理','上任日期'])\
                .format(format_dict)\
                .text_gradient(subset=['基金規(guī)模(億)'],cmap='RdYlGn')
效果如下:
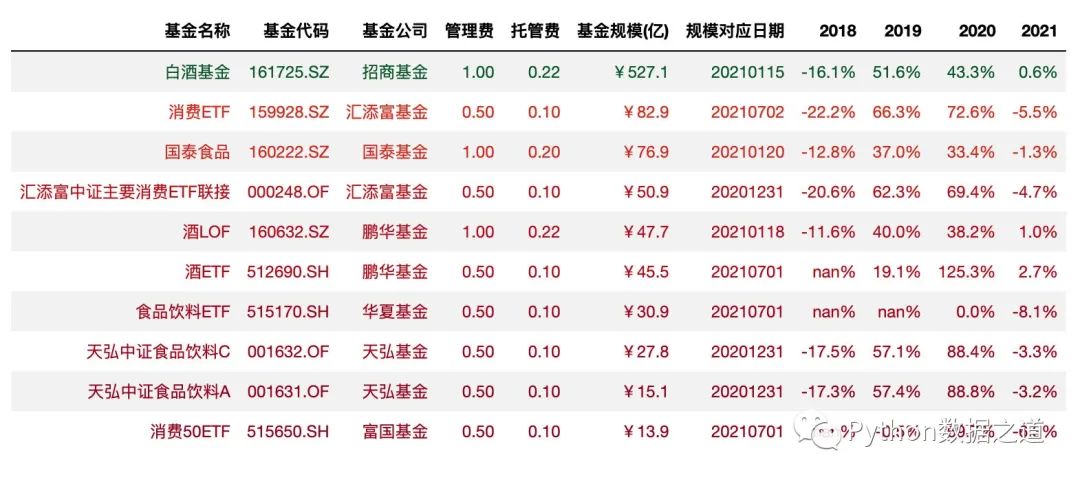
全部表格的文本色階顯示
# 通過 `gmap` 的設(shè)置,可以方便的按照某列的值,對行進(jìn)行全部的文本顏色設(shè)置

df_consume.style.hide_index()\
                .hide_columns(['性別','基金經(jīng)理','上任日期'])\
                .format(format_dict)\
                .text_gradient(cmap='RdYlGn',gmap=df_consume['基金規(guī)模(億)'])
效果如下:
07 數(shù)據(jù)條顯示
數(shù)據(jù)條的顯示方式,可以同時在數(shù)據(jù)表格里對數(shù)據(jù)進(jìn)行可視化顯示,這個功能咱們在 Excel 里也是經(jīng)常用到的。
在 pandas 中,可以使用 DataFrame.style.bar() 函數(shù)來實現(xiàn)這個功能,其參數(shù)如下:
Styler.bar(subset=None, axis=0, color='#d65f5f', width=100, align='left', vmin=None, vmax=None)
示例代碼如下:
df_consume.style.hide_index()\
                .hide_columns(['性別','基金經(jīng)理','上任日期'])\
                .format(format_dict)\
                .bar(subset=['基金規(guī)模(億)','2018','2021'],color=['#99ff66','#ee7621'])
效果如下:
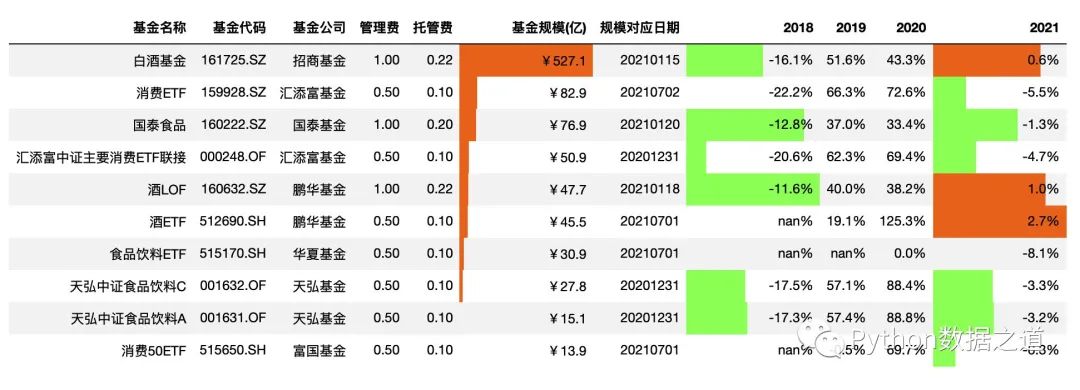
設(shè)置對其方式
上面這個可視化效果,對于正負(fù)數(shù)值的區(qū)別,看起來總是有點別扭。
可以通過設(shè)置 aligh 參數(shù)的值來控制顯示方式:
left: 最小值從單元格的左側(cè)開始。
zero: 零值位于單元格的中心。
mid: 單元格的中心在(max-min)/ 2,或者如果值全為負(fù)(正),則零對齊于單元格的右(左)。
將顯示設(shè)置為 mid 后,符合大部分人的視覺審美觀,代碼如下:
df_consume.style.hide_index()\
                .hide_columns(['性別','基金經(jīng)理','上任日期'])\
                .format(format_dict)\
                .bar(subset=['基金規(guī)模(億)','2018','2021'],color=['#99ff66','#ee7621'],align='mid')
效果如下:
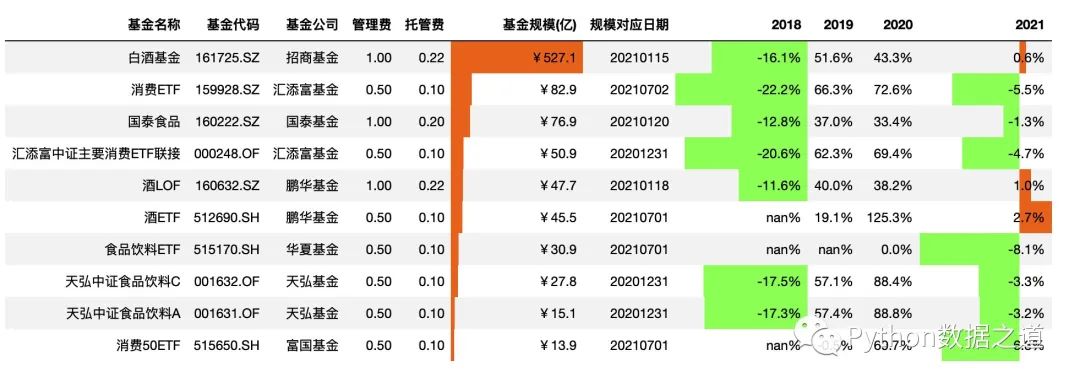
關(guān)于顏色設(shè)置,color=['#99ff66','#ee7621'], color可以設(shè)置為單個顏色,所有的數(shù)據(jù)只顯示同一個顏色,也可以設(shè)置為包含兩個元素的list或tuple形式,左邊的顏色標(biāo)注負(fù)數(shù)值,右邊的顏色標(biāo)注正數(shù)值。
08 自定義函數(shù)的使用
通過 apply 和 applymap 函數(shù),用戶可以使用自定義函數(shù)來進(jìn)行樣式設(shè)置。
其中:
apply通過axis參數(shù),每一次將一列或一行或整個表傳遞到DataFrame中。對于按列使用 axis=0, 按行使用 axis=1, 整個表使用 axis=None。applymap作用于范圍內(nèi)的每個元素。
apply
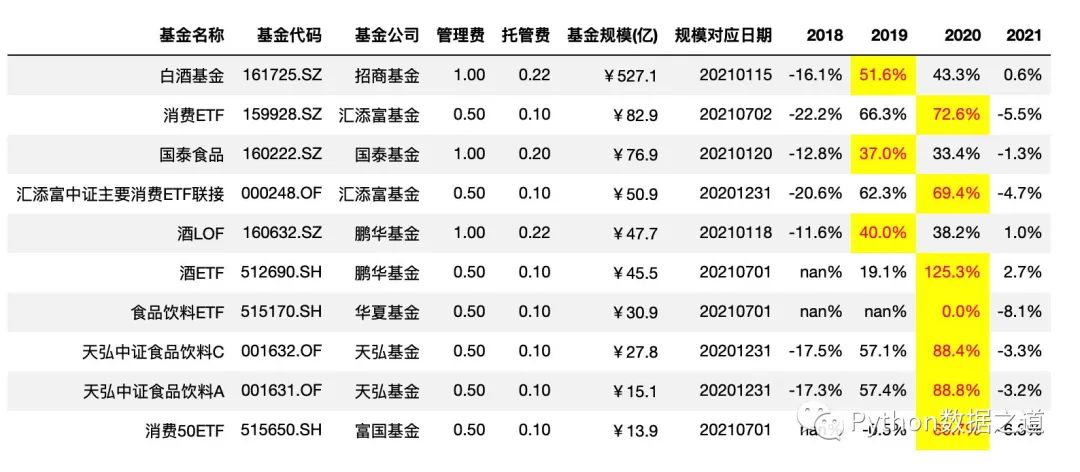
先自定義了函數(shù)max_value(),用來找到符合條件的最大值,apply 使用的示例代碼如下:
按列設(shè)置樣式
def max_value(x, color='red'):
    return np.where(x == np.nanmax(x.to_numpy()), f"color: {color};background-color:yellow", None)

# axis =0 ,按列設(shè)置樣式
df_consume.style.hide_index()\
                .hide_columns(['性別','基金經(jīng)理','上任日期',])\
                .format(format_dict)\
                .apply(max_value,axis=0,subset=['2018','2019','2020','2021'])
效果如下:
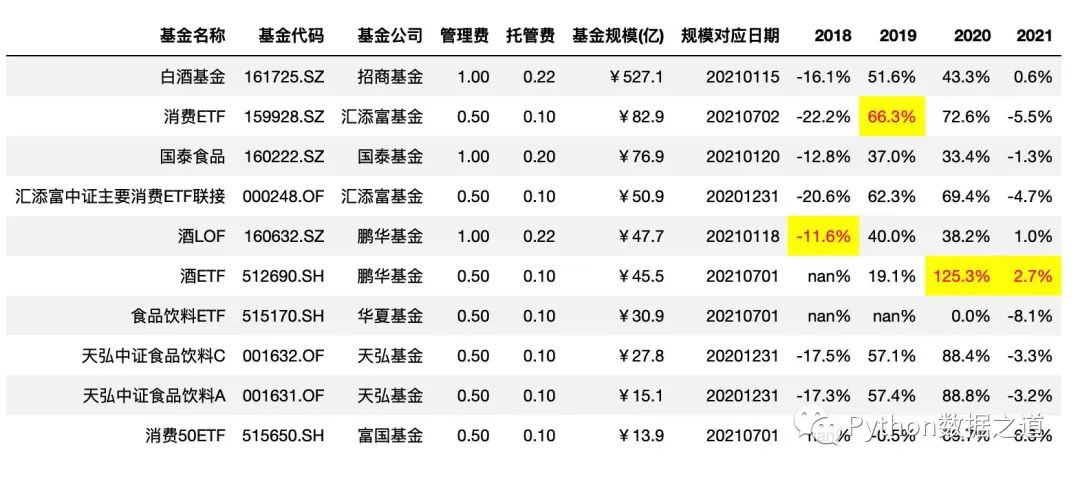
按行設(shè)置樣式
# axis =1 ,按行設(shè)置樣式
df_consume.style.hide_index()\
                .hide_columns(['性別','基金經(jīng)理','上任日期',])\
                .format(format_dict)\
                .apply(max_value,axis=1,subset=['2018','2019','2020','2021'])
效果如下:
按整個表格設(shè)置樣式
按整個表格設(shè)置樣式時,需要注意的是,整個表格的數(shù)據(jù)類型需要是一樣的,不然會報錯。
示例代碼如下:
# axis = None ,按整個表格設(shè)置樣式
# 注意,整個表格的數(shù)據(jù)類型需要是一樣的,不然會報錯
df_consume_1 = df_consume[['2018','2019','2020','2021']]
# df_consume_1
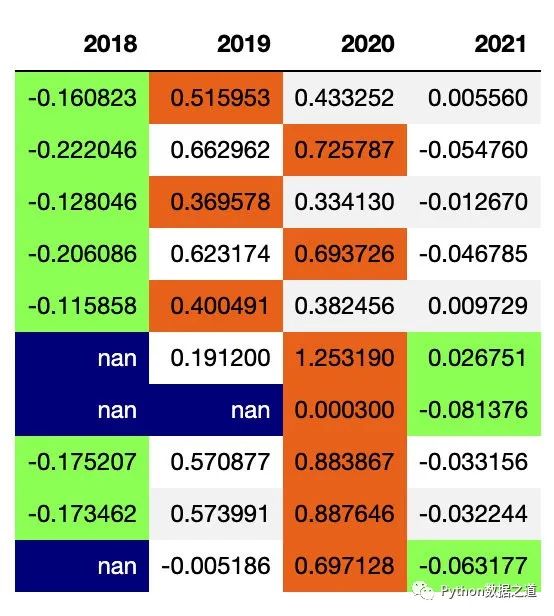
df_consume_1.style.hide_index().apply(max_value,axis=None)
效果如下:
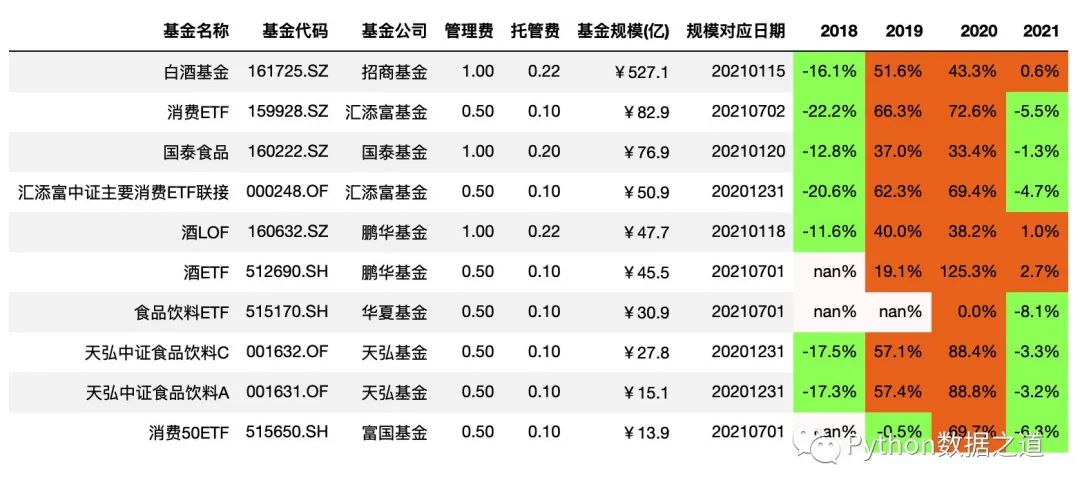
applymap
繼續(xù)上面的數(shù)據(jù)表格,我們來自定義一個函數(shù),對于基金的年度漲跌幅情況,年度上漲以橙色背景標(biāo)注,下跌以綠色背景標(biāo)注,NaN值以灰色背景標(biāo)注。
由于 applymap 是作用于每個元素的,因此該函數(shù)不需要 axis 這個參數(shù)來進(jìn)行設(shè)置,示例代碼如下:
def color_returns(val):
    if val >=0:
        color = '#EE7621'  # light red
    elif val <0:
        color =  '#99ff66' # light green  '#99ff66'
    else:
        color = '#FFFAFA'  # ligth gray
    return f'background-color: {color}'

format_dict = {'基金規(guī)模(億)': '¥{0:.1f}',
               '管理費': '{0:.2f}',
               '托管費': '{0:.2f}',
               '規(guī)模對應(yīng)日期':lambda x: "{}".format(x.strftime('%Y%m%d')),
               '2018': '{0:.1%}',
               '2019': '{0:.1%}',
               '2020': '{0:.1%}',
               '2021': '{0:.1%}'
                }

df_consume.style.hide_index()\
                .hide_columns(['性別','基金經(jīng)理','上任日期',])\
                .format(format_dict)\
                .applymap(color_returns,subset=['2018','2019','2020','2021'])
效果如下:
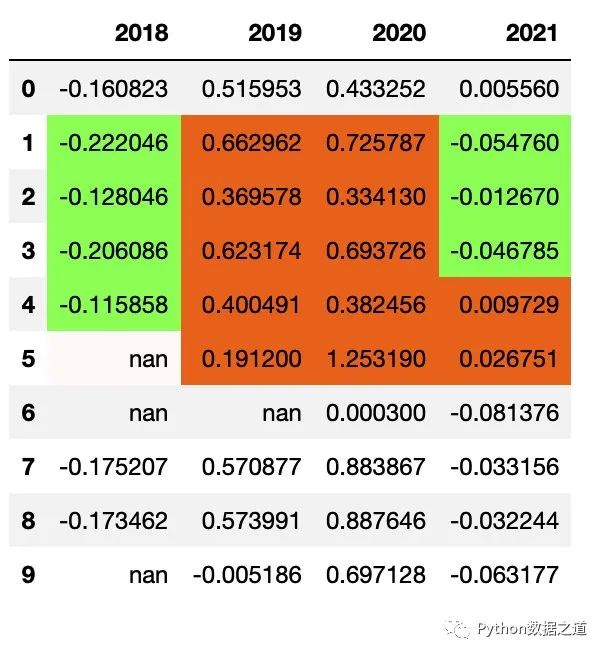
09 顏色設(shè)置范圍選擇
在使用 Style 中的函數(shù)對表格數(shù)據(jù)進(jìn)行樣式設(shè)置時,對于有 subset 參數(shù)的函數(shù),可以通過設(shè)置 行和列的范圍來控制需要進(jìn)行樣式設(shè)置的區(qū)域。
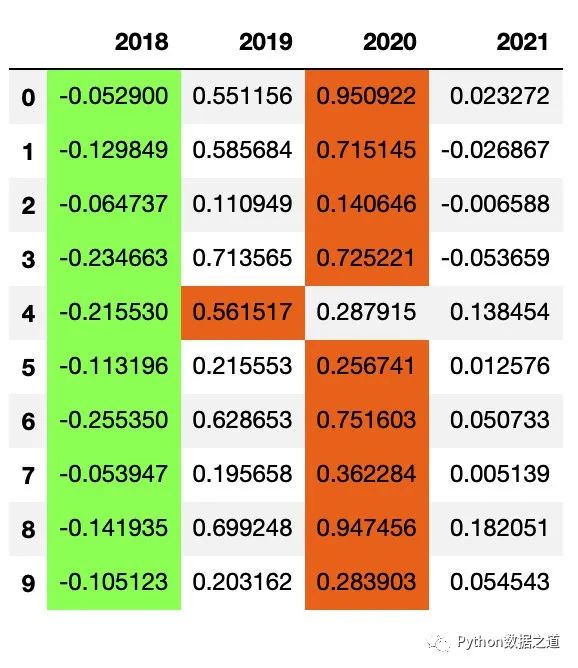
對行(row)進(jìn)行范圍設(shè)置
df_consume_1.style.applymap(color_returns,subset=pd.IndexSlice[1:5,])
效果如下:
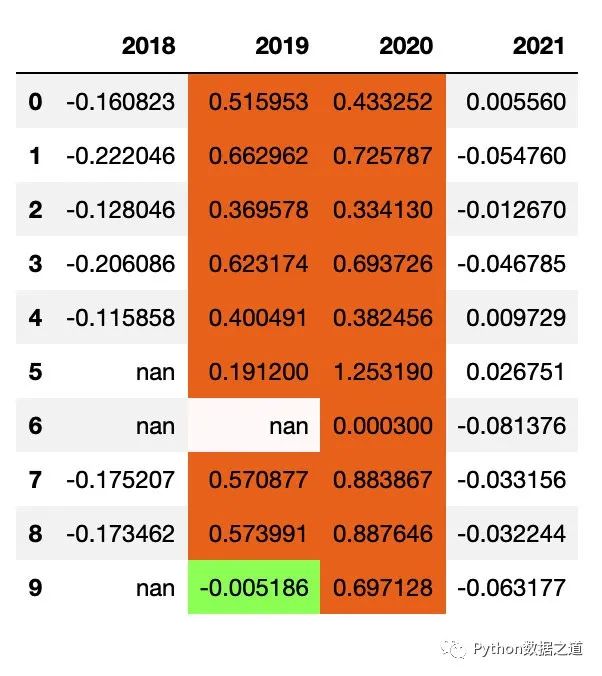
對列(column)進(jìn)行范圍設(shè)置
df_consume_1.style.applymap(color_returns,subset=['2019','2020'])
效果如下:
對行和列同時進(jìn)行范圍設(shè)置
df_consume.style.hide_index()\
                .hide_columns(['性別','基金經(jīng)理','上任日期',])\
                .format(format_dict)\
                .applymap(color_returns,subset=pd.IndexSlice[1:5,['2018','2019','2020']])
效果如下:
10 共享樣式
對于pandas 中樣式設(shè)置后的共享復(fù)用,目前支持通過 Styler.export() 導(dǎo)出樣式,然后通過 Styler.use() 來使用導(dǎo)出的樣式。
不過經(jīng)過陽哥的測試,簡單的樣式導(dǎo)出與使用是可以的。但稍微復(fù)雜一些的情況,目前的pandas版本是不太好用的。
簡單樣式
示例如下,先保存當(dāng)前樣式:
df_consume_1 = df_consume[['2018','2019','2020','2021']]
# df_consume_1
style1 = df_consume_1.style.hide_index()\
                .highlight_min(axis=1,subset=['2018','2019','2020','2021'],props='color:black;background-color:#99ff66')\
                .highlight_max(axis=1,subset=['2018','2019','2020','2021'],props='color:black;background-color:#ee7621')\
                .highlight_null(props='color:white;background-color:darkblue')
style1
保存的樣式的效果如下:
使用保存的樣式:
df_fund_1 = df_fund[['2018','2019','2020','2021']]

df_fund_1.style.use(style1.export())
效果如下:
由于后面的數(shù)據(jù)表格是沒有空值的,所以兩者的樣式實際是一樣的。
復(fù)雜樣式
當(dāng)樣式設(shè)置較多時,比如同時隱藏索引、隱藏列、設(shè)置數(shù)據(jù)格式、高亮特定值等,這個時候有些操作在導(dǎo)出后使用時并沒有效果。
測試如下,先保存樣式:
style3 = df_consume.style.hide_index()\
                .hide_columns(['性別','基金經(jīng)理','上任日期',])\
                .format(format_dict)\
                .highlight_min(axis=1,subset=['2018','2019','2020','2021'],props='color:black;background-color:#99ff66')\
                .highlight_max(axis=1,subset=['2018','2019','2020','2021'],props='color:black;background-color:#ee7621')\
                .highlight_null(props='color:white;background-color:darkblue')
style3
保存樣式的效果如下:
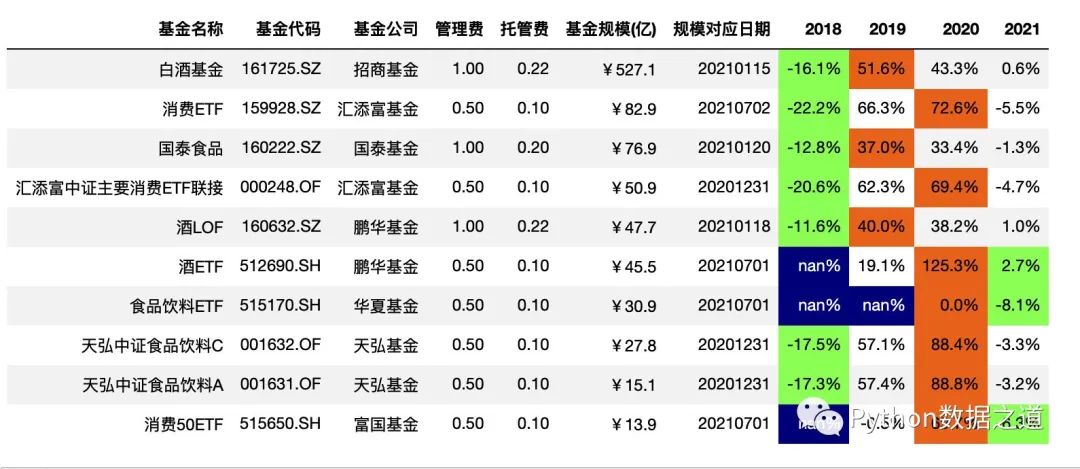
使用保存的樣式:
df_fund.style.use(style3.export())
效果如下:
從上面來看,我們希望的樣式效果,并沒有很好的實現(xiàn)。
所以,針對較為復(fù)雜的樣式,還是乖乖的復(fù)制代碼使用吧。
11 導(dǎo)出樣式到Excel
導(dǎo)出樣式到 Excel 中,這個功能還是比較實用的。
DataFrames 使用 OpenPyXL 或XlsxWriter 引擎可以將樣式導(dǎo)出到 Excel 工作表。
不過,這個功能目前也還是處于不斷完善過程中,估計有時候有些內(nèi)容會沒有效果。
大家可以在使用過程中來發(fā)現(xiàn)其中的一些問題。
來看一個案例:
df_consume.style.hide_index()\
                .hide_columns(['性別','基金經(jīng)理','上任日期',])\
                .format(format_dict)\
                .highlight_min(axis=1,subset=['2018','2019','2020','2021'],props='color:black;background-color:#99ff66')\
                .highlight_max(axis=1,subset=['2018','2019','2020','2021'],props='color:black;background-color:#ee7621')\
                .highlight_null(props='color:white;background-color:darkblue')\
                .to_excel('style_export.xlsx',engine = 'openpyxl')
上面的案例內(nèi)容導(dǎo)出到 excel 后,我從 excel 中打開查看了下效果如下:
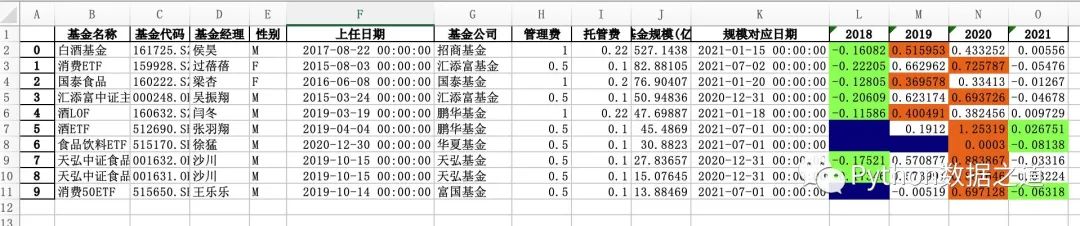
可以看出,跟共享樣式里有些相同的問題,比如隱藏索引、隱藏列、設(shè)置數(shù)據(jù)格式等效果并沒有實現(xiàn)。
12 總結(jié)
以上是 Pandas 表格樣式設(shè)置內(nèi)容的匯總,應(yīng)該是匯集了大部分使用功能。
關(guān)于 Pandas 表格樣式設(shè)置的使用心得,歡迎大家來交流哈。
原創(chuàng)不易,大家讀完順手點下右下角的 “在看”,就是最大的鼓勵和支持了。
參考文檔
https://pandas.pydata.org/pandas-docs/stable/user_guide/style.html
https://pandas.pydata.org/docs/reference/api/pandas.io.formats.style.Styler.html
PS:公號內(nèi)回復(fù)「Python」即可進(jìn)入Python 新手學(xué)習(xí)交流群,一起 100 天計劃!
老規(guī)矩,兄弟們還記得么,右下角的 “在看” 點一下,如果感覺文章內(nèi)容不錯的話,記得分享朋友圈讓更多的人知道!


【神秘禮包獲取方式】