
實(shí)戰(zhàn)|如何優(yōu)雅地自定義Prometheus監(jiān)控指標(biāo)
擊查看源網(wǎng)頁")
大家好!我是"無敵碼農(nóng)",今天要和大家分享的是在實(shí)際工作中“如何優(yōu)雅地自定義Prometheus監(jiān)控指標(biāo)”!目前大部分使用Spring Boot構(gòu)建微服務(wù)體系的公司,大都在使用Prometheus來構(gòu)建微服務(wù)的度量指標(biāo)(Metrics)類監(jiān)控系統(tǒng)。而一般做法是通過在微服務(wù)應(yīng)用中集成Prometheus指標(biāo)采集SDK,從而使得Spring Boot暴露相關(guān)Metrics采集端點(diǎn)來實(shí)現(xiàn)。
但一般來說,Spring Boot默認(rèn)暴露的Metrics數(shù)量及類型是有限的,如果想要建立針對(duì)微服務(wù)應(yīng)用更豐富的監(jiān)控維度(例如TP90/TP99分位值指標(biāo)之類),那么還需要我們?cè)赟pring Boot默認(rèn)已經(jīng)打開的Metrics基礎(chǔ)之上,配置Prometheus類庫(micrometer-registry-prometheus)所提供的其他指標(biāo)類型。
但怎么樣才能在Spring Boot框架中以更優(yōu)雅地方式實(shí)現(xiàn)呢?難道需要在業(yè)務(wù)代碼中編寫各種自定義監(jiān)控指標(biāo)代碼的暴露邏輯嗎?接下來的內(nèi)容我們將通過@注解+AOP的方式來演示如何以更加優(yōu)雅的方式來實(shí)現(xiàn)Prometheus監(jiān)控指標(biāo)的自定義!
自定義監(jiān)控指標(biāo)配置注解

需要說明的是在Spring Boot應(yīng)用中,對(duì)程序運(yùn)行信息的收集(如指標(biāo)、日志),比較常用的方法是通過Spring的AOP代理攔截來實(shí)現(xiàn),但這種攔截程序運(yùn)行過程的邏輯多少會(huì)損耗點(diǎn)系統(tǒng)性能,因此在自定義Prometheus監(jiān)控指標(biāo)的過程中,可以將是否上報(bào)指標(biāo)的選擇權(quán)交給開發(fā)人員,而從易用性角度來說,可以通過注解的方式實(shí)現(xiàn)。例如:
package com.wudimanong.monitor.metrics.annotation;

import java.lang.annotation.ElementType;
import java.lang.annotation.Inherited;
import java.lang.annotation.Retention;
import java.lang.annotation.RetentionPolicy;
import java.lang.annotation.Target;

@Target({ElementType.METHOD})
@Retention(RetentionPolicy.RUNTIME)
@Inherited
public @interface Tp {

    String description() default "";
}
如上所示代碼,我們定義了一個(gè)用于標(biāo)注上報(bào)計(jì)時(shí)器指標(biāo)類型的注解,如果想統(tǒng)計(jì)接口的想TP90、TP99這樣的分位值指標(biāo),那么就可以通過該注解標(biāo)注。除此之外,還可以定義上報(bào)其他指標(biāo)類型的注解,例如:
package com.wudimanong.monitor.metrics.annotation;

import java.lang.annotation.ElementType;
import java.lang.annotation.Inherited;
import java.lang.annotation.Retention;
import java.lang.annotation.RetentionPolicy;
import java.lang.annotation.Target;

@Target({ElementType.METHOD})
@Retention(RetentionPolicy.RUNTIME)
@Inherited
public @interface Count {

    String description() default "";
}
如上所示,我們定義了一個(gè)用于上報(bào)計(jì)數(shù)器類型指標(biāo)的注解!如果要統(tǒng)計(jì)接口的平均響應(yīng)時(shí)間、接口的請(qǐng)求量之類的指標(biāo),那么可以通過該注解標(biāo)注!
而如果覺得分別定義不同指標(biāo)類型的注解比較麻煩,對(duì)于某些接口上述各種指標(biāo)類型都希望上報(bào)到Prometheus,那么也可以定義一個(gè)通用注解,用于同時(shí)上報(bào)多個(gè)指標(biāo)類型,例如:
package com.wudimanong.monitor.metrics.annotation;

import java.lang.annotation.ElementType;
import java.lang.annotation.Inherited;
import java.lang.annotation.Retention;
import java.lang.annotation.RetentionPolicy;
import java.lang.annotation.Target;

@Target({ElementType.METHOD})
@Retention(RetentionPolicy.RUNTIME)
@Inherited
public @interface Monitor {

    String description() default "";
}
總之,無論是分開定義特定指標(biāo)注解還是定義一個(gè)通用的指標(biāo)注解,其目標(biāo)都是希望以更靈活的方式來擴(kuò)展Spring Boot微服務(wù)應(yīng)用的監(jiān)控指標(biāo)類型。
自定義監(jiān)控指標(biāo)注解AOP代理邏輯實(shí)現(xiàn)
上面我們靈活定義了上報(bào)不同指標(biāo)類型的注解,而上述注解的具體實(shí)現(xiàn)邏輯,可以通過定義一個(gè)通用的AOP代理類來實(shí)現(xiàn),具體實(shí)現(xiàn)代碼如下:
package com.wudimanong.monitor.metrics.aop;

import com.wudimanong.monitor.metrics.Metrics;
import com.wudimanong.monitor.metrics.annotation.Count;
import com.wudimanong.monitor.metrics.annotation.Monitor;
import com.wudimanong.monitor.metrics.annotation.Tp;
import io.micrometer.core.instrument.Counter;
import io.micrometer.core.instrument.MeterRegistry;
import io.micrometer.core.instrument.Tag;
import io.micrometer.core.instrument.Tags;
import io.micrometer.core.instrument.Timer;
import java.lang.reflect.Method;
import java.util.function.Function;
import org.aspectj.lang.ProceedingJoinPoint;
import org.aspectj.lang.annotation.Around;
import org.aspectj.lang.annotation.Aspect;
import org.aspectj.lang.reflect.MethodSignature;
import org.springframework.stereotype.Component;

@Aspect
@Component
public class MetricsAspect {

    /**
     * Prometheus指標(biāo)管理
     */
    private MeterRegistry registry;

    private Function<ProceedingJoinPoint, Iterable<Tag>> tagsBasedOnJoinPoint;

    public MetricsAspect(MeterRegistry registry) {
        this.init(registry, pjp -> Tags
                .of(new String[]{"class", pjp.getStaticPart().getSignature().getDeclaringTypeName(), "method",
                        pjp.getStaticPart().getSignature().getName()}));
    }

    public void init(MeterRegistry registry, Function<ProceedingJoinPoint, Iterable<Tag>> tagsBasedOnJoinPoint) {
        this.registry = registry;
        this.tagsBasedOnJoinPoint = tagsBasedOnJoinPoint;
    }

    /**
     * 針對(duì)@Tp指標(biāo)配置注解的邏輯實(shí)現(xiàn)
     */
    @Around("@annotation(com.wudimanong.monitor.metrics.annotation.Tp)")
    public Object timedMethod(ProceedingJoinPoint pjp) throws Throwable {
        Method method = ((MethodSignature) pjp.getSignature()).getMethod();
        method = pjp.getTarget().getClass().getMethod(method.getName(), method.getParameterTypes());
        Tp tp = method.getAnnotation(Tp.class);
        Timer.Sample sample = Timer.start(this.registry);
        String exceptionClass = "none";
        try {
            return pjp.proceed();
        } catch (Exception ex) {
            exceptionClass = ex.getClass().getSimpleName();
            throw ex;
        } finally {
            try {
                String finalExceptionClass = exceptionClass;
                //創(chuàng)建定義計(jì)數(shù)器,并設(shè)置指標(biāo)的Tags信息(名稱可以自定義)
                Timer timer = Metrics.newTimer("tp.method.timed",
                        builder -> builder.tags(new String[]{"exception", finalExceptionClass})
                                .tags(this.tagsBasedOnJoinPoint.apply(pjp)).tag("description", tp.description())
                                .publishPercentileHistogram().register(this.registry));
                sample.stop(timer);
            } catch (Exception exception) {
            }
        }
    }

    /**
     * 針對(duì)@Count指標(biāo)配置注解的邏輯實(shí)現(xiàn)
     */
    @Around("@annotation(com.wudimanong.monitor.metrics.annotation.Count)")
    public Object countMethod(ProceedingJoinPoint pjp) throws Throwable {
        Method method = ((MethodSignature) pjp.getSignature()).getMethod();
        method = pjp.getTarget().getClass().getMethod(method.getName(), method.getParameterTypes());
        Count count = method.getAnnotation(Count.class);
        String exceptionClass = "none";
        try {
            return pjp.proceed();
        } catch (Exception ex) {
            exceptionClass = ex.getClass().getSimpleName();
            throw ex;
        } finally {
            try {
                String finalExceptionClass = exceptionClass;
                //創(chuàng)建定義計(jì)數(shù)器,并設(shè)置指標(biāo)的Tags信息(名稱可以自定義)
                Counter counter = Metrics.newCounter("count.method.counted",
                        builder -> builder.tags(new String[]{"exception", finalExceptionClass})
                                .tags(this.tagsBasedOnJoinPoint.apply(pjp)).tag("description", count.description())
                                .register(this.registry));
                counter.increment();
            } catch (Exception exception) {
            }
        }
    }

    /**
     * 針對(duì)@Monitor通用指標(biāo)配置注解的邏輯實(shí)現(xiàn)
     */
    @Around("@annotation(com.wudimanong.monitor.metrics.annotation.Monitor)")
    public Object monitorMethod(ProceedingJoinPoint pjp) throws Throwable {
        Method method = ((MethodSignature) pjp.getSignature()).getMethod();
        method = pjp.getTarget().getClass().getMethod(method.getName(), method.getParameterTypes());
        Monitor monitor = method.getAnnotation(Monitor.class);
        String exceptionClass = "none";
        try {
            return pjp.proceed();
        } catch (Exception ex) {
            exceptionClass = ex.getClass().getSimpleName();
            throw ex;
        } finally {
            try {
                String finalExceptionClass = exceptionClass;
                //計(jì)時(shí)器Metric
                Timer timer = Metrics.newTimer("tp.method.timed",
                        builder -> builder.tags(new String[]{"exception", finalExceptionClass})
                                .tags(this.tagsBasedOnJoinPoint.apply(pjp)).tag("description", monitor.description())
                                .publishPercentileHistogram().register(this.registry));
                Timer.Sample sample = Timer.start(this.registry);
                sample.stop(timer);

                //計(jì)數(shù)器Metric
                Counter counter = Metrics.newCounter("count.method.counted",
                        builder -> builder.tags(new String[]{"exception", finalExceptionClass})
                                .tags(this.tagsBasedOnJoinPoint.apply(pjp)).tag("description", monitor.description())
                                .register(this.registry));
                counter.increment();
            } catch (Exception exception) {
            }
        }
    }
}
上述代碼完整的實(shí)現(xiàn)了前面我們定義的指標(biāo)配置注解的邏輯,其中針對(duì)@Monitor注解的邏輯就是@Tp和@Count注解邏輯的整合。如果還需要定義其他指標(biāo)類型,可以在此基礎(chǔ)上繼續(xù)擴(kuò)展!
需要注意,在上述邏輯實(shí)現(xiàn)中對(duì)“Timer”及“Counter”等指標(biāo)類型的構(gòu)建這里并沒有直接使用“micrometer-registry-prometheus”依賴包中的構(gòu)建對(duì)象,而是通過自定義的Metrics.newTimer()這樣的方式實(shí)現(xiàn),其主要用意是希望以更簡潔、靈活的方式去實(shí)現(xiàn)指標(biāo)的上報(bào),其代碼定義如下:
package com.wudimanong.monitor.metrics;

import io.micrometer.core.instrument.Counter;
import io.micrometer.core.instrument.Counter.Builder;
import io.micrometer.core.instrument.DistributionSummary;
import io.micrometer.core.instrument.Gauge;
import io.micrometer.core.instrument.MeterRegistry;
import io.micrometer.core.instrument.Timer;
import io.micrometer.core.lang.NonNull;
import java.util.function.Consumer;
import java.util.function.Supplier;
import org.springframework.beans.BeansException;
import org.springframework.context.ApplicationContext;
import org.springframework.context.ApplicationContextAware;

public class Metrics implements ApplicationContextAware {

    private static ApplicationContext context;

    @Override
    public void setApplicationContext(@NonNull ApplicationContext applicationContext) throws BeansException {
        context = applicationContext;
    }

    public static ApplicationContext getContext() {
        return context;
    }

    public static Counter newCounter(String name, Consumer<Builder> consumer) {
        MeterRegistry meterRegistry = context.getBean(MeterRegistry.class);
        return new CounterBuilder(meterRegistry, name, consumer).build();
    }

    public static Timer newTimer(String name, Consumer<Timer.Builder> consumer) {
        return new TimerBuilder(context.getBean(MeterRegistry.class), name, consumer).build();
    }
}
上述代碼通過接入Spring容器上下文,獲取了MeterRegistry實(shí)例,并以此來構(gòu)建像Counter、Timer這樣的指標(biāo)類型對(duì)象。而這里之所以將獲取方法定義為靜態(tài)的,主要是便于在業(yè)務(wù)代碼中進(jìn)行引用!
而在上述代碼中涉及的CounterBuilder、TimerBuilder構(gòu)造器代碼定義分別如下:
package com.wudimanong.monitor.metrics;

import io.micrometer.core.instrument.Counter;
import io.micrometer.core.instrument.Counter.Builder;
import io.micrometer.core.instrument.MeterRegistry;
import java.util.function.Consumer;

public class CounterBuilder {

    private final MeterRegistry meterRegistry;

    private Counter.Builder builder;

    private Consumer<Builder> consumer;

    public CounterBuilder(MeterRegistry meterRegistry, String name, Consumer<Counter.Builder> consumer) {
        this.builder = Counter.builder(name);
        this.meterRegistry = meterRegistry;
        this.consumer = consumer;
    }

    public Counter build() {
        consumer.accept(builder);
        return builder.register(meterRegistry);
    }
}
上述代碼為CounterBuilder構(gòu)造器代碼!TimerBuilder構(gòu)造器代碼如下:
package com.wudimanong.monitor.metrics;

import io.micrometer.core.instrument.MeterRegistry;
import io.micrometer.core.instrument.Timer;
import io.micrometer.core.instrument.Timer.Builder;
import java.util.function.Consumer;

public class TimerBuilder {

    private final MeterRegistry meterRegistry;

    private Timer.Builder builder;

    private Consumer<Builder> consumer;

    public TimerBuilder(MeterRegistry meterRegistry, String name, Consumer<Timer.Builder> consumer) {
        this.builder = Timer.builder(name);
        this.meterRegistry = meterRegistry;
        this.consumer = consumer;
    }

    public Timer build() {
        this.consumer.accept(builder);
        return builder.register(meterRegistry);
    }
}
之所以還特地將構(gòu)造器代碼單獨(dú)定義,主要是從代碼的優(yōu)雅性考慮!如果涉及其他指標(biāo)類型的構(gòu)造,也可以通過類似的方法進(jìn)行擴(kuò)展!
自定義指標(biāo)注解配置類
在上述代碼中我們已經(jīng)定義了幾個(gè)自定義指標(biāo)注解及其實(shí)現(xiàn)邏輯代碼,為了使其在Spring Boot環(huán)境中運(yùn)行,還需要編寫如下配置類,代碼如下:
package com.wudimanong.monitor.metrics.config;

import com.wudimanong.monitor.metrics.Metrics;
import io.micrometer.core.instrument.MeterRegistry;
import org.springframework.boot.actuate.autoconfigure.metrics.MeterRegistryCustomizer;
import org.springframework.boot.autoconfigure.condition.ConditionalOnMissingBean;
import org.springframework.context.annotation.Bean;
import org.springframework.context.annotation.Configuration;
import org.springframework.core.env.Environment;

@Configuration
public class CustomMetricsAutoConfiguration {

    @Bean
    @ConditionalOnMissingBean
    public MeterRegistryCustomizer<MeterRegistry> meterRegistryCustomizer(Environment environment) {
        return registry -> {
            registry.config()
                    .commonTags("application", environment.getProperty("spring.application.name"));
        };
    }

    @Bean
    @ConditionalOnMissingBean
    public Metrics metrics() {
        return new Metrics();
    }
}
上述配置代碼主要是約定了上報(bào)Prometheus指標(biāo)信息中所攜帶的應(yīng)用名稱,并對(duì)自定義了Metrics類進(jìn)行了Bean配置!
業(yè)務(wù)代碼的使用方式及效果
接下來我們演示在業(yè)務(wù)代碼中如果要上報(bào)Prometheus監(jiān)控指標(biāo)應(yīng)該怎么寫,具體如下:
package com.wudimanong.monitor.controller;

import com.wudimanong.monitor.metrics.annotation.Count;
import com.wudimanong.monitor.metrics.annotation.Monitor;
import com.wudimanong.monitor.metrics.annotation.Tp;
import com.wudimanong.monitor.service.MonitorService;
import org.springframework.beans.factory.annotation.Autowired;
import org.springframework.web.bind.annotation.GetMapping;
import org.springframework.web.bind.annotation.RequestMapping;
import org.springframework.web.bind.annotation.RequestParam;
import org.springframework.web.bind.annotation.RestController;

@RestController
@RequestMapping("/monitor")
public class MonitorController {

    @Autowired
    private MonitorService monitorServiceImpl;

    //監(jiān)控指標(biāo)注解使用
    //@Tp(description = "/monitor/test")
    //@Count(description = "/monitor/test")
    @Monitor(description = "/monitor/test")
    @GetMapping("/test")
    public String monitorTest(@RequestParam("name") String name) {
        monitorServiceImpl.monitorTest(name);
        return "監(jiān)控示范工程測(cè)試接口返回->OK!";
    }
}
如上述代碼所示,在實(shí)際的業(yè)務(wù)編程中就可以比較簡單的通過注解來配置接口所上傳的Prometheus監(jiān)控指標(biāo)了!此時(shí)在本地啟動(dòng)程序,可以通過訪問微服務(wù)應(yīng)用的“/actuator/prometheus”指標(biāo)采集端點(diǎn)來查看相關(guān)指標(biāo),如下圖所示:
有了這些自定義上報(bào)的監(jiān)控指標(biāo),那么Promethues在采集后,我們就可以通過像Grafana這樣的可視化工具,來構(gòu)建起多維度界面友好地監(jiān)控視圖了,例如以TP90/TP99為例:
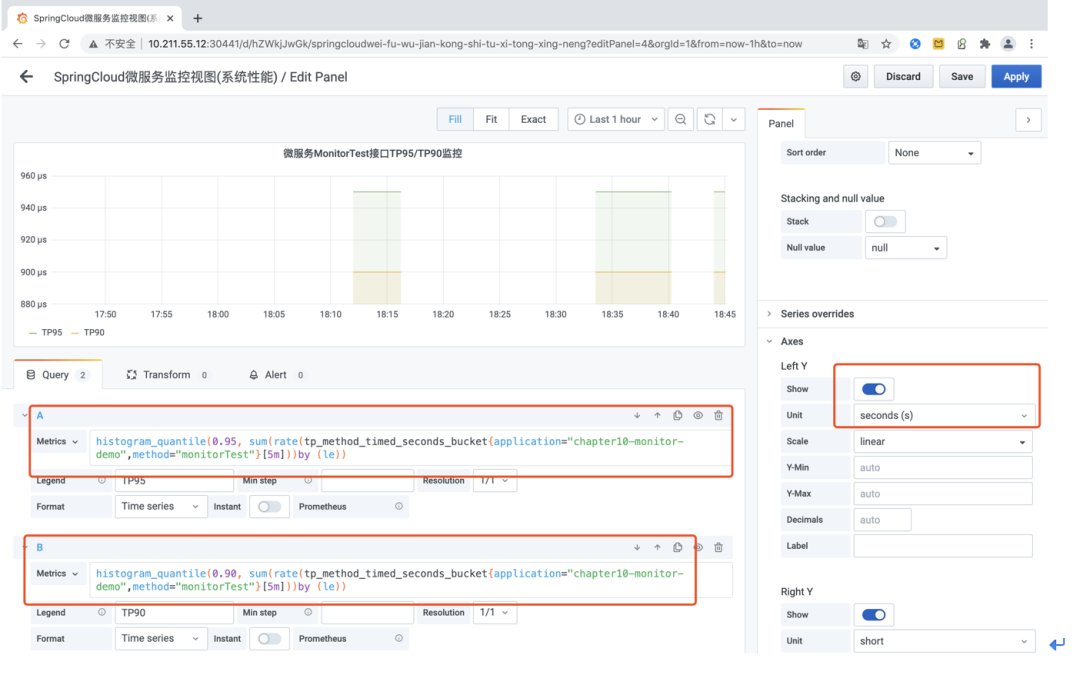
如上所示,在Grafana中可以同時(shí)定義多個(gè)PromeQL來定于不同的監(jiān)控指標(biāo)信息,這里我們分別通過Prometheus所提供的“histogram_quantile”函數(shù)統(tǒng)計(jì)了接口方法“monitorTest”的TP90及TP95分位值!而所使用的指標(biāo)就是自定義的“tp_method_timed_xx”指標(biāo)類型!
后記
以上就是我最近在工作中封裝的一組關(guān)于Prometheus自定義監(jiān)控指標(biāo)的SDK代碼,在實(shí)際工作中可以將其封住為Spring Boot Starter依賴的形式,從而更好地被Spring Boot項(xiàng)目集成!至此我已經(jīng)毫無保留的將最近兩天的工作成果分享給大家了,也希望各位老鐵可以多多點(diǎn)贊支持,多多轉(zhuǎn)發(fā)傳播!
—————END—————
推薦閱讀
干貨|如何步入Service Mesh微服務(wù)架構(gòu)時(shí)代