Prometheus 監(jiān)控體系
1 概述
1.1 主要功能
多維 數(shù)據(jù)模型(時(shí)序由 metric 名字和 k/v 的 labels 構(gòu)成)。
靈活的查詢語(yǔ)句(PromQL)。
無(wú)依賴存儲(chǔ),支持 local 和 remote 不同模型。
采用 http 協(xié)議,使用 pull 模式,拉取數(shù)據(jù),簡(jiǎn)單易懂。
監(jiān)控目標(biāo),可以采用服務(wù)發(fā)現(xiàn)或靜態(tài)配置的方式。
支持多種統(tǒng)計(jì)數(shù)據(jù)模型,圖形化友好。
1.2 核心組件
Prometheus Server, 主要用于抓取數(shù)據(jù)和存儲(chǔ)時(shí)序數(shù)據(jù),另外還提供查詢和 Alert Rule 配置管理。
client libraries,用于對(duì)接 Prometheus Server, 可以查詢和上報(bào)數(shù)據(jù)。
push gateway ,用于批量,短期的監(jiān)控?cái)?shù)據(jù)的匯總節(jié)點(diǎn),主要用于業(yè)務(wù)數(shù)據(jù)匯報(bào)等。
各種匯報(bào)數(shù)據(jù)的 exporters ,例如匯報(bào)機(jī)器數(shù)據(jù)的 node_exporter, 匯報(bào) MongoDB 信息的 MongoDB exporter 等等。
用于告警通知管理的 alertmanager 。
1.3 基礎(chǔ)架構(gòu)
一圖勝千言,先來(lái)張官方的架構(gòu)圖
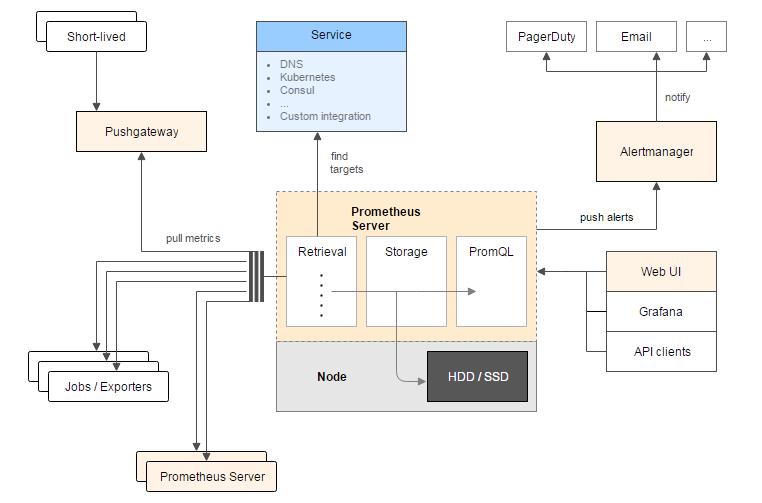
從這個(gè)架構(gòu)圖,也可以看出 Prometheus 的主要模塊包含, Server, Exporters, Pushgateway, PromQL, Alertmanager, WebUI 等。
它大致使用邏輯是這樣:
Prometheus server 定期從靜態(tài)配置的 targets 或者服務(wù)發(fā)現(xiàn)的 targets 拉取數(shù)據(jù)。
當(dāng)新拉取的數(shù)據(jù)大于配置內(nèi)存緩存區(qū)的時(shí)候,Prometheus 會(huì)將數(shù)據(jù)持久化到磁盤(如果使用 remote storage 將持久化到云端)。
Prometheus 可以配置 rules,然后定時(shí)查詢數(shù)據(jù),當(dāng)條件觸發(fā)的時(shí)候,會(huì)將 alert 推送到配置的 Alertmanager。
Alertmanager 收到警告的時(shí)候,可以根據(jù)配置,聚合,去重,降噪,最后發(fā)送警告。
可以使用 API, Prometheus Console 或者 Grafana 查詢和聚合數(shù)據(jù)。
1.4 注意
Prometheus 的數(shù)據(jù)是基于時(shí)序的 float64 的值,如果你的數(shù)據(jù)值有更多類型,無(wú)法滿足。
Prometheus 不適合做審計(jì)計(jì)費(fèi),因?yàn)樗臄?shù)據(jù)是按一定時(shí)間采集的,關(guān)注的更多是系統(tǒng)的運(yùn)行瞬時(shí)狀態(tài)以及趨勢(shì),即使有少量數(shù)據(jù)沒(méi)有采集也能容忍,但是審計(jì)計(jì)費(fèi)需要記錄每個(gè)請(qǐng)求,并且數(shù)據(jù)長(zhǎng)期存儲(chǔ),這個(gè)和 Prometheus 無(wú)法滿足,可能需要采用專門的審計(jì)系統(tǒng)。
2 BO關(guān)注項(xiàng)
2.1 數(shù)據(jù)收集方式
使用 pull 模式,拉取數(shù)據(jù)。
2.2 數(shù)據(jù)格式
Prometheus 時(shí)序格式與 OpenTSDB 相似:
<metric name>{<label name>=<label value>, ...}
其中包含時(shí)序名字以及時(shí)序的標(biāo)簽。
2.2.1 時(shí)序 4 種類型
Prometheus 時(shí)序數(shù)據(jù)分為 Counter, Gauge, Histogram, Summary 四種類型。
2.2.1.1 Counter
Counter 表示收集的數(shù)據(jù)是按照某個(gè)趨勢(shì)(增加/減少)一直變化的,我們往往用它記錄服務(wù)請(qǐng)求總量,錯(cuò)誤總數(shù)等。
例如 Prometheus server 中 http_requests_total, 表示 Prometheus 處理的 http 請(qǐng)求總數(shù),我們可以使用 delta, 很容易得到任意區(qū)間數(shù)據(jù)的增量,這個(gè)會(huì)在 PromQL 一節(jié)中細(xì)講。
# HELP http_requests_total Total number of HTTP requests made.
# TYPE http_requests_total counter
http_requests_total{code="200",handler="alerts",method="get"} 2
http_requests_total{code="200",handler="config",method="get"} 1
http_requests_total{code="200",handler="flags",method="get"} 2
http_requests_total{code="200",handler="graph",method="get"} 6
http_requests_total{code="200",handler="label_values",method="get"} 6
http_requests_total{code="200",handler="prometheus",method="get"} 24755
http_requests_total{code="200",handler="query",method="get"} 6
http_requests_total{code="200",handler="static",method="get"} 6
http_requests_total{code="200",handler="status",method="get"} 2
http_requests_total{code="200",handler="targets",method="get"} 4
http_requests_total{code="304",handler="static",method="get"} 4
2.2.1.2 Gauge
Gauge 表示搜集的數(shù)據(jù)是一個(gè)瞬時(shí)的,與時(shí)間沒(méi)有關(guān)系,可以任意變高變低,往往可以用來(lái)記錄內(nèi)存使用率、磁盤使用率等。
例如 Prometheus server 中 go_goroutines, 表示 Prometheus 當(dāng)前 goroutines 的數(shù)量。
# HELP go_goroutines Number of goroutines that currently exist.
# TYPE go_goroutines gauge
go_goroutines 100
2.2.1.3 Histogram
Histogram 由 <basename>_bucket{le="<upper inclusive bound>"},<basename>_bucket{le="+Inf"}, <basename>_sum,<basename>_count 組成,主要用于表示一段時(shí)間范圍內(nèi)對(duì)數(shù)據(jù)進(jìn)行采樣,(通常是請(qǐng)求持續(xù)時(shí)間或響應(yīng)大小),并能夠?qū)ζ渲付▍^(qū)間以及總數(shù)進(jìn)行統(tǒng)計(jì),通常我們用它計(jì)算分位數(shù)的直方圖。
例如:
Prometheus server 中 prometheus_local_storage_series_chunks_persisted, 表示 Prometheus 中每個(gè)時(shí)序需要存儲(chǔ)的 chunks 數(shù)量,我們可以用它計(jì)算待持久化的數(shù)據(jù)的分位數(shù)。
# HELP prometheus_tsdb_compaction_chunk_range Final time range of chunks on their first compaction
# TYPE prometheus_tsdb_compaction_chunk_range histogram
prometheus_tsdb_compaction_chunk_range_bucket{le="100"} 0
prometheus_tsdb_compaction_chunk_range_bucket{le="400"} 0
prometheus_tsdb_compaction_chunk_range_bucket{le="1600"} 0
prometheus_tsdb_compaction_chunk_range_bucket{le="6400"} 0
prometheus_tsdb_compaction_chunk_range_bucket{le="25600"} 0
prometheus_tsdb_compaction_chunk_range_bucket{le="102400"} 0
prometheus_tsdb_compaction_chunk_range_bucket{le="409600"} 605
prometheus_tsdb_compaction_chunk_range_bucket{le="1.6384e+06"} 612
prometheus_tsdb_compaction_chunk_range_bucket{le="6.5536e+06"} 126358
prometheus_tsdb_compaction_chunk_range_bucket{le="2.62144e+07"} 126358
prometheus_tsdb_compaction_chunk_range_bucket{le="+Inf"} 126358
prometheus_tsdb_compaction_chunk_range_sum 2.25313627417e+11
prometheus_tsdb_compaction_chunk_range_count 126358
2.2.1.4 Summary
Summary 和 Histogram 類似,由 <basename>{quantile="<φ>"},<basename>_sum,<basename>_count 組成,主要用于表示一段時(shí)間內(nèi)數(shù)據(jù)采樣結(jié)果,(通常是請(qǐng)求持續(xù)時(shí)間或響應(yīng)大小),它直接存儲(chǔ)了 quantile 數(shù)據(jù),而不是根據(jù)統(tǒng)計(jì)區(qū)間計(jì)算出來(lái)的。
例如 Prometheus server 中 prometheus_target_interval_length_seconds。
# HELP prometheus_target_interval_length_seconds Actual intervals between scrapes.
# TYPE prometheus_target_interval_length_seconds summary
prometheus_target_interval_length_seconds{interval="15s",quantile="0.01"} 14.999987534
prometheus_target_interval_length_seconds{interval="15s",quantile="0.05"} 14.999987534
prometheus_target_interval_length_seconds{interval="15s",quantile="0.5"} 15.000020575
prometheus_target_interval_length_seconds{interval="15s",quantile="0.9"} 15.000045415
prometheus_target_interval_length_seconds{interval="15s",quantile="0.99"} 15.000050555
prometheus_target_interval_length_seconds_sum{interval="15s"} 371280.61110144516
prometheus_target_interval_length_seconds_count{interval="15s"} 24752
2.2.1.5 Histogram vs Summary
都包含 <basename>_sum,<basename>_count
Histogram 需要通過(guò) <basename>_bucket 計(jì)算 quantile, 而 Summary 直接存儲(chǔ)了 quantile 的值。
2.2.3 數(shù)據(jù)存儲(chǔ)方式
數(shù)據(jù)存在promethues自身的數(shù)據(jù)庫(kù),以數(shù)據(jù)文件的形式存儲(chǔ),有自身的查詢方式:promql;詳見(jiàn)https://songjiayang.gitbooks.io/prometheus/content/promql/summary.html
2.2.4 數(shù)據(jù)輸出方式
agent:被動(dòng)拉取;
promethues server:主動(dòng)拉取客戶端的數(shù)據(jù)。promethues將拉取到的數(shù)據(jù)存到data/目錄。(除了 promethues 前臺(tái)的PromQ查詢頁(yè)面,應(yīng)該有某種工具可以直接在命令行查詢promethues的歷史數(shù)據(jù)(暫未找到);多種導(dǎo)出工具,可以支持Prometheus存儲(chǔ)數(shù)據(jù)轉(zhuǎn)化為HAProxy、StatsD、Graphite等工具所需要的數(shù)據(jù)存儲(chǔ)格式(工具未研究過(guò))。)
2.2.5 agent部署方式
promethues未提供自動(dòng)部署agent的功能。
2.2.6 任務(wù)下發(fā)方式
agent每個(gè)周期固定采集設(shè)備的指定指標(biāo),若要自定義采集某些指標(biāo)則需要修改agent源碼。
promethues server拉取數(shù)據(jù)的任務(wù)在prometheus.yml配置。
3 promethues組件及部署
3.1 promethues server
3.1.1 部署
tar包解壓即可用
3.1.2 PROMETHEUS.YML配置舉例
global:
  scrape_interval:     15s # By default, scrape targets every 15 seconds.
  evaluation_interval: 15s # By default, scrape targets every 15 seconds.

rule_files:
  - "rules/node.rules"

scrape_configs:
  - job_name: 'prometheus'
    scrape_interval: 5s
    static_configs:
      - targets: ['localhost:9090']

  - job_name: 'node'
    scrape_interval: 8s
    static_configs:
      - targets: ['127.0.0.1:9100', '127.0.0.12:9100']

  - job_name: 'mysqld'
    static_configs:
      - targets: ['127.0.0.1:9104']
  - job_name: 'memcached'
    static_configs:
      - targets: ['127.0.0.1:9150']
3.1.3 命令
[chenrj@kfapp01 prometheus-2.0.0.linux-amd64]$ ./prometheus -h
usage: prometheus []

The Prometheus monitoring server

Flags:
-h, –help Show context-sensitive help (also try –help-long and –help-man).
3.1.4 前臺(tái)地址
http://192.168.7.40:9090/graph
默認(rèn)9090端口
3.2 grafana
http://192.168.7.40:3000
端口默認(rèn)3000,
用戶密碼:admin/admin
./grafana-server
3.3 主機(jī)節(jié)點(diǎn)
http://10.140.20.142:9100/metrics
3.4 redis節(jié)點(diǎn)
http://10.140.20.143:9121/metrics
3.5 elasticsearch節(jié)點(diǎn)
http://10.140.20.146:9108/metrics
4 數(shù)據(jù)查詢
4.1 http方式查詢promethues數(shù)據(jù)
https://prometheus.io/docs/prometheus/latest/querying/api/#querying-metadata
4.1.1 即時(shí)查詢
GET /api/v1/query
URL查詢參數(shù):
query=<string>:普羅米修斯表達(dá)查詢字符串。
time=<rfc3339 | unix_timestamp>:評(píng)估時(shí)間戳。可選的。
timeout=<duration>:評(píng)價(jià)超時(shí)。可選的。默認(rèn)為,并通過(guò)價(jià)值上限-query.timeout標(biāo)志。
若省略時(shí)間time測(cè)試,則默認(rèn)使用服務(wù)器時(shí)間
例:查詢2018-01-16T03:12:51.781這個(gè)時(shí)刻go_memstats_frees_total的值
[logstash@CP-ITSM-OMC-ZSC05 supervisor]$ curl ‘http://10.140.20.146:9090/api/v1/query?query=go_memstats_frees_total&time=2018-01-16T03:12:51.781Z‘
{“status”:”success”,”data”:{“resultType”:”vector”,”result”:[{“metric”:{“name“:”go_memstats_frees_total”,”instance”:”10.140.20.142:9100”,”job”:”node”},”value”:[1516072371.781,”5599415948”]},{“metric”:{“name“:”go_memstats_frees_total”,”instance”:”10.140.20.143:9100”,”job”:”node”},”value”:[1516072371.781,”5152870637”]},{“metric”:{“name“:”go_memstats_frees_total”,”instance”:”10.140.20.143:9108”,”job”:”elasticsearch_exporter”},”value”:[1516072371.781,”1385642849”]},{“metric”:{“name“:”go_memstats_frees_total”,”instance”:”10.140.20.143:9121”,”job”:”redis_exporter_143”},”value”:[1516072371.781,”159639669”]},{“metric”:{“name“:”go_memstats_frees_total”,”instance”:”10.140.20.144:9100”,”job”:”node”},”value”:[1516072371.781,”5167404030”]},{“metric”:{“name“:”go_memstats_frees_total”,”instance”:”10.140.20.144:9108”,”job”:”elasticsearch_exporter”},”value”:[1516072371.781,”1383957758”]},{“metric”:{“name“:”go_memstats_frees_total”,”instance”:”10.140.20.144:9121”,”job”:”redis_exporter_144”},”value”:[1516072371.781,”373190465”]},{“metric”:{“name“:”go_memstats_frees_total”,”instance”:”10.140.20.145:9100”,”job”:”node”},”value”:[1516072371.781,”5124941908”]},{“metric”:{“name“:”go_memstats_frees_total”,”instance”:”10.140.20.145:9108”,”job”:”elasticsearch_exporter”},”value”:[1516072371.781,”1370943258”]},{“metric”:{“name“:”go_memstats_frees_total”,”instance”:”10.140.20.146:9100”,”job”:”node”},”value”:[1516072371.781,”4850755799”]},{“metric”:{“name“:”go_memstats_frees_total”,”instance”:”10.140.20.146:9108”,”job”:”elasticsearch_exporter”},”value”:[1516072371.781,”1370683906”]},{“metric”:{“name“:”go_memstats_frees_total”,”instance”:”localhost:9090”,”job”:”prometheus”},”value”:[1516072371.781,”2299674805”]}]}}
注:”value”:[時(shí)間戳,”對(duì)應(yīng)值”]
4.1.2 范圍查詢
GET /api/v1/query_range
URL查詢參數(shù):
query=<string>:普羅米修斯表達(dá)查詢字符串。
start=<rfc3339 | unix_timestamp>:開(kāi)始時(shí)間戳。
end=<rfc3339 | unix_timestamp>:結(jié)束時(shí)間戳。
step=<duration>:查詢分辨率步的寬度。
timeout=<duration>:評(píng)價(jià)超時(shí)。可選的。默認(rèn)為,并通過(guò)價(jià)值上限-query.timeout標(biāo)志。
例:時(shí)間在2018-01-01T20:10:30.781到2018-01-01T20:11:00.781范圍內(nèi),間隔15秒,up的數(shù)據(jù)
[logstash@CP-ITSM-OMC-ZSC05 supervisor]$ curl ‘http://10.140.20.146:9090/api/v1/query_range?query=up&start=2018-01-01T20:10:30.781Z&end=2018-01-01T20:11:00.781Z&step=15s‘
{“status”:”success”,”data”:{“resultType”:”matrix”,”result”:[{“metric”:{“name“:”up”,”instance”:”localhost:9090”,”job”:”prometheus”},”values”:[[1514837430.781,”1”],[1514837445.781,”1”],[1514837460.781,”1”]]},{“metric”:{“name“:”up”,”instance”:”localhost:9100”,”job”:”node”},”values”:[[1514837430.781,”0”],[1514837445.781,”0”],[1514837460.781,”0”]]}]}}
4.2 http查詢方式作用未知系列??
QUERYING METADATA
Finding series by label matchers
The following endpoint returns the list of time series that match a certain label set.
GET /api/v1/series
URL query parameters:
match[]=<series_selector>: Repeated series selector argument that selects the series to return. At least one match[] argument must be provided.
start=<rfc3339 | unix_timestamp>: Start timestamp.
end=<rfc3339 | unix_timestamp>: End timestamp.
The data section of the query result consists of a list of objects that contain the label name/value pairs which identify each series.
The following example returns all series that match either of the selectors up or process_start_time_seconds{job="prometheus"}:
$ curl -g 'http://localhost:9090/api/v1/series?match[]=up&match[]=process_start_time_seconds{job="prometheus"}'
{
   "status" : "success",
   "data" : [
      {
         "__name__" : "up",
         "job" : "prometheus",
         "instance" : "localhost:9090"
      },
      {
         "__name__" : "up",
         "job" : "node",
         "instance" : "localhost:9091"
      },
      {
         "__name__" : "process_start_time_seconds",
         "job" : "prometheus",
         "instance" : "localhost:9090"
      }
   ]
}
Querying label values
The following endpoint returns a list of label values for a provided label name:
GET /api/v1/label/<label_name>/values
The data section of the JSON response is a list of string label names.
This example queries for all label values for the job label:
$ curl http://localhost:9090/api/v1/label/job/values
{
   "status" : "success",
   "data" : [
      "node",
      "prometheus"
   ]
}
EXPRESSION QUERY RESULT FORMATS
Expression queries may return the following response values in the result property of the data section. <sample_value> placeholders are numeric sample values. JSON does not support special float values such as NaN, Inf, and -Inf, so sample values are transferred as quoted JSON strings rather than raw numbers.
Range vectors
Range vectors are returned as result type matrix. The corresponding result property has the following format:
[
  {
    "metric": { "<label_name>": "<label_value>", ... },
    "values": [ [ <unix_time>, "<sample_value>" ], ... ]
  },
  ...
]
Instant vectors
Instant vectors are returned as result type vector. The corresponding result property has the following format:
[
  {
    "metric": { "<label_name>": "<label_value>", ... },
    "value": [ <unix_time>, "<sample_value>" ]
  },
  ...
]
Scalars
Scalar results are returned as result type scalar. The corresponding result property has the following format:
[ <unix_time>, "<scalar_value>" ]
Strings
String results are returned as result type string. The corresponding result property has the following format:
[ <unix_time>, "<string_value>" ]
TARGETS
This API is experimental as it is intended to be extended with targets dropped due to relabelling in the future.
The following endpoint returns an overview of the current state of the Prometheus target discovery:
GET /api/v1/targets
Currently only the active targets are part of the response.
$ curl http://localhost:9090/api/v1/targets
{
  "status": "success",                                                                                                                                [3/11]
  "data": {
    "activeTargets": [
      {
        "discoveredLabels": {
          "__address__": "127.0.0.1:9090",
          "__metrics_path__": "/metrics",
          "__scheme__": "http",
          "job": "prometheus"
        },
        "labels": {
          "instance": "127.0.0.1:9090",
          "job": "prometheus"
        },
        "scrapeUrl": "http://127.0.0.1:9090/metrics",
        "lastError": "",
        "lastScrape": "2017-01-17T15:07:44.723715405+01:00",
        "health": "up"
      }
    ]
  }
}
ALERTMANAGERS
This API is experimental as it is intended to be extended with Alertmanagers dropped due to relabelling in the future.
The following endpoint returns an overview of the current state of the Prometheus alertmanager discovery:
GET /api/v1/alertmanagers
Currently only the active Alertmanagers are part of the response.
$ curl http://localhost:9090/api/v1/alertmanagers
{
  "status": "success",
  "data": {
    "activeAlertmanagers": [
      {
        "url": "http://127.0.0.1:9090/api/v1/alerts"
      }
    ]
  }
}
查詢指標(biāo)標(biāo)簽:curl -g ‘http://192.168.7.40:9090/api/v1/series?match[]=up&match[]=process_start_time_seconds{job="prometheus"}‘
查詢標(biāo)簽 {“status”:”success”,”data”:[]}[logstash@CP-ITSM-OMC-ZSC05 supervisor]$ curl http://10.140.20.146:9090/api/v1/label/job/values
{“status”:”success”,”data”:[“elasticsearch_exporter”,”node”,”prometheus”,”redis_exporter”,”redis_exporter_143”,”redis_exporter_144”]}
4.3 查詢節(jié)點(diǎn)數(shù)據(jù)
查詢節(jié)點(diǎn)exporter的所有數(shù)據(jù):curl -s http://192.168.7.40:9100/metrics
5 exporter格式
基于協(xié)議緩沖區(qū)格式 和 文本格式
客戶端可以暴露promethues無(wú)法解析的其他格式
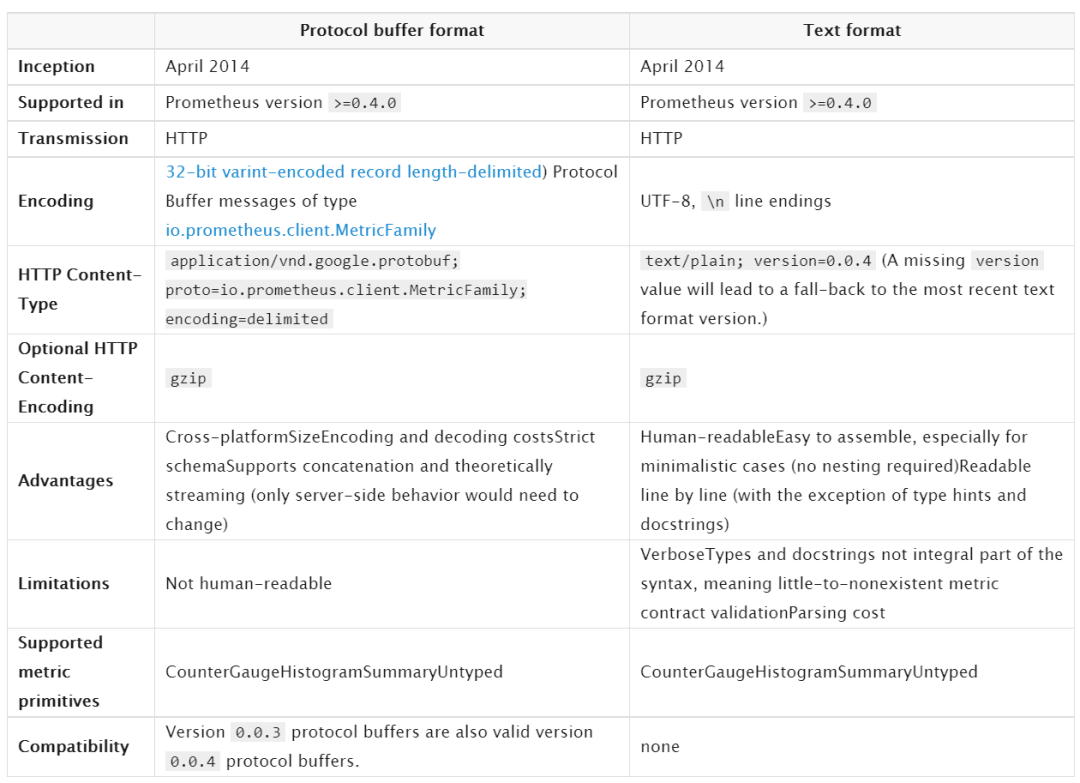
5.1 基于協(xié)議緩沖區(qū)格式 和 文本格式 的區(qū)別
5.2 基于協(xié)議緩沖區(qū)格式
Reproducible sorting of the protocol buffer fields in repeated expositions is preferred but not required, i.e. do not sort if the computational cost is prohibitive.
Each MetricFamily within the same exposition must have a unique name. Each Metric within the same MetricFamily must have a unique set of LabelPair fields. Otherwise, the ingestion behavior is undefined.
5.3 文本類型格式
#打頭的是注釋行(除非#之后的第一個(gè)標(biāo)記是HELP或TYPE)。
HELP行:可能包含任何UTF-8字符序列(在指標(biāo)名稱之后),但反斜杠和換行字符必須分別轉(zhuǎn)義為\和\ n。對(duì)于相同的指標(biāo)名稱,只能有一條HELP行,一個(gè)指標(biāo)只能有一個(gè)HELP行。
TYPE行:TPYE后的第一個(gè)參數(shù)是指標(biāo)名,第二個(gè)參數(shù)是數(shù)據(jù)類型(可以是counter, gauge, histogram, summary, untyped)。相同的指標(biāo)名稱,只能有一個(gè)TYPE行。如果指標(biāo)名稱沒(méi)有TYPE行,則該類型設(shè)置為無(wú)類型。
格式:
metric_name [
  "{" label_name "=" `"` label_value `"` { "," label_name "=" `"` label_value `"` } [ "," ] "}"
] value [ timestamp ]
label_value可以是任何UTF-8格式的內(nèi)容,但反斜杠、雙引號(hào)、換行符 必須轉(zhuǎn)義成
\\ \" \\n
histogram(直方圖) summary(匯總)類型的特別格式:
需要單獨(dú)一行xxx_sum;
需要單獨(dú)一行xxx_count;
Each quantile of a summary named x is given as a separate sample line with the same name x and a label {quantile=”y”};
A histogram must have a bucket with {le=”+Inf”}. Its value must be identical to the value of x_count;
histogram類型必須要有{le=”+Inf”},并且值要和xxx_count一致;
5.4 文本類型格式舉例
# HELP http_requests_total The total number of HTTP requests.
# TYPE http_requests_total counter
http_requests_total{method="post",code="200"} 1027 1395066363000
http_requests_total{method="post",code="400"}    3 1395066363000

# Escaping in label values:
msdos_file_access_time_seconds{path="C:\\DIR\\FILE.TXT",error="Cannot find file:\n\"FILE.TXT\""} 1.458255915e9

# Minimalistic line:
metric_without_timestamp_and_labels 12.47

# A weird metric from before the epoch:
something_weird{problem="division by zero"} +Inf -3982045

# A histogram, which has a pretty complex representation in the text format:
# HELP http_request_duration_seconds A histogram of the request duration.
# TYPE http_request_duration_seconds histogram
http_request_duration_seconds_bucket{le="0.05"} 24054
http_request_duration_seconds_bucket{le="0.1"} 33444
http_request_duration_seconds_bucket{le="0.2"} 100392
http_request_duration_seconds_bucket{le="0.5"} 129389
http_request_duration_seconds_bucket{le="1"} 133988
http_request_duration_seconds_bucket{le="+Inf"} 144320
http_request_duration_seconds_sum 53423
http_request_duration_seconds_count 144320

# Finally a summary, which has a complex representation, too:
# HELP rpc_duration_seconds A summary of the RPC duration in seconds.
# TYPE rpc_duration_seconds summary
rpc_duration_seconds{quantile="0.01"} 3102
rpc_duration_seconds{quantile="0.05"} 3272
rpc_duration_seconds{quantile="0.5"} 4773
rpc_duration_seconds{quantile="0.9"} 9001
rpc_duration_seconds{quantile="0.99"} 76656
rpc_duration_seconds_sum 1.7560473e+07
rpc_duration_seconds_count 2693
6 導(dǎo)出器exporter
6.1 概述
指標(biāo)名,一般為導(dǎo)出程序名稱作為前綴,例如, haproxy_up;
度量標(biāo)準(zhǔn)必須使用基本單位(例如秒,字節(jié)),并保留將其轉(zhuǎn)換為更具可讀性的圖形工具;
指標(biāo)有效字符:`[a-zA-Z0-9:_]` ,其他任何字符都要用下劃線_代替;
指標(biāo)后綴_sum, _count, _bucket and _total 只可用在Summaries、 Histograms 、 Counters
7 告警alertmanager程序
概述:
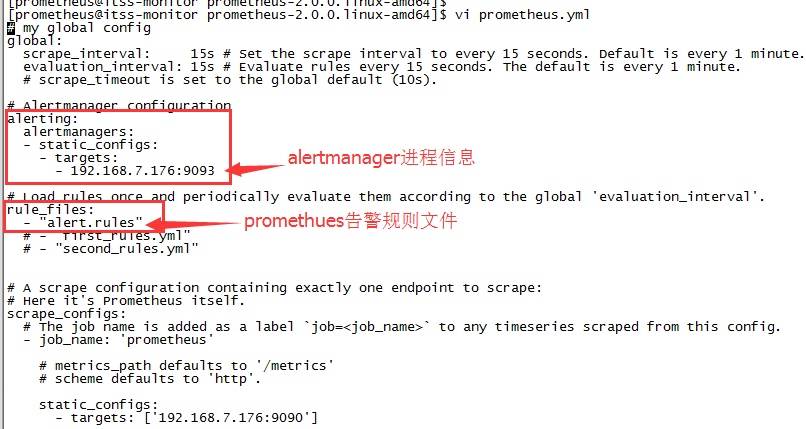
promethues:根據(jù)配置文件prometheus.yml的rule_files告警規(guī)則,將告警信息存到promethues的磁盤,供promethues的前臺(tái)頁(yè)面查看;根據(jù)配置文件prometheus.yml的alerting(配置altermanager進(jìn)程的ip 端口信息),將告警信息發(fā)送altermanager進(jìn)程上。
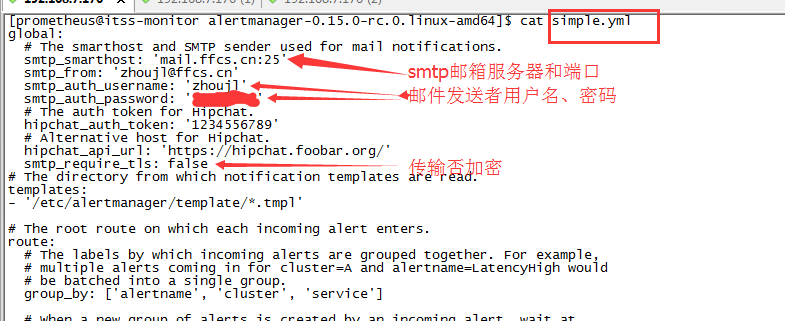
altermanager:接收promethues發(fā)來(lái)的告警信息,存在磁盤中供altermanager進(jìn)程的前臺(tái)查看;同時(shí)根據(jù)altermanager的告警配置文件simple.yml發(fā)送郵件等提醒。
7.1 promethues告警配置舉例
7.2 promethues告警規(guī)則配置文件舉例
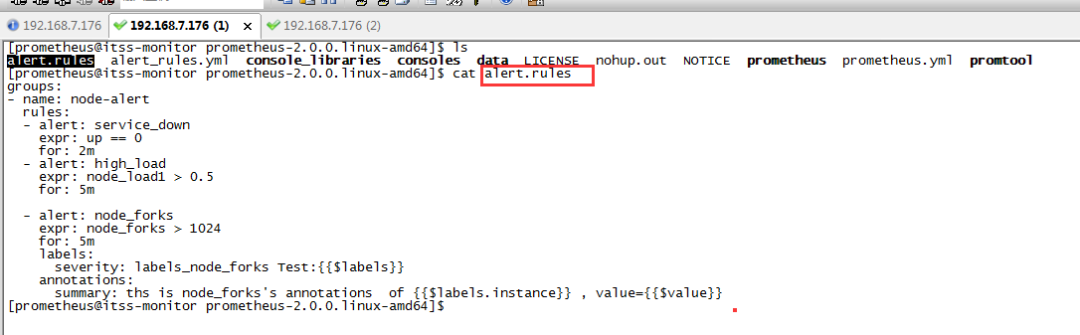
alert:自定義的告警含義簡(jiǎn)寫
expor:告警條件,如上圖的node_forks為具體mertics里的指標(biāo)
for:周期
labels:severity,在alertmanager前臺(tái)頁(yè)面可以根據(jù)severity條件來(lái)查詢告警信息
annotations:summary寫些較詳細(xì)的告警信息
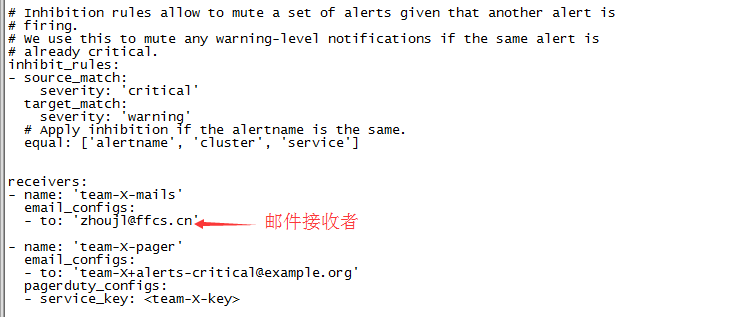
7.3 alertmanager告警發(fā)送郵件提示
7.4 啟動(dòng)alertmanager
nohup ./alertmanager –config.file=simple.yml &
alertmanager前臺(tái):http://192.168.7.176:9093/
7.5通過(guò)其他方式告警
HIPCHAT_CONFIG: 是一款能夠在蘋果mac平臺(tái)上運(yùn)行的社交聊天軟件,HipChat的功能和QQ相似,集聊天、視頻、語(yǔ)音等功能于一身,不同之處在于HipChat界面更加的簡(jiǎn)潔、操作更加的流暢。
PAGERDUTY_CONFIG:是一款能夠在服務(wù)器出問(wèn)題時(shí)發(fā)送提醒的軟件。在發(fā)生問(wèn)題時(shí),提醒的方式包括屏幕顯示、電話呼叫、短信通知、電郵通知等,而且在無(wú)人應(yīng)答時(shí)還會(huì)自動(dòng)將提醒級(jí)別提高。PagerDuty 不是免費(fèi)的。
PUSHOVER_CONFIG:是一款網(wǎng)絡(luò)通知推送服務(wù),類似ifttt或腳本服務(wù),你可以將需要推送的服務(wù)設(shè)置好后,遇到情況將把通知自動(dòng)推送到你的安卓手機(jī)。
SLACK_CONFIG:slack是聊天群組 + 大規(guī)模工具集成 + 文件整合 + 統(tǒng)一搜索。截至2014年底,Slack 已經(jīng)整合了電子郵件、短信、Google Drives、Twitter、Trello、Asana、GitHub 等 65 種工具和服務(wù),可以把各種碎片化的企業(yè)溝通和協(xié)作集中到一起。
# Whether or not to notify about resolved alerts.
[ send_resolved: <boolean> | default = false ]

# The Slack webhook URL.
[ api_url: <secret> | default = global.slack_api_url ]

# The channel or user to send notifications to.
channel: <tmpl_string>

# API request data as defined by the Slack webhook API.
[ color: <tmpl_string> | default = '{{ if eq .Status "firing" }}danger{{ else }}good{{ end }}' ]
[ username: <tmpl_string> | default = '{{ template "slack.default.username" . }}' ]
[ title: <tmpl_string> | default = '{{ template "slack.default.title" . }}' ]
[ title_link: <tmpl_string> | default = '{{ template "slack.default.titlelink" . }}' ]
[ icon_emoji: <tmpl_string> ]
[ icon_url: <tmpl_string> ]
[ pretext: <tmpl_string> | default = '{{ template "slack.default.pretext" . }}' ]
[ text: <tmpl_string> | default = '{{ template "slack.default.text" . }}' ]
[ fallback: <tmpl_string> | default = '{{ template "slack.default.fallback" . }}' ]

# The HTTP client's configuration.
[ http_config: <http_config> | default = global.http_config ]
OPSGENIE_CONFIG :集成電話短信郵件等等
VICTOROPS_CONFIG:聊天應(yīng)用
HTTP_CONFIG:A http_config allows configuring the HTTP client that the receiver uses to communicate with HTTP-based API services.
8 問(wèn)題筆記
8.1已解決
prometheus瀏覽器查詢不到exporter指標(biāo)數(shù)據(jù),但是瀏覽器exporter的mertic有指標(biāo)數(shù)據(jù)。原因是時(shí)間不同步
來(lái)源:http://zhoujinl.github.io/2018/03/25/prometheus/
推薦閱讀
Prometheus 如何做到“活學(xué)活用”,大牛總結(jié)的避坑指南
GitHub 熱榜:適合初學(xué)者學(xué)習(xí)的 Prometheus 監(jiān)控系統(tǒng)
性能監(jiān)控工具之 Grafana + Prometheus + Exporters
Docker環(huán)境部署Prometheus+Grafana監(jiān)控系統(tǒng)