
使用 Prometheus 監(jiān)控 Harbor
 你好!我是李大白,今天分享的是基于Prometheus監(jiān)控harbor服務(wù)。
在之前的文章中分別介紹了harbor基于離線安裝的高可用汲取設(shè)計(jì)和部署。那么,如果我們的harbor服務(wù)主機(jī)或者h(yuǎn)arbor服務(wù)及組件出現(xiàn)異常,我們?cè)撊绾慰焖偬幚砟兀?/p>
Harbor v2.2及以上版本支持配置Prometheus監(jiān)控Harbor,所以你的harbor版本必須要大于2.2。
本篇文章以二進(jìn)制的方式簡(jiǎn)單的部署Prometheus相關(guān)服務(wù),可以幫助你快速的的實(shí)現(xiàn)Prometheus對(duì)harbor的監(jiān)控。
Prometheus監(jiān)控Harbor(二進(jìn)制版)
一、部署說(shuō)明
在harbor服務(wù)主機(jī)上部署:
prometheus node-exporter grafana alertmanager
harbor版本:2.4.2
主機(jī):192.168.2.22
二、Harbor啟用metrics服務(wù)
2.1 停止Harbor服務(wù)
$ cd /app/harbor
$ docker-compose  down
2.2 修改harbor.yml配置
修改harbor的配置文件中metrics參數(shù),啟用harbor-exporter組件。
$ cat harbor.yml
### metrics配置部分
metric:
  enabled: true     #是否啟用,需要修改為true(啟用)
  port: 9099       #默認(rèn)的端口為9090,與prometheus的端口會(huì)沖突(所以需要修改下)
  path: /metrics
對(duì)harbor不熟悉的建議對(duì)配置文件備份下!
2.3 配置注入組件
$ ./prepre
2.4 install安裝harbor
$ ./install.sh  --with-notary  --with-trivy  --with-chartmuseum
$ docker-compose ps
NAME          COMMAND             SERVICE       STATUS            PORTS
chartmuseum     "./docker-entrypoint…"   chartmuseum    running (healthy)
harbor-core     "/harbor/entrypoint.…"   core         running (healthy)
harbor-db      "/docker-entrypoint.…"   postgresql     running (healthy)
harbor-exporter  "/harbor/entrypoint.…"   exporter      running
可以看到多了harbor-exporter組件。
三、Harbor指標(biāo)說(shuō)明
在前面啟用了harbor-exporter監(jiān)控組件后,可以通過(guò)curl命令去查看harbor暴露了哪些指標(biāo)。
harbor暴露了以下4個(gè)關(guān)鍵組件的指標(biāo)數(shù)據(jù)。
3.1 harbor-exporter組件指標(biāo)
exporter組件指標(biāo)與Harbor 實(shí)例配置相關(guān),并從 Harbor 數(shù)據(jù)庫(kù)中收集一些數(shù)據(jù)。指標(biāo)可在
<harbor_instance>:<metrics_port>/<metrics_path>查看
$ curl http://192.168.2.22:9099/metrics
1)harbor_project_total
harbor_project_total 采集了公共和私人項(xiàng)目總共數(shù)量。
$ curl  http://192.168.2.22:9099/metrics | grep harbor_project_total
# HELP harbor_project_total Total projects number
# TYPE harbor_project_total gauge
harbor_project_total{public="true"} 1   # 公共項(xiàng)目的數(shù)量為“1”
harbor_project_total{public="false"} 1     #私有項(xiàng)目的數(shù)量
2)harbor_project_repo_total
項(xiàng)目(Project)中的存儲(chǔ)庫(kù)總數(shù)。
$ curl  http://192.168.2.22:9099/metrics | grep harbor_project_repo_total
# HELP harbor_project_repo_total Total project repos number
# TYPE harbor_project_repo_total gauge
harbor_project_repo_total{project_name="library",public="true"} 0
3)harbor_project_member_total
項(xiàng)目中的成員總數(shù)
$ curl  http://192.168.2.22:9099/metrics | grep harbor_project_member_total
# HELP harbor_project_member_total Total members number of a project
# TYPE harbor_project_member_total gauge
harbor_project_member_total{project_name="library"} 1  #項(xiàng)目library下有“1”個(gè)用戶
4)harbor_project_quota_usage_byte
一個(gè)項(xiàng)目的總使用資源
$ curl  http://192.168.2.22:9099/metrics | grep harbor_project_quota_usage_byte
# HELP harbor_project_quota_usage_byte The used resource of a project
# TYPE harbor_project_quota_usage_byte gauge
harbor_project_quota_usage_byte{project_name="library"} 0
5)harbor_project_quota_byte
項(xiàng)目中設(shè)置的配額
$ curl  http://192.168.2.22:9099/metrics | grep harbor_project_quota_byte
# HELP harbor_project_quota_byte The quota of a project
# TYPE harbor_project_quota_byte gauge
harbor_project_quota_byte{project_name="library"} -1   #-1 表示不限制
6)harbor_artifact_pulled
項(xiàng)目中鏡像拉取的總數(shù)
$ curl  http://192.168.2.22:9099/metrics | grep harbor_artifact_pulled
# HELP harbor_artifact_pulled The pull number of an artifact
# TYPE harbor_artifact_pulled gauge
harbor_artifact_pulled{project_name="library"} 0
7)harbor_project_artifact_total
項(xiàng)目中的工件類型總數(shù),artifact_type , project_name, public ( true, false)
$ curl http://192.168.2.22:9099/metrics | grep harbor_project_artifact_total
8)harbor_health
Harbor狀態(tài)$ curl http://192.168.2.22:9099/metrics | grep harbor_health
# HELP harbor_health Running status of Harbor
# TYPE harbor_health gauge
harbor_health 1 #1表示正常,0表示異常
9)harbor_system_info
Harbor 實(shí)例的信息,auth_mode ( db_auth, ldap_auth, uaa_auth, http_auth, oidc_auth),harbor_version, self_registration( true, false)
$ curl  http://192.168.2.22:9099/metrics | grep harbor_system_info
# HELP harbor_system_info Information of Harbor system
# TYPE harbor_system_info gauge
harbor_system_info{auth_mode="db_auth",harbor_version="v2.4.2-ef2e2e56",self_registration="false"} 1
10)harbor_up
Harbor組件運(yùn)行狀態(tài),組件 ( chartmuseum, core, database, jobservice, portal, redis, registry, registryctl, trivy)
$ curl  http://192.168.2.22:9099/metrics | grep harbor_up
harbor_up Running status of harbor component
# TYPE harbor_up gauge
harbor_up{component="chartmuseum"} 1
harbor_up{component="core"} 1
harbor_up{component="database"} 1
harbor_up{component="jobservice"} 1
harbor_up{component="portal"} 1
harbor_up{component="redis"} 1
harbor_up{component="registry"} 1
harbor_up{component="registryctl"} 1
harbor_up{component="trivy"} 1   #Trivy掃描器運(yùn)行狀態(tài)
11)harbor_task_queue_size
隊(duì)列中每種類型的任務(wù)總數(shù),
$ curl  http://192.168.2.22:9099/metrics | grep harbor_task_queue_size
# HELP harbor_task_queue_size Total number of tasks
# TYPE harbor_task_queue_size gauge
harbor_task_queue_size{type="DEMO"} 0
harbor_task_queue_size{type="GARBAGE_COLLECTION"} 0
harbor_task_queue_size{type="IMAGE_GC"} 0
harbor_task_queue_size{type="IMAGE_REPLICATE"} 0
harbor_task_queue_size{type="IMAGE_SCAN"} 0
harbor_task_queue_size{type="IMAGE_SCAN_ALL"} 0
harbor_task_queue_size{type="P2P_PREHEAT"} 0
harbor_task_queue_size{type="REPLICATION"} 0
harbor_task_queue_size{type="RETENTION"} 0
harbor_task_queue_size{type="SCHEDULER"} 0
harbor_task_queue_size{type="SLACK"} 0
harbor_task_queue_size{type="WEBHOOK"} 0
12)harbor_task_queue_latency
多久前要處理的下一個(gè)作業(yè)按類型排入隊(duì)列
$ curl  http://192.168.2.22:9099/metrics | grep harbor_task_queue_latency
# HELP harbor_task_queue_latency how long ago the next job to be processed was enqueued
# TYPE harbor_task_queue_latency gauge
harbor_task_queue_latency{type="DEMO"} 0
harbor_task_queue_latency{type="GARBAGE_COLLECTION"} 0
harbor_task_queue_latency{type="IMAGE_GC"} 0
harbor_task_queue_latency{type="IMAGE_REPLICATE"} 0
harbor_task_queue_latency{type="IMAGE_SCAN"} 0
harbor_task_queue_latency{type="IMAGE_SCAN_ALL"} 0
harbor_task_queue_latency{type="P2P_PREHEAT"} 0
harbor_task_queue_latency{type="REPLICATION"} 0
harbor_task_queue_latency{type="RETENTION"} 0
harbor_task_queue_latency{type="SCHEDULER"} 0
harbor_task_queue_latency{type="SLACK"} 0
harbor_task_queue_latency{type="WEBHOOK"} 0
13)harbor_task_scheduled_total
計(jì)劃任務(wù)數(shù)
$ curl  http://192.168.2.22:9099/metrics | grep harbor_task_scheduled_total
# HELP harbor_task_scheduled_total total number of scheduled job
# TYPE harbor_task_scheduled_total gauge
harbor_task_scheduled_total 0
14)harbor_task_concurrency
池(Total)上每種類型的并發(fā)任務(wù)總數(shù)
$ curl  http://192.168.2.22:9099/metrics | grep harbor_task_concurrency
harbor_task_concurrency{pool="d4053262b74f0a7b83bc6add",type="GARBAGE_COLLECTION"} 0
3.2 harbor-core組件指標(biāo)
以下是從 Harbor core組件中提取的指標(biāo),獲取格式:
<harbor_instance>:<metrics_port>/<metrics_path>?comp=core.
1)harbor_core_http_inflight_requests
請(qǐng)求總數(shù),操作(Harbor API operationId中的值。一些遺留端點(diǎn)沒(méi)有,因此標(biāo)簽值為)operationId``unknown
harbor-core組件的指標(biāo)
$ curl  http://192.168.2.22:9099/metrics?comp=core |  grep harbor_core_http_inflight_requests
# HELP harbor_core_http_inflight_requests The total number of requests
# TYPE harbor_core_http_inflight_requests gauge
harbor_core_http_inflight_requests 0
2)harbor_core_http_request_duration_seconds
請(qǐng)求的持續(xù)時(shí)間,
方法 ( GET, POST, HEAD, PATCH, PUT), 操作 ( Harbor APIoperationId中的 值。一些遺留端點(diǎn)沒(méi)有, 所以標(biāo)簽值為), 分位數(shù)operationId``unknown
$ curl  http://192.168.2.22:9099/metrics?comp=core |  grep harbor_core_http_request_duration_seconds
# HELP harbor_core_http_request_duration_seconds The time duration of the requests
# TYPE harbor_core_http_request_duration_seconds summary
harbor_core_http_request_duration_seconds{method="GET",operation="GetHealth",quantile="0.5"} 0.001797115
harbor_core_http_request_duration_seconds{method="GET",operation="GetHealth",quantile="0.9"} 0.010445204
harbor_core_http_request_duration_seconds{method="GET",operation="GetHealth",quantile="0.99"} 0.010445204
3)harbor_core_http_request_total
請(qǐng)求總數(shù)
方法(GET, POST, HEAD, PATCH, PUT),操作([Harbor API operationId中的 值。一些遺留端點(diǎn)沒(méi)有,因此標(biāo)簽值為)operationId``unknown
$ curl  http://192.168.2.22:9099/metrics?comp=core |  grep harbor_core_http_request_total
# HELP harbor_core_http_request_total The total number of requests
# TYPE harbor_core_http_request_total counter
harbor_core_http_request_total{code="200",method="GET",operation="GetHealth"} 14
harbor_core_http_request_total{code="200",method="GET",operation="GetInternalconfig"} 1
harbor_core_http_request_total{code="200",method="GET",operation="GetPing"} 176
harbor_core_http_request_total{code="200",method="GET",operation="GetSystemInfo"} 14
3.3 registry 組件指標(biāo)
注冊(cè)表,以下是從 Docker 發(fā)行版中提取的指標(biāo),查看指標(biāo)方式:
<harbor_instance>:<metrics_port>/<metrics_path>?comp=registry.
1)registry_http_in_flight_requests
進(jìn)行中的 HTTP 請(qǐng)求,處理程序
$ curl  http://192.168.2.22:9099/metrics?comp=registry |  grep registry_http_in_flight_requests
# HELP registry_http_in_flight_requests The in-flight HTTP requests
# TYPE registry_http_in_flight_requests gauge
registry_http_in_flight_requests{handler="base"} 0
registry_http_in_flight_requests{handler="blob"} 0
registry_http_in_flight_requests{handler="blob_upload"} 0
registry_http_in_flight_requests{handler="blob_upload_chunk"} 0
registry_http_in_flight_requests{handler="catalog"} 0
registry_http_in_flight_requests{handler="manifest"} 0
registry_http_in_flight_requests{handler="tags"} 0
2)registry_http_request_duration_seconds
HTTP 請(qǐng)求延遲(以秒為單位),處理程序、方法( ,,,, GET) POST,文件HEADPATCHPUT
$ curl http://192.168.2.22:9099/metrics?comp=registry | grep registry_http_request_duration_seconds
3)registry_http_request_size_bytes
HTTP 請(qǐng)求大小(以字節(jié)為單位)。
$ curl http://192.168.2.22:9099/metrics?comp=registry | grep registry_http_request_size_bytes
3.4 jobservice組件指標(biāo)
以下是從 Harbor Jobservice 提取的指標(biāo),
可在<harbor_instance>:<metrics_port>/<metrics_path>?comp=jobservice.查看
1)harbor_jobservice_info
Jobservice的信息,
$ curl  http://192.168.2.22:9099/metrics?comp=jobservice | grep harbor_jobservice_info
# HELP harbor_jobservice_info the information of jobservice
# TYPE harbor_jobservice_info gauge
harbor_jobservice_info{node="f47de52e23b7:172.18.0.11",pool="35f1301b0e261d18fac7ba41",workers="10"} 1
2)harbor_jobservice_task_total
每個(gè)作業(yè)類型處理的任務(wù)數(shù)
$ curl http://192.168.2.22:9099/metrics?comp=jobservice | grep harbor_jobservice_task_tota
3)harbor_jobservice_task_process_time_seconds
任務(wù)處理時(shí)間的持續(xù)時(shí)間,即任務(wù)從開(kāi)始執(zhí)行到任務(wù)結(jié)束用了多少時(shí)間。
$ curl http://192.168.2.22:9099/metrics?comp=jobservice | grep harbor_jobservice_task_process_time_seconds
四、部署Prometheus Server(二進(jìn)制)
4.1 創(chuàng)建安裝目錄
$ mkdir /etc/prometheus
4.2 下載安裝包
$ wget https://github.com/prometheus/prometheus/releases/download/v2.36.2/prometheus-2.36.2.linux-amd64.tar.gz -c
$ tar zxvf  prometheus-2.36.2.linux-amd64.tar.gz  -C  /etc/prometheus
$ cp prometheus-2.36.2.linux-amd64/{prometheus,promtool}   /usr/local/bin/
$ prometheus  --version    #查看版本
prometheus, version 2.36.2 (branch: HEAD, revision: d7e7b8e04b5ecdc1dd153534ba376a622b72741b)
  build user:       root@f051ce0d6050
  build date:       20220620-13:21:35
  go version:       go1.18.3
  platform:         linux/amd64
4.3 修改配置文件
在prometheus的配置文件中指定獲取harbor采集的指標(biāo)數(shù)據(jù)。
$ cp  prometheus-2.36.2.linux-amd64/prometheus.yml   /etc/prometheus/
$ cat <<EOF > /etc/prometheus/prometheus.yml
global:
  scrape_interval: 15s
  evaluation_interval: 15s
## 指定Alertmanagers地址
alerting:
  alertmanagers:
  - static_configs:
    - targets: ["192.168.2.10:9093"]  #填寫(xiě)Alertmanagers地址
## 配置告警規(guī)則文件
rule_files:   #指定告警規(guī)則
  - /etc/prometheus/rules.yml

scrape_configs:
  - job_name: "prometheus"
    static_configs:
      - targets: ["localhost:9090"]
  - job_name: 'node-exporter'
    static_configs:
    - targets:
      - '192.168.2.22:9100'
  - job_name: "harbor-exporter"
    scrape_interval: 20s
    static_configs:
      - targets: ['192.168.2.22:9099']
  - job_name: 'harbor-core'
    params:
      comp: ['core']
    static_configs:
     - targets: ['192.168.2.22:9099']
  - job_name: 'harbor-registry'
    params:
      comp: ['registry']
    static_configs:
    - targets: ['192.168.2.22:9099']
  - job_name: 'harbor-jobservice'
    params:
      comp: ['jobservice']
    static_configs:
    - targets: ['192.168.2.22:9099']
EOF
4.4 語(yǔ)法檢查
檢測(cè)配置文件的語(yǔ)法是否正確!
$ promtool check config  /etc/prometheus/prometheus.yml
Checking /etc/prometheus/prometheus.yml
 SUCCESS: /etc/prometheus/prometheus.yml is valid prometheus config file syntax

 Checking /etc/prometheus/rules.yml
  SUCCESS: 6 rules found
4.5 創(chuàng)建服務(wù)啟動(dòng)文件
$ cat <<EOF >  /usr/lib/systemd/system/prometheus.service
[Unit]
Description=Prometheus Service
Documentation=https://prometheus.io/docs/introduction/overview/
wants=network-online.target
After=network-online.target

[Service]
Type=simple
User=root
Group=root
ExecStart=/usr/local/bin/prometheus  --config.file=/etc/prometheus/prometheus.yml

[Install]
WantedBy=multi-user.target
EOF
4.6 啟動(dòng)服務(wù)
$ systemctl daemon-reload
$ systemctl enable --now prometheus.service
$ systemctl status prometheus.service
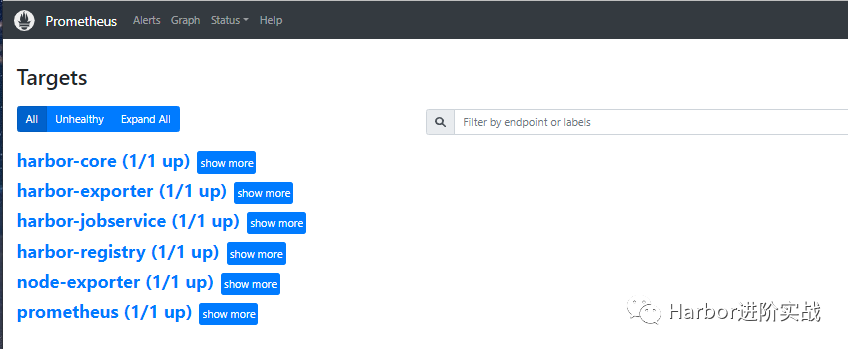
4.7 瀏覽器訪問(wèn)Prometheus UI
在瀏覽器地址欄輸入主機(jī)IP:9090訪問(wèn)Prometheus UI 管理界面。
五、部署node-exporter
node-exporter服務(wù)可采集主機(jī)的cpu、內(nèi)存、磁盤(pán)等資源指標(biāo)。
5.1 下載安裝包
$ wget https://github.com/prometheus/node_exporter/releases/download/v1.2.2/node_exporter-1.2.2.linux-amd64.tar.gz
$ tar zxvf node_exporter-1.2.2.linux-amd64.tar.gz
$ cp node_exporter-1.2.2.linux-amd64/node_exporter   /usr/local/bin/
$ node_exporter  --version
node_exporter, version 1.2.2 (branch: HEAD, revision: 26645363b486e12be40af7ce4fc91e731a33104e)
  build user:       root@b9cb4aa2eb17
  build date:       20210806-13:44:18
  go version:       go1.16.7
  platform:         linux/amd64
5.2 創(chuàng)建服務(wù)啟動(dòng)文件
$ cat <<EOF >  /usr/lib/systemd/system/node-exporter.service
[Unit]
Description=Prometheus Node Exporter
After=network.target

[Service]
ExecStart=/usr/local/bin/node_exporter
#User=prometheus

[Install]
WantedBy=multi-user.target
EOF
5.3 啟動(dòng)服務(wù)
$ systemctl daemon-reload
$ systemctl enable --now node-exporter.service
$ systemctl status node-exporter.service
$ ss  -ntulp |  grep node_exporter
tcp    LISTEN     0   128   :::9100    :::*    users:(("node_exporter",pid=36218,fd=3)
5.4 查看node指標(biāo)
通過(guò)curl獲取node-exporter服務(wù)采集到的監(jiān)控?cái)?shù)據(jù)。
$ curl http://localhost:9100/metrics
六、Grafana部署與儀表盤(pán)設(shè)計(jì)
二進(jìn)制部署Grafana v8.4.4服務(wù)。
6.1 下載安裝包
$ wget https://dl.grafana.com/enterprise/release/grafana-enterprise-8.4.4.linux-amd64.tar.gz  -c
$ tar zxvf grafana-enterprise-8.4.4.linux-amd64.tar.gz  -C  /etc/
$ mv  /etc/grafana-8.4.4   /etc/grafana
$ cp -a  /etc/grafana/bin/{grafana-cli,grafana-server}  /usr/local/bin/
#安裝依賴包
$ yum install -y  fontpackages-filesystem.noarch libXfont libfontenc lyx-fonts.noarch  xorg-x11-font-utils
6.2 安裝插件
安裝grafana時(shí)鐘插件
$ grafana-cli plugins install grafana-clock-panel
安裝Zabbix插件
$ grafana-cli plugins install alexanderzobnin-zabbix-app
安裝服務(wù)器端圖像渲染組件
$ yum install -y fontconfig freetype* urw-fonts
6.3 創(chuàng)建服務(wù)啟動(dòng)文件
$ cat <<EOF >/usr/lib/systemd/system/grafana.service
[Service]
Type=notify
ExecStart=/usr/local/bin/grafana-server -homepath /etc/grafana
Restart=on-failure

[Install]
WantedBy=multi-user.target
EOF
-homepath:指定grafana的工作目錄
6.4 啟動(dòng)grafana服務(wù)
$ systemctl daemon-reload
$ systemctl enable --now grafana.service
$ systemctl status grafana.service
$ ss  -ntulp |  grep grafana-server
tcp    LISTEN     0   128    :::3000   :::*   users:(("grafana-server",pid=120140,fd=9))
6.5 配置數(shù)據(jù)源
在瀏覽器地址欄輸入主機(jī)IP和grafana服務(wù)端口訪問(wèn)Grafana UI界面后,添加Prometheus數(shù)據(jù)源。
默認(rèn)用戶密碼:admin/admin
6.6 導(dǎo)入json模板
一旦您配置了Prometheus服務(wù)器以收集您的 Harbor 指標(biāo),您就可以使用 Grafana來(lái)可視化您的數(shù)據(jù)。Harbor 存儲(chǔ)庫(kù)中提供了一個(gè) 示例 Grafana 儀表板,可幫助您開(kāi)始可視化 Harbor 指標(biāo)。
Harbor官方提供了一個(gè)grafana的json文件模板。下載:
https://github.com/goharbor/harbor/blob/main/contrib/grafana-dashborad/metrics-example.json
七、部署AlertManager服務(wù)(擴(kuò)展)
Alertmanager是一個(gè)獨(dú)立的告警模塊,接收Prometheus等客戶端發(fā)來(lái)的警報(bào),之后通過(guò)分組、刪除重復(fù)等處理,并將它們通過(guò)路由發(fā)送給正確的接收器;
7.1 下載安裝包
$ wget https://github.com/prometheus/alertmanager/releases/download/v0.23.0/alertmanager-0.23.0.linux-amd64.tar.gz
$ tar zxvf alertmanager-0.23.0.linux-amd64.tar.gz
$ cp  alertmanager-0.23.0.linux-amd64/{alertmanager,amtool}   /usr/local/bin/
7.2 修改配置文件
$ mkdir /etc/alertmanager
$ cat /etc/alertmanager/alertmanager.yml
global:
  resolve_timeout: 5m

route:
  group_by: ['alertname']
  group_wait: 10s
  group_interval: 10s
  repeat_interval: 1h
  receiver: 'web.hook'
receivers:
- name: 'web.hook'
  webhook_configs:
  - url: 'http://127.0.0.1:5001/'
inhibit_rules:
  - source_match:
      severity: 'critical'
    target_match:
      severity: 'warning'
    equal: ['alertname', 'dev', 'instance']
7.3 創(chuàng)建服務(wù)啟動(dòng)文件
$ cat <<EOF >/usr/lib/systemd/system/alertmanager.service
[Unit]
Description=alertmanager
fter=network.target

[Service]
ExecStart=/usr/local/bin/alertmanager --config.file=/etc/alertmanager/alertmanager.yml
ExecReload=/bin/kill -HUP $MAINPID
KillMode=process
Restart=on-failure

[Install]
WantedBy=multi-user.target
EOF
7.4 啟動(dòng)服務(wù)
$ systemctl daemon-reload
$ systemctl enable --now alertmanager.service
$ systemctl status alertmanager.service
$ ss  -ntulp |  grep alertmanager
7.5 配置告警規(guī)則
前面在Prometheus server的配置文件中中指定了告警規(guī)則的文件為/etc/prometheus/rules.yml。
$ cat /etc/prometheus/rules.yml
groups:
  - name: Warning
    rules:
      - alert: NodeMemoryUsage
        expr: 100 - (node_memory_MemFree_bytes + node_memory_Cached_bytes + node_memory_Buffers_bytes) / node_memory_MemTotal_bytes*100 > 80
        for: 1m
        labels:
          status: Warning
        annotations:
          summary: "{{$labels.instance}}: 內(nèi)存使用率過(guò)高"
          description: "{{$labels.instance}}: 內(nèi)存使用率大于 80% (當(dāng)前值: {{ $value }}"

      - alert: NodeCpuUsage
        expr: (1-((sum(increase(node_cpu_seconds_total{mode="idle"}[1m])) by (instance)) / (sum(increase(node_cpu_seconds_total[1m])) by (instance)))) * 100 > 70
        for: 1m
        labels:
          status: Warning
        annotations:
          summary: "{{$labels.instance}}: CPU使用率過(guò)高"
          description: "{{$labels.instance}}: CPU使用率大于 70% (當(dāng)前值: {{ $value }}"

      - alert: NodeDiskUsage
        expr: 100 - node_filesystem_free_bytes{fstype=~"xfs|ext4"} / node_filesystem_size_bytes{fstype=~"xfs|ext4"} * 100 > 80
        for: 1m
        labels:
          status: Warning
        annotations:
          summary: "{{$labels.instance}}: 分區(qū)使用率過(guò)高"
          description: "{{$labels.instance}}: 分區(qū)使用大于 80% (當(dāng)前值: {{ $value }}"

      - alert: Node-UP
        expr: up{job='node-exporter'} == 0
        for: 1m
        labels:
          status: Warning
        annotations:
          summary: "{{$labels.instance}}: 服務(wù)宕機(jī)"
          description: "{{$labels.instance}}: 服務(wù)中斷超過(guò)1分鐘"

      - alert: TCP
        expr: node_netstat_Tcp_CurrEstab > 1000
        for: 1m
        labels:
          status: Warning
        annotations:
          summary: "{{$labels.instance}}: TCP連接過(guò)高"
          description: "{{$labels.instance}}: 連接大于1000 (當(dāng)前值: {{$value}})"

      - alert: IO
        expr: 100 - (avg(irate(node_disk_io_time_seconds_total[1m])) by(instance)* 100) < 60
        for: 1m
        labels:
          status: Warning
        annotations:
          summary: "{{$labels.instance}}: 流入磁盤(pán)IO使用率過(guò)高"
          description: "{{$labels.instance}}:流入磁盤(pán)IO大于60%  (當(dāng)前值:{{$value}})"