企業(yè)級日志系統(tǒng) ELK 原理與實踐詳細介紹
原文鏈接:https://www.cnblogs.com/zsql/p/13164414.html
一、ELK介紹
1.1、ELK簡介
ELK是Elasticsearch、Logstash、Kibana三大開源框架首字母大寫簡稱(但是后期出現(xiàn)的filebeat(beats中的一種)可以用來替代logstash的數(shù)據(jù)收集功能,比較輕量級)。市面上也被稱為 Elastic Stack。
Filebeat是用于轉(zhuǎn)發(fā)和集中日志數(shù)據(jù)的輕量級傳送工具。Filebeat監(jiān)視您指定的日志文件或位置,收集日志事件,并將它們轉(zhuǎn)發(fā)到Elasticsearch或 Logstash進行索引。Filebeat的工作方式如下:啟動Filebeat時,它將啟動一個或多個輸入,這些輸入將在為日志數(shù)據(jù)指定的位置中查找。對于Filebeat所找到的每個日志,F(xiàn)ilebeat都會啟動收集器。每個收集器都讀取單個日志以獲取新內(nèi)容,并將新日志數(shù)據(jù)發(fā)送到libbeat,libbeat將聚集事件,并將聚集的數(shù)據(jù)發(fā)送到為Filebeat配置的輸出。
Logstash是免費且開放的服務(wù)器端數(shù)據(jù)處理管道,能夠從多個來源采集數(shù)據(jù),轉(zhuǎn)換數(shù)據(jù),然后將數(shù)據(jù)發(fā)送到您最喜歡的“存儲庫”中。Logstash能夠動態(tài)地采集、轉(zhuǎn)換和傳輸數(shù)據(jù),不受格式或復(fù)雜度的影響。利用Grok從非結(jié)構(gòu)化數(shù)據(jù)中派生出結(jié)構(gòu),從IP地址解碼出地理坐標,匿名化或排除敏感字段,并簡化整體處理過程。
Elasticsearch是Elastic Stack核心的分布式搜索和分析引擎,是一個基于Lucene、分布式、通過Restful方式進行交互的近實時搜索平臺框架。Elasticsearch為所有類型的數(shù)據(jù)提供近乎實時的搜索和分析。無論您是結(jié)構(gòu)化文本還是非結(jié)構(gòu)化文本,數(shù)字數(shù)據(jù)或地理空間數(shù)據(jù),Elasticsearch都能以支持快速搜索的方式有效地對其進行存儲和索引。
Kibana是一個針對Elasticsearch的開源分析及可視化平臺,用來搜索、查看交互存儲在Elasticsearch索引中的數(shù)據(jù)。使用Kibana,可以通過各種圖表進行高級數(shù)據(jù)分析及展示。并且可以為 Logstash 和 ElasticSearch 提供的日志分析友好的 Web 界面,可以匯總、分析和搜索重要數(shù)據(jù)日志。還可以讓海量數(shù)據(jù)更容易理解。它操作簡單,基于瀏覽器的用戶界面可以快速創(chuàng)建儀表板(dashboard)實時顯示Elasticsearch查詢動態(tài)
1.2、為什么要使用ELK
日志主要包括系統(tǒng)日志、應(yīng)用程序日志和安全日志。系統(tǒng)運維和開發(fā)人員可以通過日志了解服務(wù)器軟硬件信息、檢查配置過程中的錯誤及錯誤發(fā)生的原因。經(jīng)常分析日志可以了解服務(wù)器的負荷,性能安全性,從而及時采取措施糾正錯誤。
往往單臺機器的日志我們使用grep、awk等工具就能基本實現(xiàn)簡單分析,但是當日志被分散的儲存不同的設(shè)備上。如果你管理數(shù)十上百臺服務(wù)器,你還在使用依次登錄每臺機器的傳統(tǒng)方法查閱日志。這樣是不是感覺很繁瑣和效率低下。當務(wù)之急我們使用集中化的日志管理,例如:開源的syslog,將所有服務(wù)器上的日志收集匯總。集中化管理日志后,日志的統(tǒng)計和檢索又成為一件比較麻煩的事情,一般我們使用grep、awk和wc等Linux命令能實現(xiàn)檢索和統(tǒng)計,但是對于要求更高的查詢、排序和統(tǒng)計等要求和龐大的機器數(shù)量依然使用這樣的方法難免有點力不從心。
一般大型系統(tǒng)是一個分布式部署的架構(gòu),不同的服務(wù)模塊部署在不同的服務(wù)器上,問題出現(xiàn)時,大部分情況需要根據(jù)問題暴露的關(guān)鍵信息,定位到具體的服務(wù)器和服務(wù)模塊,構(gòu)建一套集中式日志系統(tǒng),可以提高定位問題的效率。
1.3、完整日志系統(tǒng)基本特征
收集:能夠采集多種來源的日志數(shù)據(jù) 傳輸:能夠穩(wěn)定的把日志數(shù)據(jù)解析過濾并傳輸?shù)酱鎯ο到y(tǒng) 存儲:存儲日志數(shù)據(jù) 分析:支持 UI 分析 警告:能夠提供錯誤報告,監(jiān)控機制
二、ELK架構(gòu)分析
2.1、beats+elasticsearch+kibana模式
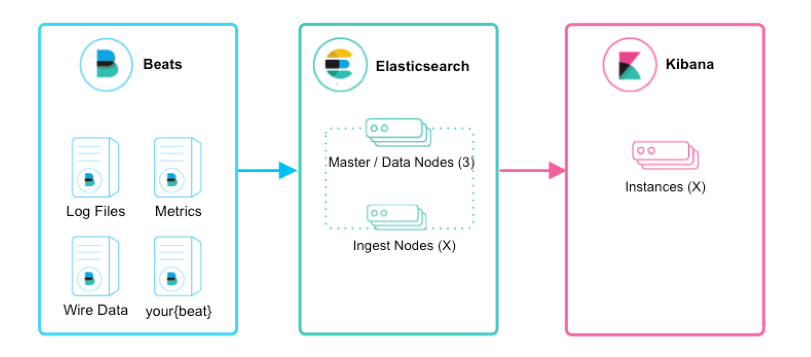
如上圖所示,該ELK框架由beats(日志分析我們通常使用filebeat)+elasticsearch+kibana構(gòu)成,這個框架比較簡單,入門級的框架。其中filebeat也能通過module對日志進行簡單的解析和索引。并查看預(yù)建的Kibana儀表板。
該框架適合簡單的日志數(shù)據(jù),一般可以用來玩玩,生產(chǎn)環(huán)境建議接入logstash
2.2、beats+logstash+elasticsearch+kibana模式
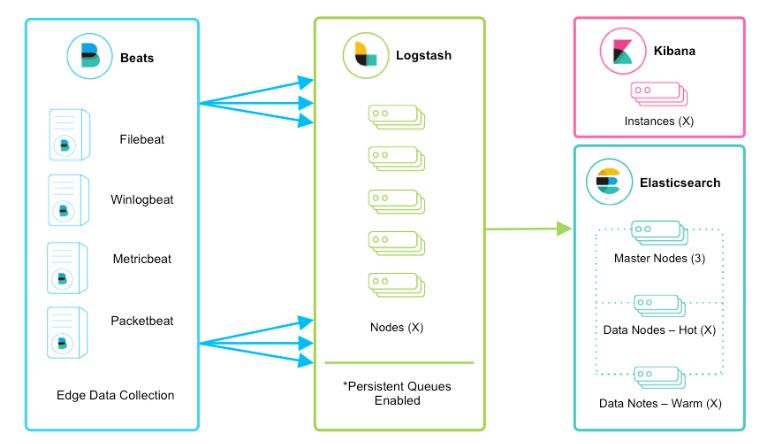
該框架是在上面的框架的基礎(chǔ)上引入了logstash,引入logstash帶來的好處如下:
通Logstash具有基于磁盤的自適應(yīng)緩沖系統(tǒng),該系統(tǒng)將吸收傳入的吞吐量,從而減輕背壓 從其他數(shù)據(jù)源(例如數(shù)據(jù)庫,S3或消息傳遞隊列)中提取 將數(shù)據(jù)發(fā)送到多個目的地,例如S3,HDFS或?qū)懭胛募?/section> 使用條件數(shù)據(jù)流邏輯組成更復(fù)雜的處理管道
filebeat結(jié)合logstash帶來的優(yōu)勢:
1、水平可擴展性,高可用性和可變負載處理:filebeat和logstash可以實現(xiàn)節(jié)點之間的負載均衡,多個logstash可以實現(xiàn)logstash的高可用
2、消息持久性與至少一次交付保證:使用Filebeat或Winlogbeat進行日志收集時,可以保證至少一次交付。從Filebeat或Winlogbeat到Logstash以及從Logstash到Elasticsearch的兩種通信協(xié)議都是同步的,并且支持確認。Logstash持久隊列提供跨節(jié)點故障的保護。對于Logstash中的磁盤級彈性,確保磁盤冗余非常重要。
3、具有身份驗證和有線加密的端到端安全傳輸:從Beats到Logstash以及從 Logstash到Elasticsearch的傳輸都可以使用加密方式傳遞 。與Elasticsearch進行通訊時,有很多安全選項,包括基本身份驗證,TLS,PKI,LDAP,AD和其他自定義領(lǐng)域
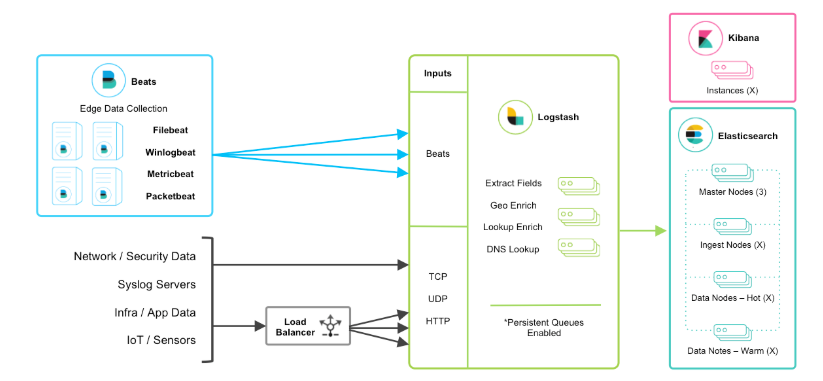
當然在該框架的基礎(chǔ)上還可以引入其他的輸入數(shù)據(jù)的方式:比如:TCP,UDP和HTTP協(xié)議是將數(shù)據(jù)輸入Logstash的常用方法(如下圖所示):
2.3、beats+緩存/消息隊列+logstash+elasticsearch+kibana模式
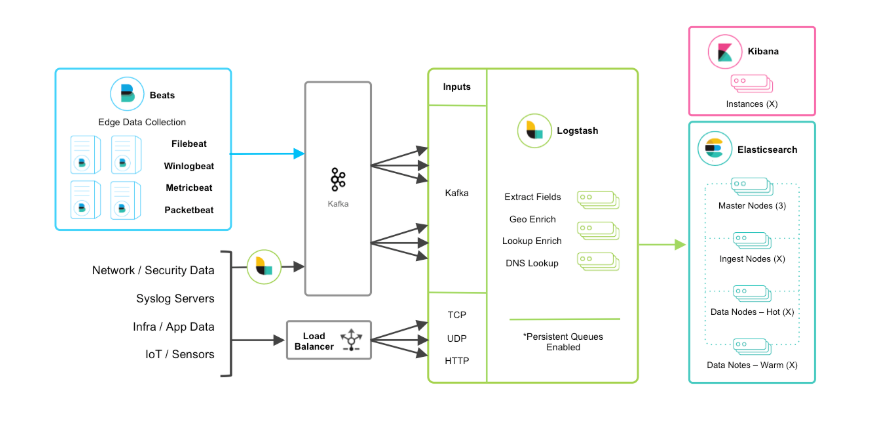
在如上的基礎(chǔ)上我們可以在beats和logstash中間添加一些組件redis、kafka、RabbitMQ等,添加中間件將會有如下好處:第一,降低對日志所在機器的影響,這些機器上一般都部署著反向代理或應(yīng)用服務(wù),本身負載就很重了,所以盡可能的在這些機器上少做事;第二,如果有很多臺機器需要做日志收集,那么讓每臺機器都向Elasticsearch持續(xù)寫入數(shù)據(jù),必然會對Elasticsearch造成壓力,因此需要對數(shù)據(jù)進行緩沖,同時,這樣的緩沖也可以一定程度的保護數(shù)據(jù)不丟失;第三,將日志數(shù)據(jù)的格式化與處理放到Indexer中統(tǒng)一做,可以在一處修改代碼、部署,避免需要到多臺機器上去修改配置
三、ELK部署
elk各個組件的網(wǎng)址可以在官網(wǎng)下載:https://www.elastic.co/cn/
或者在中文社區(qū)下載:https://elasticsearch.cn/download/
注:本次安裝都是采用壓縮包的方式安裝
3.1、filebeat的安裝介紹
3.1.1、原理
Filebeat的工作方式如下:啟動Filebeat時,它將啟動一個或多個輸入,這些輸入將在為日志數(shù)據(jù)指定的位置中查找。對于Filebeat所找到的每個日志,F(xiàn)ilebeat都會啟動收集器。每個收集器都讀取單個日志以獲取新內(nèi)容,并將新日志數(shù)據(jù)發(fā)送到libbeat,libbeat將聚集事件,并將聚集的數(shù)據(jù)發(fā)送到為Filebeat配置的輸出
Filebeat結(jié)構(gòu):由兩個組件構(gòu)成,分別是inputs(輸入)和harvesters(收集器),這些組件一起工作來跟蹤文件并將事件數(shù)據(jù)發(fā)送到您指定的輸出,harvester負責(zé)讀取單個文件的內(nèi)容。harvester逐行讀取每個文件,并將內(nèi)容發(fā)送到輸出。為每個文件啟動一個harvester。harvester負責(zé)打開和關(guān)閉文件,這意味著文件描述符在harvester運行時保持打開狀態(tài)。如果在收集文件時刪除或重命名文件,F(xiàn)ilebeat將繼續(xù)讀取該文件。這樣做的副作用是,磁盤上的空間一直保留到harvester關(guān)閉。默認情況下,F(xiàn)ilebeat保持文件打開,直到達到close_inactive
3.1.2、簡單安裝
本文采用壓縮包的方式安裝,linux版本,filebeat-7.7.0-linux-x86_64.tar.gz
curl-L-Ohttps://artifacts.elastic.co/downloads/beats/filebeat/filebeat-7.7.0-linux-x86_64.tar.gz
tar -xzvf filebeat-7.7.0-linux-x86_64.tar.gz
配置示例文件:filebeat.reference.yml(包含所有未過時的配置項) 配置文件:filebeat.yml 啟動命令:./filebeat -e
3.2、logstash的安裝介紹
3.2.1、基本原理
logstash分為三個步驟:inputs(必須的)→ filters(可選的)→ outputs(必須的),inputs生成時間,filters對其事件進行過濾和處理,outputs輸出到輸出端或者決定其存儲在哪些組件里。inputs和outputs支持編碼和解碼
Logstash管道中的每個input階段都在自己的線程中運行。將寫事件輸入到內(nèi)存(默認)或磁盤上的中心隊列。每個管道工作線程從該隊列中取出一批事件,通過配置的filter處理該批事件,然后通過output輸出到指定的組件存儲。管道處理數(shù)據(jù)量的大小和管道工作線程的數(shù)量是可配置的
3.2.2、簡單安裝
下載地址1:https://www.elastic.co/cn/downloads/logstash
下載地址2:https://elasticsearch.cn/download/
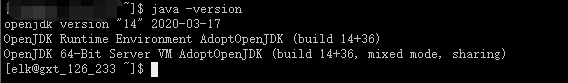
這里需要安裝jdk,我使用的是elasticsearch7.7.0自帶的jdk:
解壓即安裝:
tar -zxvf logstash-7.7.0.tar.gz
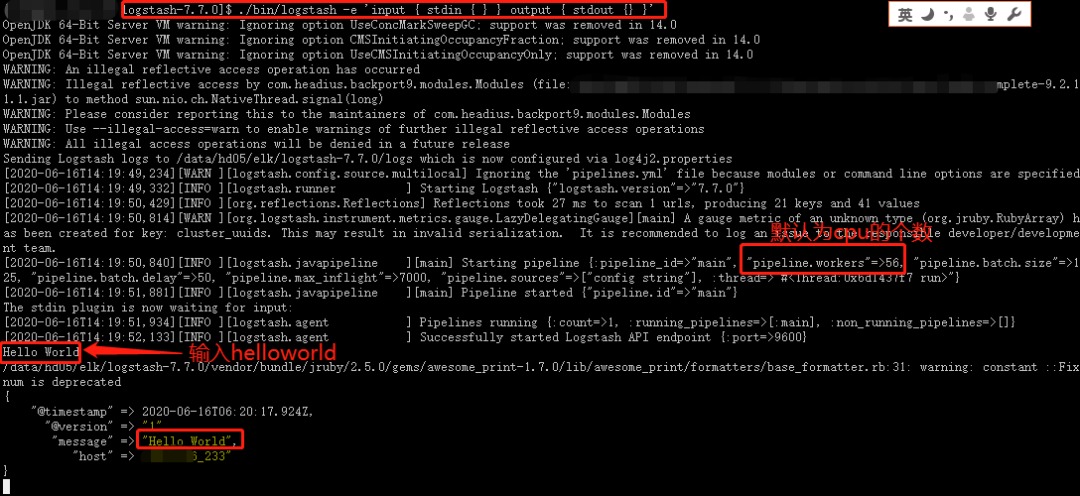
來個logstash版本的HelloWorld:
./bin/logstash -e 'input { stdin { } } output { stdout {} }'
3.3、elasticsearch的安裝介紹
3.3.1、基本介紹
Elasticsearch(ES)是一個基于Lucene構(gòu)建的開源、分布式、RESTful接口的全文搜索引擎。Elasticsearch還是一個分布式文檔數(shù)據(jù)庫,其中每個字段均可被索引,而且每個字段的數(shù)據(jù)均可被搜索,ES能夠橫向擴展至數(shù)以百計的服務(wù)器存儲以及處理PB級的數(shù)據(jù)。可以在極短的時間內(nèi)存儲、搜索和分析大量的數(shù)據(jù)。
基本概念有:Cluster 集群、Node節(jié)點、Index索引、Document文檔、Shards & Replicas分片與副本等
elasticsearch的優(yōu)勢:
分布式:橫向擴展非常靈活 全文檢索:基于lucene的強大的全文檢索能力; 近實時搜索和分析:數(shù)據(jù)進入ES,可達到近實時搜索,還可進行聚合分析 高可用:容錯機制,自動發(fā)現(xiàn)新的或失敗的節(jié)點,重組和重新平衡數(shù)據(jù) 模式自由:ES的動態(tài)mapping機制可以自動檢測數(shù)據(jù)的結(jié)構(gòu)和類型,創(chuàng)建索引并使數(shù)據(jù)可搜索。 RESTful API:JSON + HTTP
3.3.2、linux系統(tǒng)參數(shù)設(shè)置
1、設(shè)置系統(tǒng)配置
ulimit #暫時修改,切換到該用戶es,ulimit -n 65535
/etc/security/limits.conf #永久修改 es -  nofile  65535
ulimit -a #查看當前用戶的資源限制

2、禁用sawpping
方式一:
swapoff -a #臨時禁用所有的swap文件
vim /etc/fstab #注釋掉所有的swap相關(guān)的行,永久禁用

方式二:
cat /proc/sys/vm/swappiness #查看該值
sysctl vm.swappiness=1 #臨時修改該值為1
vim /etc/sysctl.conf #修改文件 永久生效
vm.swappiness = 1 #如果有該值,則修改該值,若沒有,則追加該選項,sysctl -p生效命令

方式三:
配置elasticsearch.yml文件,添加如下配置:
bootstrap.memory_lock: true
GET _nodes?filter_path=**.mlockall  #檢查如上配置是否成功
注意:如果試圖分配比可用內(nèi)存更多的內(nèi)存,mlockall可能會導(dǎo)致JVM或shell會話退出!

3、配置文件描述符
ulimit -n 65535  #臨時修改
vim /etc/security/limits.conf #永久修改
es         soft    nproc     65535
es         hard    nproc     65535

4、配置虛擬內(nèi)存
sysctl -w vm.max_map_count=262144 #臨時修改該值
vim /etc/sysctl.conf #永久修改
vm.max_map_count=262144

5、配置線程數(shù)
ulimit -u 4096 #臨時修改
vim /etc/security/limits.conf #永久修改
3.3.3、elasticsearch安裝
elasticsearch是需要其他用戶啟動的,所以需要先創(chuàng)建一個新的用戶elk:
groupadd  elastic
useradd elk -d /data/hd05/elk -g elastic
echo '2edseoir@' | passwd elk --stdin
下載:https://elasticsearch.cn/download/
也可以去官網(wǎng)下載:wget https://artifacts.elastic.co/downloads/elasticsearch/elasticsearch-7.7.0-linux-x86_64.tar.gz
解壓:tar -zxvf elasticsearch-7.7.0-linux-x86_64.tar.gz
建立軟鏈接:ln –s elasticsearch-7.7.0  es
目錄介紹:
$ES_HOME:/data/hd05/elk/elasticsearch-7.7.0
bin: $ES_HOME/bin  #es啟動命令和插件安裝命令
conf:$ES_HOME/conf #elasticsearch.yml配置文件目錄
data:$ES_HOME/data  #對應(yīng)的參數(shù)path.data,用于存放索引分片數(shù)據(jù)文件
logs:$ES_HOME/logs  #對應(yīng)的參數(shù)path.logs,用于存放日志
jdk:$ES_HOME/jdk  #自帶支持該es版本的jdk
plugins: $ES_HOME/jplugins #插件存放目錄
lib: $ES_HOME/lib #存放依賴包,比如java類庫
modules: $ES_HOME/modules #包含所有的es模塊
配置自帶的java環(huán)境:
Vim ~/.bashrc
\############往后面添加如下內(nèi)容######################
export JAVA_HOME=/data/hd05/elk/es/jdk
export PATH=????????????????/??????:JAVAHOME/bin:PATH
export CLASSPATH=.:$JAVA_HOME/lib/dt.jar\:/lib/tools.jar
jvm.options文件說明:
配置java參數(shù)
一種是通過修改/data/hd05/elk/elasticsearch-7.7.0/config/jvm.options文件修改jvm參數(shù),一個使用過一個變量ES_JAVA_OPTS來聲明jvm參數(shù)
/data/hd05/elk/elasticsearch-7.7.0/config/jvm.options介紹:
8:-Xmx2g  #表示只適合java8
8-:-Xmx2g  #表示適合高于java8的版本
8-9:-Xmx2g #表示適合java8,和java9
其他配置,都是jvm的相關(guān)參數(shù),如果要想明白,得去看java虛擬機

通過變量ES_JAVA_OPTS來聲明jvm參數(shù):
例如:export ES_JAVA_OPTS="$ES_JAVA_OPTS -Djava.io.tmpdir=/path/to/temp/dir"
./bin/elasticsearch
配置config/jvm.options
[elk@lgh config]$ cat  jvm.options  | egrep -v '^$|#'
-Xms2g
-Xmx2g
8-13:-XX:+UseConcMarkSweepGC
8-13:-XX:CMSInitiatingOccupancyFraction=75
8-13:-XX:+UseCMSInitiatingOccupancyOnly
14-:-XX:+UseG1GC
14-:-XX:G1ReservePercent=25
14-:-XX:InitiatingHeapOccupancyPercent=30
-Djava.io.tmpdir=${ES_TMPDIR}
-XX:+HeapDumpOnOutOfMemoryError
-XX:HeapDumpPath=data
-XX:ErrorFile=logs/hs_err_pid%p.log
8:-XX:+PrintGCDetails
8:-XX:+PrintGCDateStamps
8:-XX:+PrintTenuringDistribution
8:-XX:+PrintGCApplicationStoppedTime
8:-Xloggc:logs/gc.log
8:-XX:+UseGCLogFileRotation
8:-XX:NumberOfGCLogFiles=32
8:-XX:GCLogFileSize=64m
9-:-Xlog:gc*,gc+age=trace,safepoint:file=logs/gc.log:utctime,pid,tags:filecount=32,filesize=64m
配置加密通信證書
生成證書:
方法一:
./bin/elasticsearch-certutil ca -out config/elastic-certificates.p12 -pass "password"
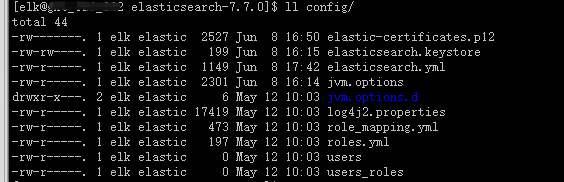
查看config目錄,有elastic-certificates.p12文件生成
方法二:
./bin/elasticsearch-certutil ca  #創(chuàng)建集群認證機構(gòu),需要交互輸入密碼
./bin/elasticsearch-certutil cert --ca elastic-stack-ca.p12  #為節(jié)點頒發(fā)證書,與上面密碼一樣
執(zhí)行./bin/elasticsearch-keystore add xpack.security.transport.ssl.keystore.secure_password 并輸入第一步輸入的密碼
執(zhí)行./bin/elasticsearch-keystore add xpack.security.transport.ssl.truststore.secure_password 并輸入第一步輸入的密碼
將生成的elastic-certificates.p12、elastic-stack-ca.p12文件移動到config目錄下
配置config/elasticsearch.yml
[elk@lgh config]$ cat  elasticsearch.yml  | egrep -v '^$|#'
cluster.name: my_cluster
node.name: lgh01
node.data: true
node.master: true
path.data: /data/hd05/elk/elasticsearch-7.7.0/data
path.logs: /data/hd05/elk/elasticsearch-7.7.0/logs
network.host: 192.168.110.130
http.port: 9200
transport.tcp.port: 9300
discovery.seed_hosts: ["192.168.110.130","192.168.110.131","192.168.110.132","192.168.110.133"]
cluster.initial_master_nodes: ["lgh01","lgh02","lgh03"]
cluster.routing.allocation.cluster_concurrent_rebalance: 32
cluster.routing.allocation.node_concurrent_recoveries: 32
cluster.routing.allocation.node_initial_primaries_recoveries: 32
http.cors.enabled: true
http.cors.allow-origin: '*'

#下面的是配置x-pack和tsl/ssl加密通信的
xpack.security.enabled: true
xpack.license.self_generated.type: basic
xpack.security.transport.ssl.enabled: true
xpack.security.transport.ssl.verification_mode: certificate
xpack.security.transport.ssl.keystore.path: elastic-certificates.p12
xpack.security.transport.ssl.truststore.path: elastic-certificates.p12

bootstrap.memory_lock: false   #centos6需要配置
bootstrap.system_call_filter: false #centos6需要配置
然后通過scp到其他的節(jié)點,修改上面的node.name和node.master參數(shù),然后要刪除data目標,不然會存在報錯
然后使用 ./bin/elasticsearch -d 后臺啟動 elasticsearch,去掉 ``-d` 則是前端啟動 elasticsearch
然后 ./bin/elasticsearch-setup-passwords interactive 配置默認用戶的密碼:(有如下的交互),可以使用auto自動生成。
[elk@lgh elasticsearch-7.7.0]$ ./bin/elasticsearch-setup-passwords interactive
Enter password for the elasticsearch keystore :
Initiating the setup of passwords for reserved users elastic,apm_system,kibana,logstash_system,beats_system,remote_monitoring_user.
You will be prompted to enter passwords as the process progresses.
Please confirm that you would like to continue [y/N]y


Enter password for [elastic]:
Reenter password for [elastic]:
Enter password for [apm_system]:
Reenter password for [apm_system]:
Enter password for [kibana]:
Reenter password for [kibana]:
Enter password for [logstash_system]:
Reenter password for [logstash_system]:
Enter password for [beats_system]:
Reenter password for [beats_system]:
Enter password for [remote_monitoring_user]:
Reenter password for [remote_monitoring_user]:
1qaz@WSXChanged password for user [apm_system]
Changed password for user [kibana]
Changed password for user [logstash_system]
Changed password for user [beats_system]
Changed password for user [remote_monitoring_user]
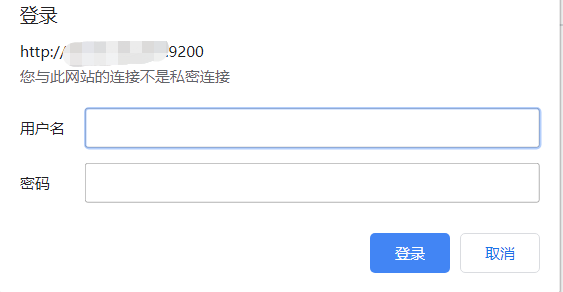
然后可以登錄 http://192.168.110.130:9200/ 需要輸入密碼,輸入 elastic/passwd 即可登錄
3.3.4、head插件安裝
https://github.com/mobz/elasticsearch-head #head官網(wǎng)
https://nodejs.org/zh-cn/download/ #nodejs下載
官方說明,elasticsearch7有三種方式使用head插件,這里我只試過兩種:
第一種:使用谷歌瀏覽器head插件,這個直接在谷歌瀏覽器上面安裝插件就可以使用了
第二種:使用head服務(wù)(把head當做一個服務(wù)來使用),安裝如下
#Running with built in server
git clone git://github.com/mobz/elasticsearch-head.git
cd elasticsearch-head
npm install
npm run start
open http://localhost:9100/
如果在如上的安裝過程中報錯,可以嘗試下這個命令再繼續(xù)安裝npm install [email protected] --ignore-scripts
3.4、kibana的安裝介紹
下載地址:https://elasticsearch.cn/download/
也可以去官網(wǎng)下載
解壓后修改kibana.yml文件
[elk@lgh config]$ cat kibana.yml  | egrep -v "^$|#"
server.port: 5601
server.host: "0.0.0.0"
server.name: "my-kibana"
elasticsearch.hosts: ["http://192.168.110.130:9200","http://192.168.110.131:9200","http://192.168.110.132:9200"]
elasticsearch.preserveHost: true
kibana.index: ".kibana"
elasticsearch.username: "elastic"
elasticsearch.password: "password"   #或者使用keystore的保存的密碼"${ES_PWD}"
./bin/kibana 啟動
訪問網(wǎng)址:http://192.168.110.130:5601/ 并使用 elastic/password 登錄
四、實例分析
現(xiàn)在我們弄一個beats+緩存/消息隊列+logstash+elasticsearch+kibana的實例:
中間組件我們使用kafka,我們看下filebeat把kafka作為output的官網(wǎng):
https://www.elastic.co/guide/en/beats/filebeat/7.7/kafka-output.html

這里要注意kafka的版本,我試過兩個都是極端的版本,坑了自己一把。假如你已經(jīng)有kafka集群了,我這里安裝的是一個單機版本(1.1.1):
數(shù)據(jù)集我們采用apache的日志格式,下載地址:https://download.elastic.co/demos/logstash/gettingstarted/logstash-tutorial.log.gz
日志格式如下:
[elk@lgh ~]$ tail -3 logstash-tutorial.log
86.1.76.62 - - [04/Jan/2015:05:30:37 +0000] "GET /projects/xdotool/ HTTP/1.1" 200 12292 "http://www.haskell.org/haskellwiki/Xmonad/Frequently_asked_questions" "Mozilla/5.0 (X11; Linux x86_64; rv:24.0) Gecko/20140205 Firefox/24.0 Iceweasel/24.3.0"
86.1.76.62 - - [04/Jan/2015:05:30:37 +0000] "GET /reset.css HTTP/1.1" 200 1015 "http://www.semicomplete.com/projects/xdotool/" "Mozilla/5.0 (X11; Linux x86_64; rv:24.0) Gecko/20140205 Firefox/24.0 Iceweasel/24.3.0"
86.1.76.62 - - [04/Jan/2015:05:30:37 +0000] "GET /style2.css HTTP/1.1" 200 4877 "http://www.semicomplete.com/projects/xdotool/" "Mozilla/5.0 (X11; Linux x86_64; rv:24.0) Gecko/20140205 Firefox/24.0 Iceweasel/24.3.0"
首先我們配置filebeat的配置文件filebeat.yml
#=========================== Filebeat inputs =============================

filebeat.inputs:

# Each - is an input. Most options can be set at the input level, so
# you can use different inputs for various configurations.
# Below are the input specific configurations.

- type: log

  # Change to true to enable this input configuration.
  enabled: true

  # Paths that should be crawled and fetched. Glob based paths.
  paths:
    - /data/elk/logstash-tutorial.log  #這里使用的是apache的日志格式
    #- c:\programdata\elasticsearch\logs\*

  # Exclude lines. A list of regular expressions to match. It drops the lines that are
  # matching any regular expression from the list.
  #exclude_lines: ['^DBG']

  # Include lines. A list of regular expressions to match. It exports the lines that are
  # matching any regular expression from the list.
  #include_lines: ['^ERR', '^WARN']

  # Exclude files. A list of regular expressions to match. Filebeat drops the files that
  # are matching any regular expression from the list. By default, no files are dropped.
  #exclude_files: ['.gz$']

  # Optional additional fields. These fields can be freely picked
  # to add additional information to the crawled log files for filtering
  #fields:
  #  level: debug
  #  review: 1

  ### Multiline options

  # Multiline can be used for log messages spanning multiple lines. This is common
  # for Java Stack Traces or C-Line Continuation

  # The regexp Pattern that has to be matched. The example pattern matches all lines starting with [
  #multiline.pattern: ^\[

  # Defines if the pattern set under pattern should be negated or not. Default is false.
  #multiline.negate: false

  # Match can be set to "after" or "before". It is used to define if lines should be append to a pattern
  # that was (not) matched before or after or as long as a pattern is not matched based on negate.
  # Note: After is the equivalent to previous and before is the equivalent to to next in Logstash
  #multiline.match: after
#================================ Outputs =====================================
output.kafka:
  hosts: ["192.168.110.130:9092"]   #配置kafka的broker
  topic: 'filebeat_test'   #配置topic 名字
  partition.round_robin:
    reachable_only: false
  required_acks: 1
  compression: gzip
  max_message_bytes: 1000000
然后使用命令后臺啟動:
cd filebeat-7.7.0-linux-x86_64 && nohup ./filebeat -e &
接下來我們配置logstash的配置文件
cd logstash-7.7.0/ && mkidr conf.d
cd conf.d
vim apache.conf
################apache.conf文件中填入如下內(nèi)容##############################
input {
        kafka{
                bootstrap_servers => "192.168.110.130:9092"
                topics => ["filebeat_test"]
                group_id => "test123"
                auto_offset_reset => "earliest"
        }
    }
filter {
json
        {
                source => "message"
        }
        grok {
        match => { "message" => "%{COMBINEDAPACHELOG}"}
        remove_field => "message"
    }
}
output {
    stdout { codec => rubydebug }
    elasticsearch {
                    hosts => ["192.168.110.130:9200","192.168.110.131:9200","10.18.126.224:9200","192.168.110.132:9200"]
                    index => "test_kakfa"
                    user => "elastic"
                    password => "${ES_PWD}"
                }
}
然后后臺啟動logstash命令
cd logstash-7.7.0/ && nohup ./bin/logstash -f conf.d/apache.conf &
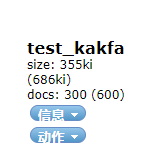
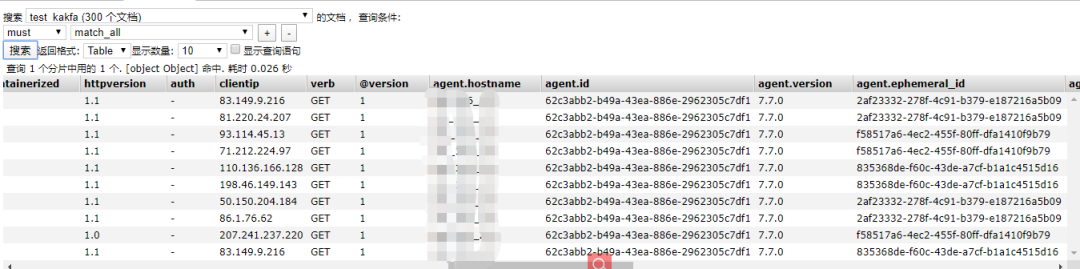
然后我們查看elasticsearch集群查看該索引
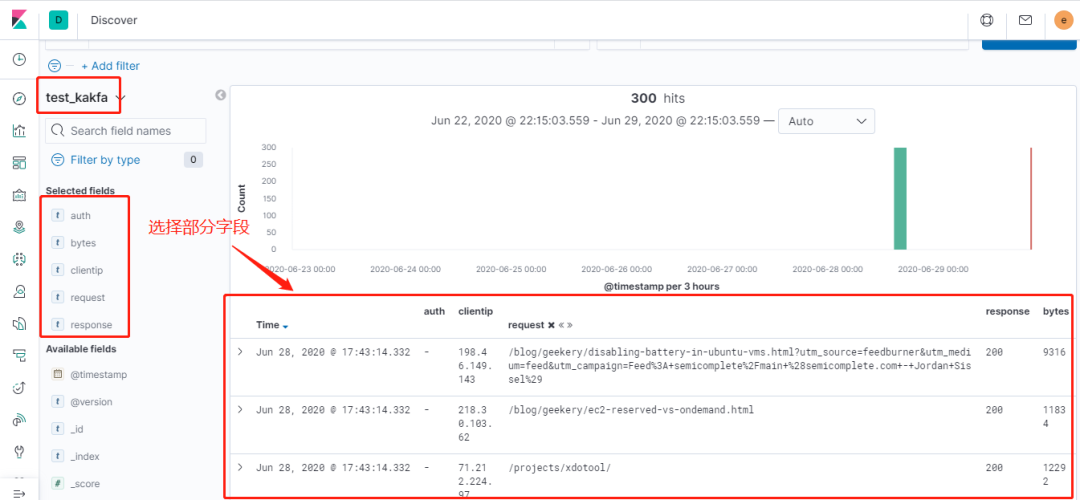
接下來我們登錄到kibana查看該索引的分析
- END -
推薦閱讀 《Python自動化運維開發(fā)實戰(zhàn)》集訓(xùn)營 互聯(lián)網(wǎng)公司使用 Redis 的16個應(yīng)用場景 Ceph 常見故障排查筆記總結(jié) 企業(yè)級共享存儲系統(tǒng) NFS 全面講解 編寫 Dockerfile 最佳實踐 運維工程師不得不看的經(jīng)驗教訓(xùn)和注意事項 Kubernetes 的這些核心資源原理,你一定要了解 終于搞懂了服務(wù)器為啥產(chǎn)生大量的TIME_WAIT! Kubernetes 網(wǎng)絡(luò)方案之炫酷的 Cilium Prometheus+InfluxDB+Grafana 打造高逼格監(jiān)控平臺 這些 K8S 日常故障處理集錦,運維請收藏~ 12年資深運維老司機的成長感悟 搭建一套完整的企業(yè)級 K8s 集群(kubeadm方式)
點亮,服務(wù)器三年不宕機