
實(shí)時(shí)監(jiān)控:基于流計(jì)算 Oceanus ( Flink ) 實(shí)現(xiàn)系統(tǒng)和應(yīng)用級(jí)實(shí)時(shí)監(jiān)控
一、解決方案描述
(一)概述

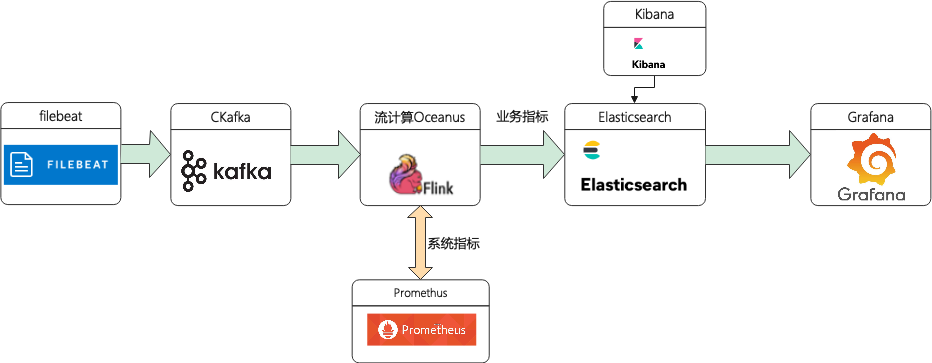
(二)方案架構(gòu)?
二、前置準(zhǔn)備
(一)創(chuàng)建私有網(wǎng)絡(luò) VPC
(二)創(chuàng)建 CKafka 實(shí)例
topic-app-info (三)創(chuàng)建流計(jì)算 Oceanus 集群
(四)創(chuàng)建 Elasticsearch 實(shí)例
(五)創(chuàng)建云監(jiān)控 Prometheus 實(shí)例
為了展示自定義系統(tǒng)指標(biāo),需購買 Promethus 服務(wù)。只需要自定業(yè)務(wù)指標(biāo)的同學(xué)可以省略此步驟。
進(jìn)入云監(jiān)控控制臺(tái),點(diǎn)擊左側(cè) 【Prometheus 監(jiān)控】,新建 Promethus 實(shí)例,具體的步驟請(qǐng)參考幫助文檔 (https://cloud.tencent.com/document/product/1416/55982)。
(六)創(chuàng)建獨(dú)立 Grafana 資源
(七)安裝配置 Filebeat
# 監(jiān)控日志文件配置- type: logenabled: truepaths:- /tmp/test.log#- c:\programdata\elasticsearch\logs\*
# 監(jiān)控?cái)?shù)據(jù)輸出項(xiàng)配置output.kafka:version: 2.0.0 # kafka版本號(hào)hosts: ["xx.xx.xx.xx:xxxx"] # 請(qǐng)?zhí)顚憣?shí)際的IP地址+端口topic: 'topic-app-info' # 請(qǐng)?zhí)顚憣?shí)際的topic
注:示例選用2.4.1的 CKafka 版本,這里配置 version: 2.0.0。版本對(duì)應(yīng)不上可能出現(xiàn)“ERROR ? [kafka] kafka/client.go:341 ? ? Kafka (topic=topic-app-info): dropping invalid message”錯(cuò)誤
三、方案實(shí)現(xiàn)
接下來通過案例介紹如何通過流計(jì)算 Oceanus 實(shí)現(xiàn)個(gè)性化監(jiān)控。
(一)Filebeat 采集數(shù)據(jù)
1、進(jìn)入到 Filebeat 根目錄下,并啟動(dòng) Filebeat 進(jìn)行數(shù)據(jù)采集。示例中采集了 top 命令中顯示的 CPU、內(nèi)存等信息,也可以采集 jar 應(yīng)用的日志、JVM 使用情況、監(jiān)聽端口等,詳情參考 Filebeat 官網(wǎng)
(https://www.elastic.co/guide/en/beats/filebeat/current/configuration-filebeat-options.html)。
# filebeat啟動(dòng)
./filebeat -e -c filebeat.yml

# 監(jiān)控系統(tǒng)信息寫入test.log文件
top -d 10 >>/tmp/test.log 2、進(jìn)入 CKafka 頁面,點(diǎn)擊左側(cè)【消息查詢】,查詢對(duì)應(yīng) topic 消息,驗(yàn)證是否采集到數(shù)據(jù)。
{"@timestamp": "2021-08-30T10:22:52.888Z","@metadata": {"beat": "filebeat","type": "_doc","version": "7.14.0"},"input": {"type": "log"},"host": {"ip": ["xx.xx.xx.xx", "xx::xx:xx:xx:xx"],"mac": ["xx:xx:xx:xx:xx:xx"],"hostname": "xx.xx.xx.xx","architecture": "x86_64","os": {"type": "linux","platform": "centos","version": "7(Core)","family": "redhat","name": "CentOSLinux","kernel": "3.10.0-1062.9.1.el7.x86_64","codename": "Core"},"id": "0ea734564f9a4e2881b866b82d679dfc","name": "xx.xx.xx.xx","containerized": false},"agent": {"name": "xx.xx.xx.xx","type": "filebeat","version": "7.14.0","hostname": "xx.xx.xx.xx","ephemeral_id": "6c0922a6-17af-4474-9e88-1fc3b1c3b1a9","id": "6b23463c-0654-4f8b-83a9-84ec75721311"},"ecs": {"version": "1.10.0"},"log": {"offset": 2449931,"file": {"path": "/tmp/test.log"}},"message": "(B[m16root0-20000S0.00.00:00.00kworker/1:0H(B[m[39;49m[K"}
1、定義 Source
CREATE TABLE DataInput (`@timestamp` VARCHAR,`host` ROW<id VARCHAR,ip ARRAY<VARCHAR>>,`log` ROW<`offset` INTEGER,file ROW<path VARCHAR>>,`message` VARCHAR) WITH ('connector' = 'kafka', -- 可選 'kafka','kafka-0.11'. 注意選擇對(duì)應(yīng)的內(nèi)置 Connector'topic' = 'topic-app-info', -- 替換為您要消費(fèi)的 Topic'scan.startup.mode' = 'earliest-offset','properties.bootstrap.servers' = '10.0.0.29:9092','properties.group.id' = 'oceanus_group2', -- 必選參數(shù), 一定要指定 Group ID'format' = 'json','json.ignore-parse-errors' = 'true', -- 忽略 JSON 結(jié)構(gòu)解析異常'json.fail-on-missing-field' = 'false' -- 如果設(shè)置為 true, 則遇到缺失字段會(huì)報(bào)錯(cuò) 設(shè)置為 false 則缺失字段設(shè)置為 null);
CREATE TABLE es_output (`id` VARCHAR,`ip` ARRAY<VARCHAR>,`path` VARCHAR,`num` INTEGER,`message` VARCHAR,`createTime` VARCHAR) WITH ('connector.type' = 'elasticsearch','connector.version' = '6','connector.hosts' = 'http://10.0.0.175:9200','connector.index' = 'oceanus_test2','connector.document-type' = '_doc','connector.username' = 'elastic','connector.password' = 'yourpassword','update-mode' = 'upsert', -- 可選無主鍵的 'append' 模式,或有主鍵的 'upsert' 模式'connector.key-null-literal' = 'n/a', -- 主鍵為 null 時(shí)的替代字符串,默認(rèn)是 'null''format.type' = 'json' -- 輸出數(shù)據(jù)格式, 目前只支持 'json');
INSERT INTO es_outputSELECThost.id as `id`,host.ip as `ip`,log.file.path as `path`,log.`offset` as `num`,message,`@timestamp` as `createTime`from DataInput;
4、配置作業(yè)參數(shù)
flink-connector-elasticsearch6和flink-connector-kafka注: 根據(jù)實(shí)際版本選擇
5、查詢 ES 數(shù)據(jù)
curl -XGET -u username:password http://xx.xx.xx.xx:xxxx/oceanus_test2/_search -H 'Content-Type: application/json' -d'{"query": { "match_all": {}},"size": 10}'
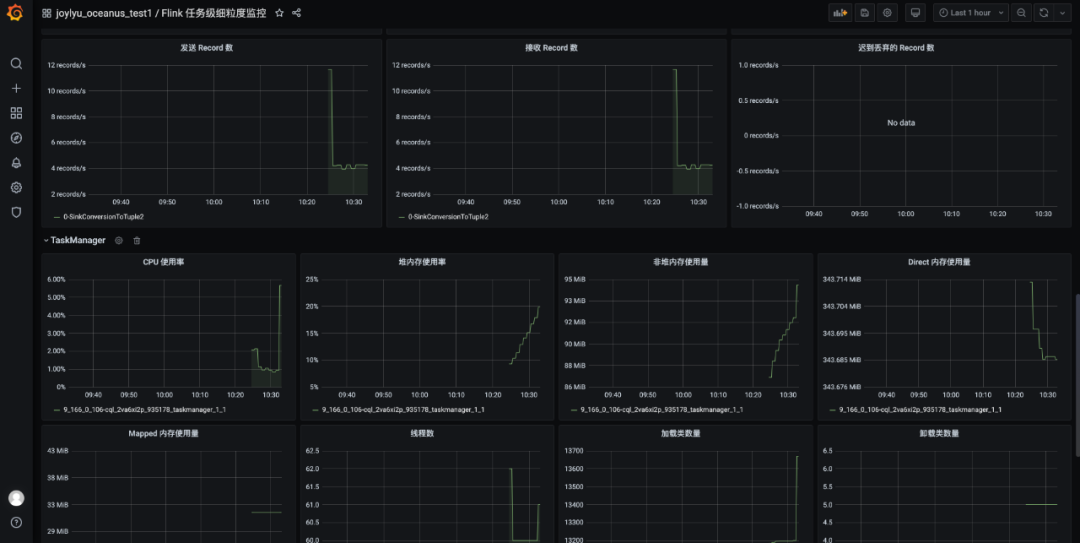
(三)系統(tǒng)指標(biāo)監(jiān)控
監(jiān)控配置 ?
pipeline.max-parallelism: 2048metrics.reporters: promgatewaymetrics.reporter.promgateway.host: xx.xx.xx.xx # Prometheus實(shí)例地址metrics.reporter.promgateway.port: 9090 # Prometheus實(shí)例端口metrics.reporter.promgateway.needBasicAuth: truemetrics.reporter.promgateway.password: xxxxxxxxxxx # Prometheus實(shí)例密碼metrics.reporter.promgateway.interval: 10 SECONDS

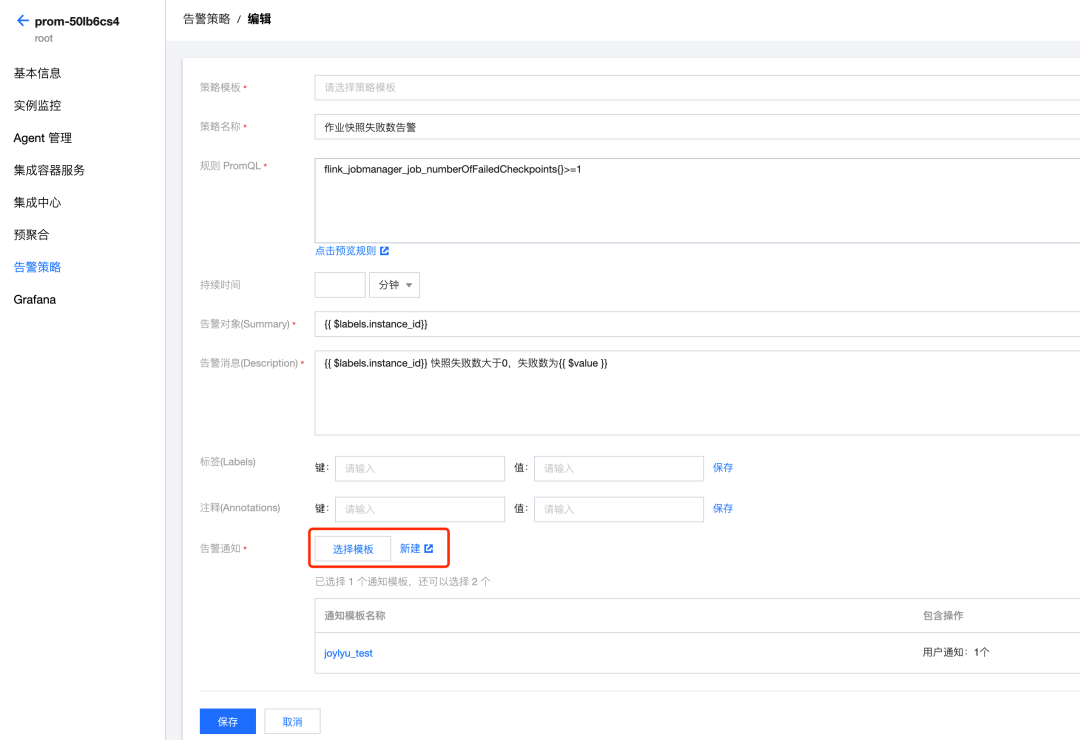
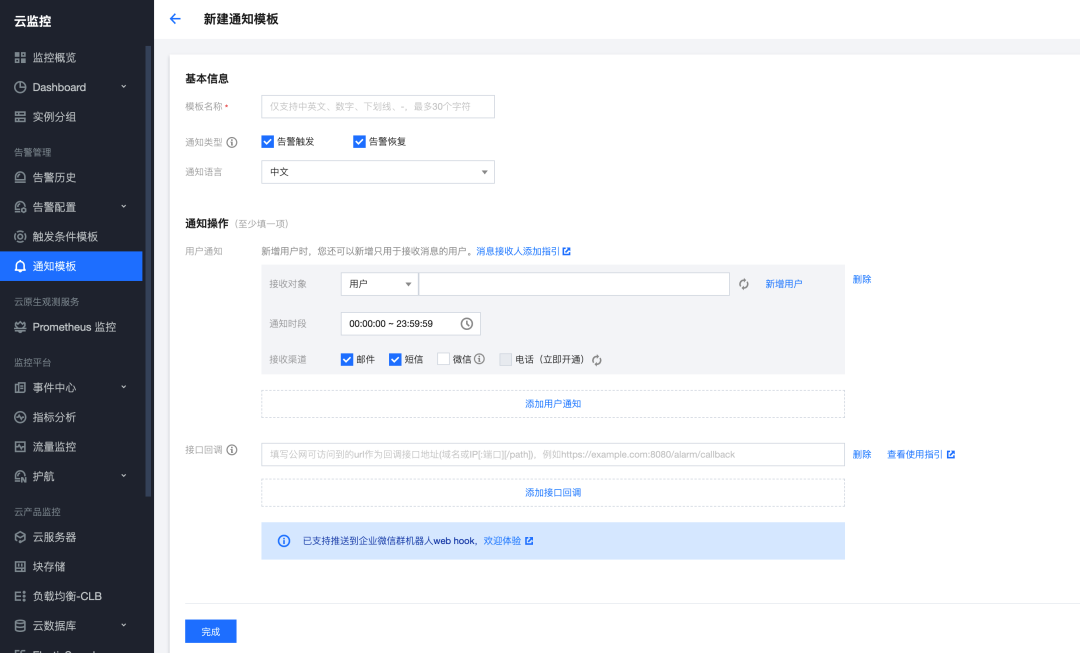
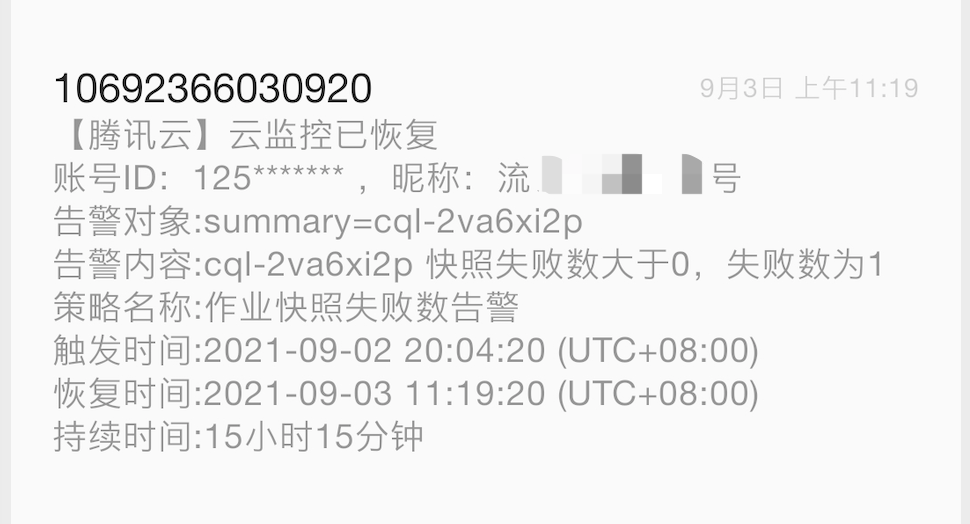
告警配置
(四)業(yè)務(wù)指標(biāo)監(jiān)控
elasticsearch,填寫相關(guān) ES 實(shí)例信息,添加數(shù)據(jù)源。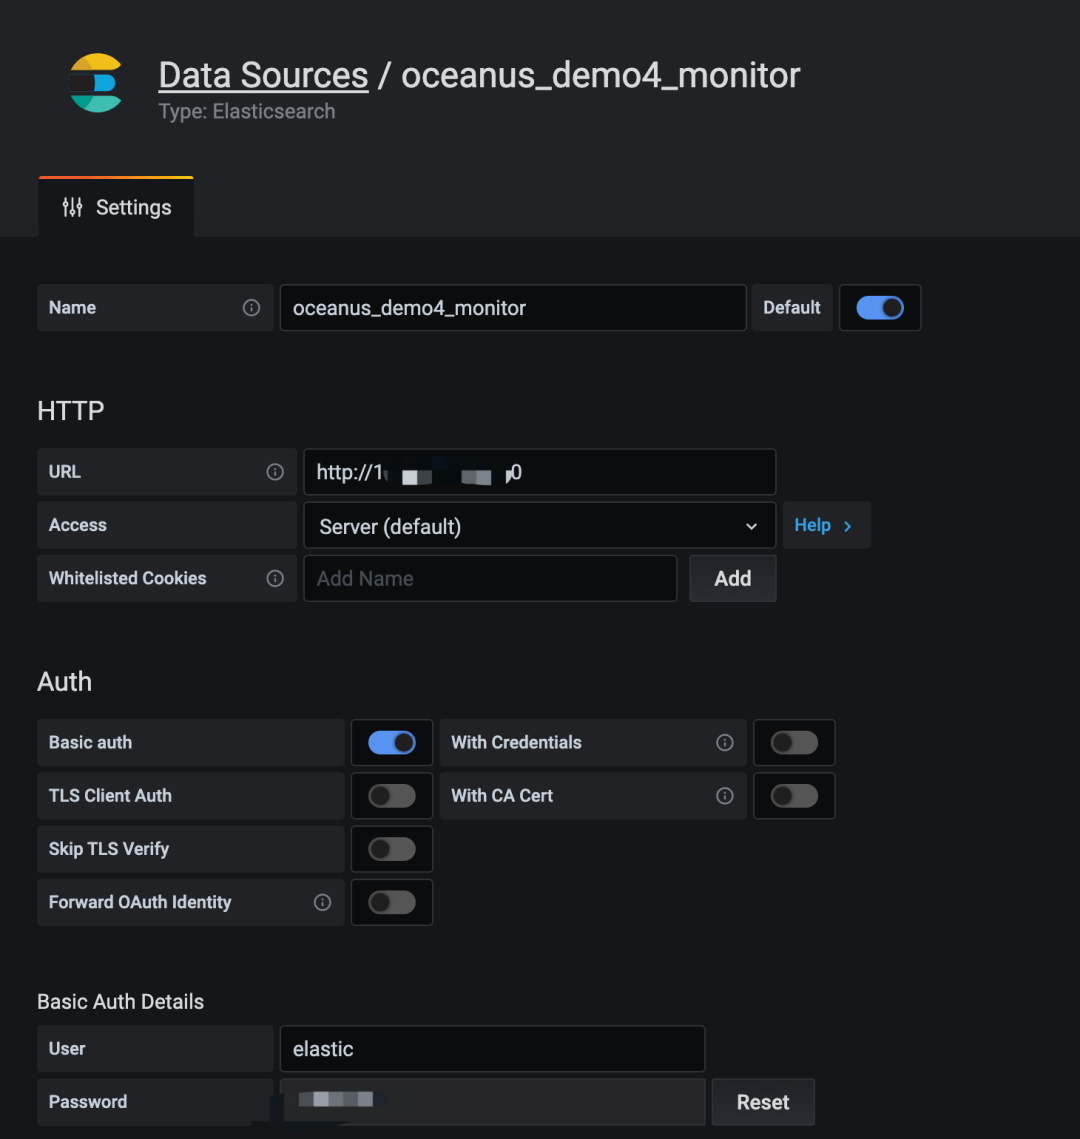
總數(shù)據(jù)量寫入實(shí)時(shí)監(jiān)控:對(duì)寫入數(shù)據(jù)源的總數(shù)據(jù)量進(jìn)行監(jiān)控;?數(shù)據(jù)來源實(shí)時(shí)監(jiān)控:對(duì)來源于某個(gè)特定 log 的數(shù)據(jù)寫入量進(jìn)行監(jiān)控;?字段平均值監(jiān)控:對(duì)某個(gè)字段的平均值進(jìn)行監(jiān)控;?num字段最大值監(jiān)控:對(duì) num 字段的最大值進(jìn)行監(jiān)控;
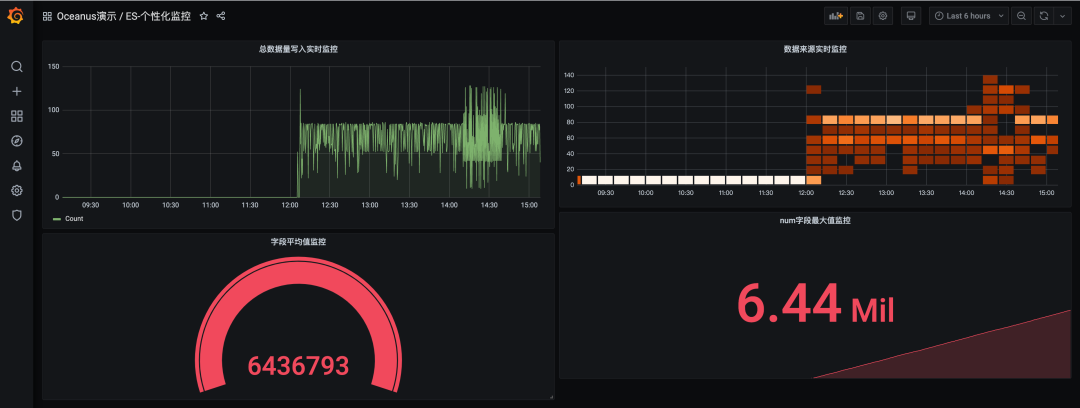
注:本處只做示例,無實(shí)際業(yè)務(wù)
四、總結(jié)
CKafka 的版本和開源版本 Kafka 并沒有嚴(yán)格對(duì)應(yīng),方案中 CKafka2.4.1和開源 Filebeat-1.14.1版本能夠調(diào)試成功。
云監(jiān)控中的 Promethus 服務(wù)已經(jīng)嵌入了 Grafana 監(jiān)控服務(wù)。但不支持自定義數(shù)據(jù)源,該嵌入的 Grafana 只能接入 Promethus,需使用獨(dú)立灰度發(fā)布的 Grafana 才能完成ES數(shù)據(jù)接入 Grafana。