
Golang分析內(nèi)存溢出
這里是Z哥的個人公眾號
每周五11:45 按時送達
當然了,也會時不時加個餐~
我的第「223」篇原創(chuàng)敬上
_ "net/http/pprof"go func() {http.ListenAndServe("0.0.0.0:8899", nil) //ip和端口可以更換}()
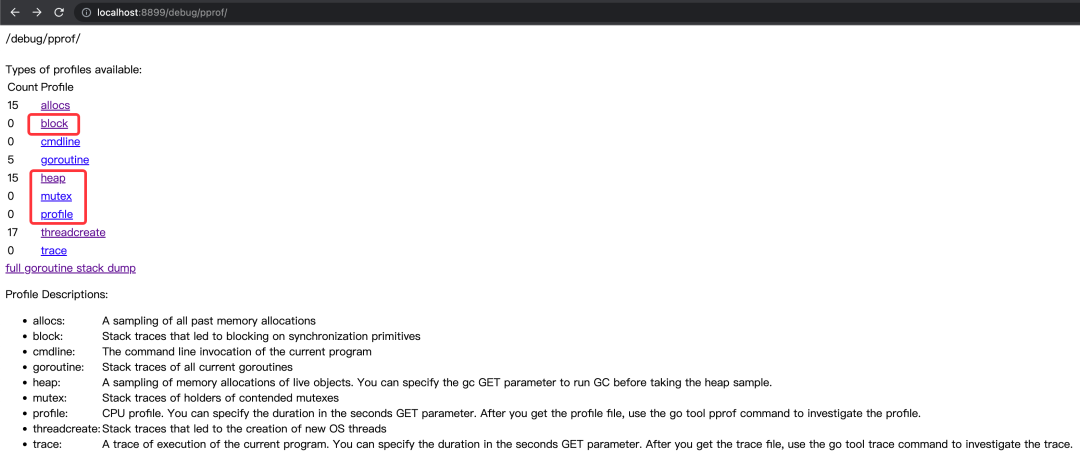
阻塞分析。比如,goroutine 的 wait。
內(nèi)存分析。比如,內(nèi)存泄漏、內(nèi)存消耗異常等情況。
互斥鎖分析。比如,觀察代碼里用到的 sync.RWMutex 和 sync.Mutex 的具體情況。
CPU 分析。比如,排查哪些代碼較多地占用了 CPU 資源。
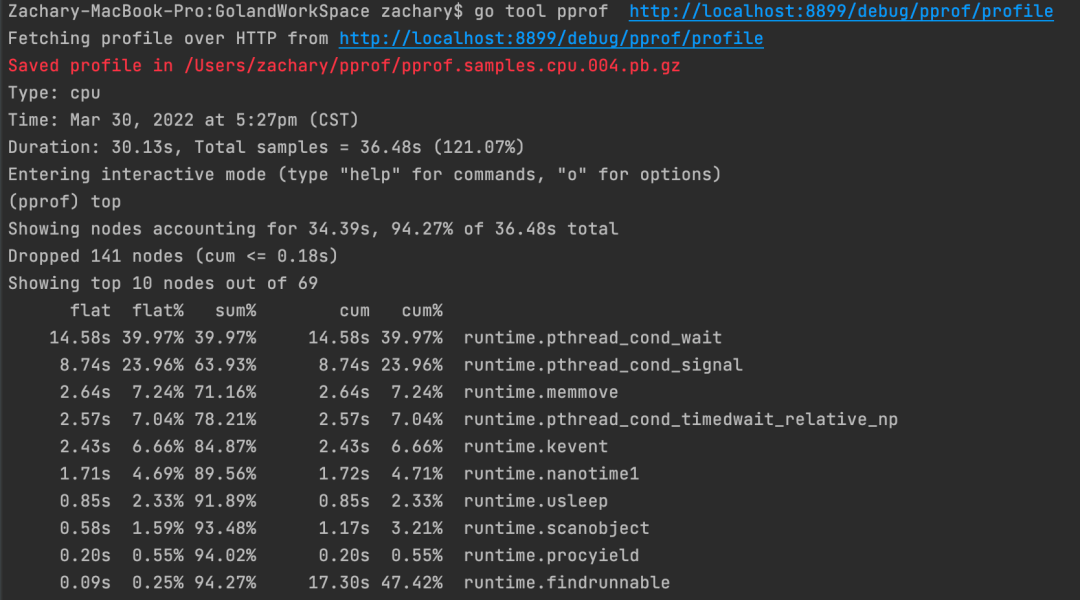
通過url。go tool pprof ?http://localhost:8899/debug/pprof/profile
通過文件。go tool pprof cpuprofile ?文件路徑
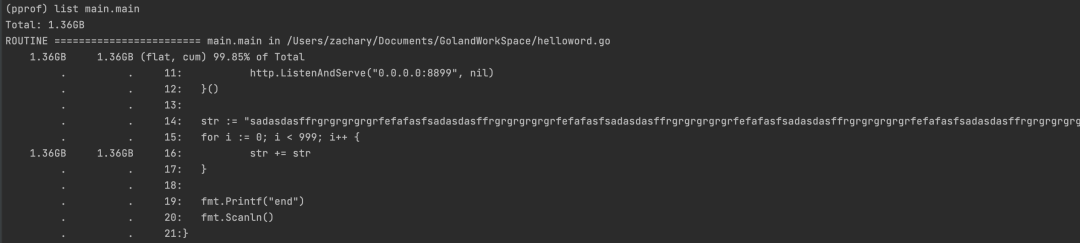
func main() {go func() {http.ListenAndServe("0.0.0.0:8899", nil)}()??str := "sadasdasffrgrgrgrgrgrfefafasfsadasdasffrgrgrgrgrgrfefafasfsadasdasffrgrgrgrgrgrfefafasfsadasdasffrgrgrgrgrgrfefafasfsadasdasffrgrgrgrgrgrfefafasfsadasdasffrgrgrgrgrgrfefafasf"for i := 0; i < 999; i++ {str += str}??fmt.Scanln()}
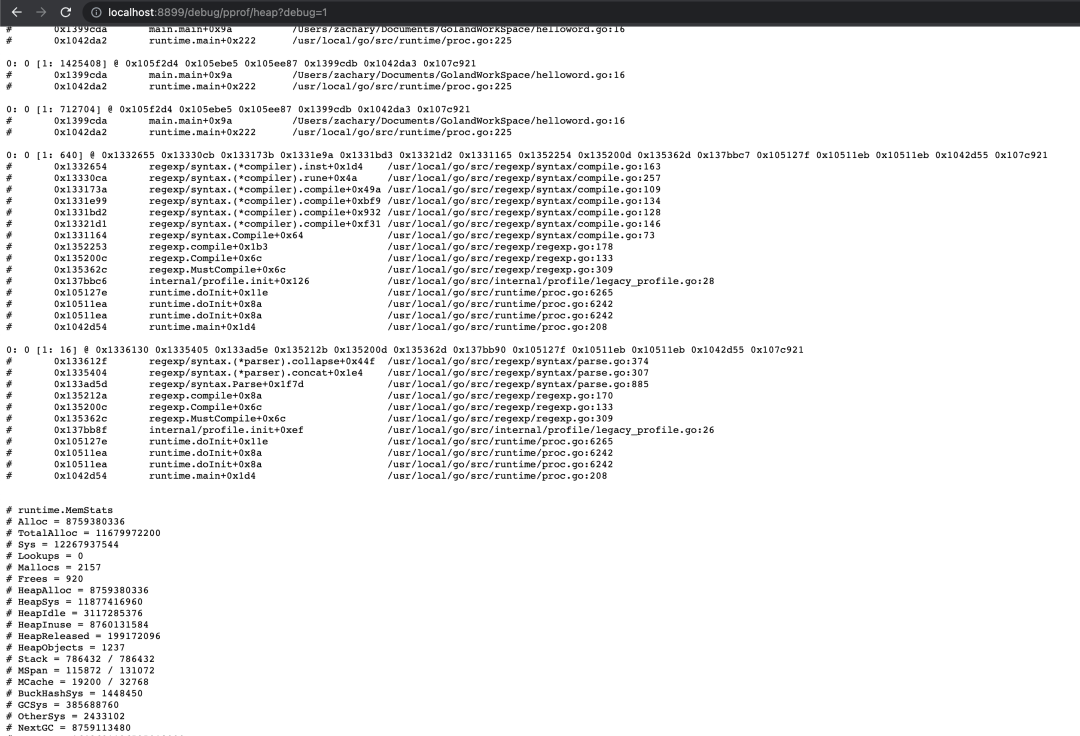
go tool pprof http://localhost:8899/debug/pprof/heap
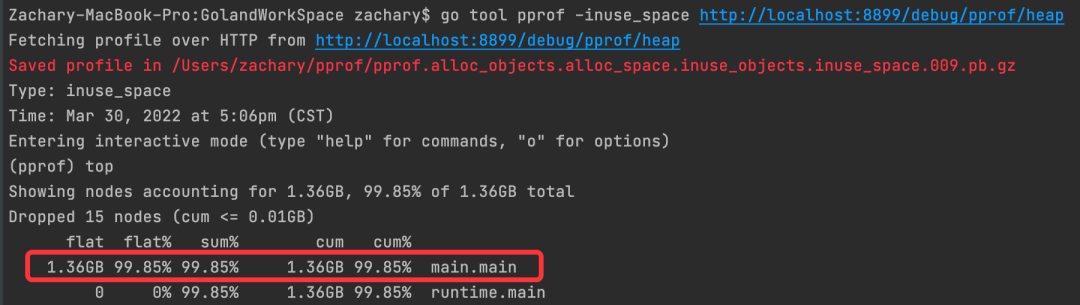
flat:當前函數(shù)所占用的容量。
flat%:當前函數(shù)所占用的容量,在總分配容量的百分比。
sum%:是從調(diào)用的最外層到當前方法累加使用的容量占總?cè)萘康陌俜直?/span>
cum:當前函數(shù)以及子函數(shù)所占用的容量。
cum%:當前函數(shù)以及子函數(shù)所占用的容量,在總分配容量的百分比。
最后一列是函數(shù)的名字
list main.main

ulimit -c 1024 ?或者 ulimit -c unlimited 來設(shè)置 dump 文件的最大 size。
echo "ulimit -c unlimited" >> ~/.profile
export
export GOBACTRACE=crash

echo "export GOTRACEBACK=crash " >> ~/.profile
通過 pprof 實時分析。
程序 crash 時自動保存 dump,再通過 delve 或者 gdb 分析。
推薦閱讀:
原創(chuàng)不易,如果你覺得這篇文章還不錯,就「點贊」或者「在看」一下吧,鼓勵我的創(chuàng)作 :)
也可以分享我的公眾號名片給有需要的朋友們。
如果你有關(guān)于軟件架構(gòu)、分布式系統(tǒng)、產(chǎn)品、運營的困惑
可以試試點擊「閱讀原文」
評論
圖片
表情