
dython:Python數(shù)據(jù)建模寶藏庫(kù)

添加微信號(hào)"CNFeffery"加入技術(shù)交流群
盡管已經(jīng)有了scikit-learn、statsmodels、seaborn等非常優(yōu)秀的數(shù)據(jù)建模庫(kù),但實(shí)際數(shù)據(jù)分析過(guò)程中常用到的一些功能場(chǎng)景仍然需要編寫(xiě)數(shù)十行以上的代碼才能實(shí)現(xiàn)。
而今天要給大家推薦的dython就是一款集成了諸多實(shí)用功能的數(shù)據(jù)建模工具庫(kù),幫助我們更加高效地完成數(shù)據(jù)分析過(guò)程中的諸多任務(wù):

通過(guò)下面兩種方式均可完成對(duì)dython的安裝:
pip install dython
或:
conda install -c conda-forge dython
dython中目前根據(jù)功能分類劃分為以下幾個(gè)子模塊:
「data_utils」
data_utils子模塊集成了一些基礎(chǔ)性的數(shù)據(jù)探索性分析相關(guān)的API,如identify_columns_with_na()可用于快速檢查數(shù)據(jù)集中的缺失值情況:
>> df = pd.DataFrame({'col1': ['a', np.nan, 'a', 'a'], 'col2': [3, np.nan, 2, np.nan], 'col3': [1., 2., 3., 4.]})
>> identify_columns_with_na(df)
  column  na_count
1   col2         2
0   col1         1
identify_columns_by_type()可快速選擇數(shù)據(jù)集中具有指定數(shù)據(jù)類型的字段:
>> df = pd.DataFrame({'col1': ['a', 'b', 'c', 'a'], 'col2': [3, 4, 2, 1], 'col3': [1., 2., 3., 4.]})
>> identify_columns_by_type(df, include=['int64', 'float64'])
['col2', 'col3']
one_hot_encode()可快速對(duì)數(shù)組進(jìn)行「獨(dú)熱編碼」:
>> one_hot_encode([1,0,5])
[[0. 1. 0. 0. 0. 0.]
 [1. 0. 0. 0. 0. 0.]
 [0. 0. 0. 0. 0. 1.]]
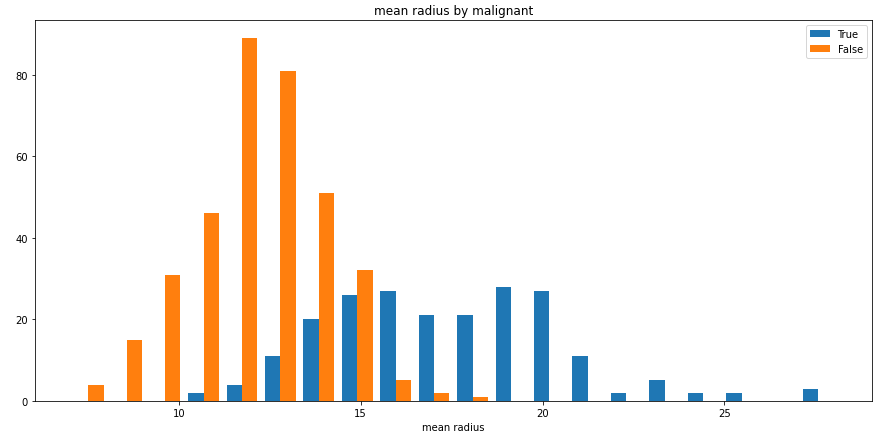
split_hist()則可以快速繪制分組直方圖,幫助用戶快速探索數(shù)據(jù)集特征分布:
import pandas as pd
from sklearn import datasets
from dython.data_utils import split_hist

# Load data and convert to DataFrame
data = datasets.load_breast_cancer()
df = pd.DataFrame(data=data.data, columns=data.feature_names)
df['malignant'] = [not bool(x) for x in data.target]

# Plot histogram
split_hist(df, 'mean radius', split_by='malignant', bins=20, figsize=(15,7))
「nominal」
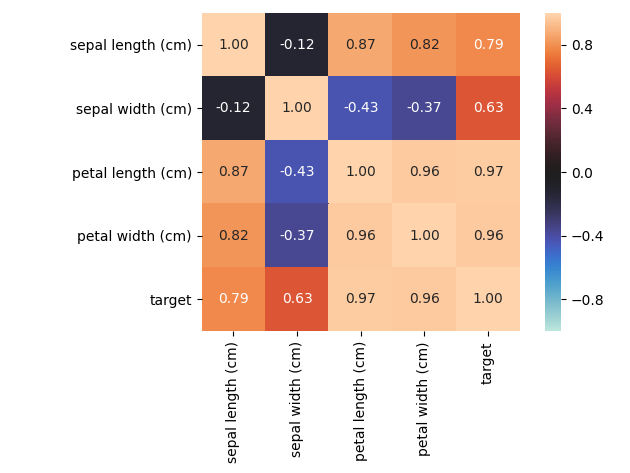
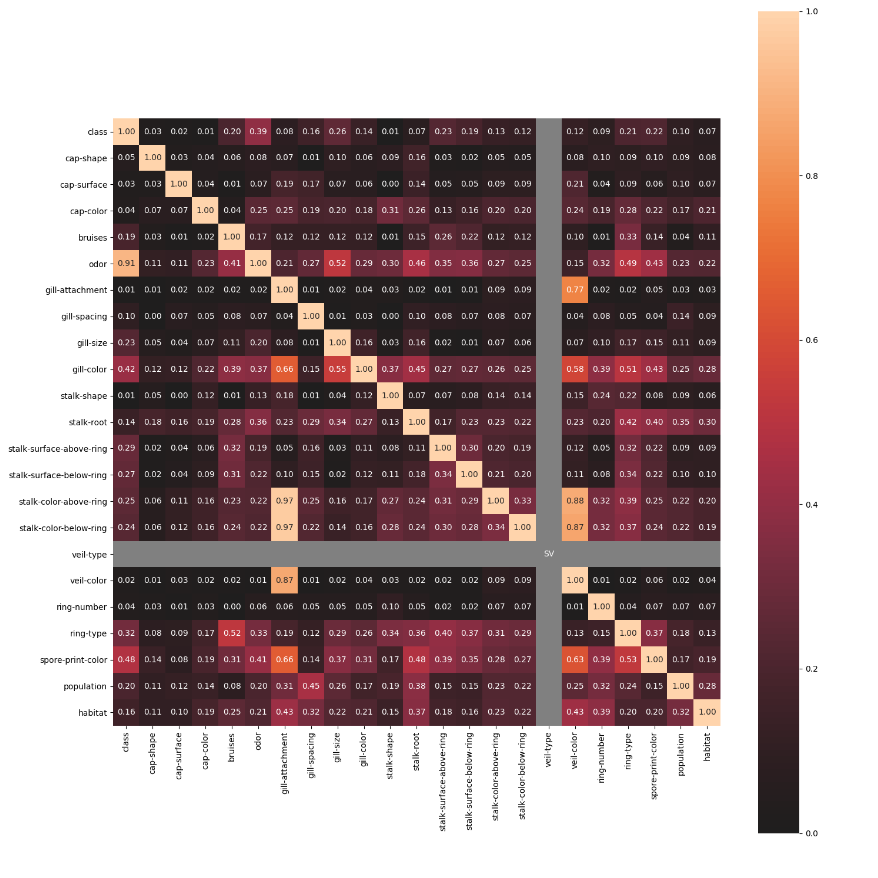
nominal子模塊包含了一些進(jìn)階的特征相關(guān)性度量功能,例如其中的associations()可以自適應(yīng)由連續(xù)型和類別型特征混合的數(shù)據(jù)集,并自動(dòng)計(jì)算出相應(yīng)的Pearson、Cramer's V、Theil's U、條件熵等多樣化的系數(shù);cluster_correlations()可以繪制出基于層次聚類的相關(guān)系數(shù)矩陣圖等實(shí)用功能:
「model_utils」
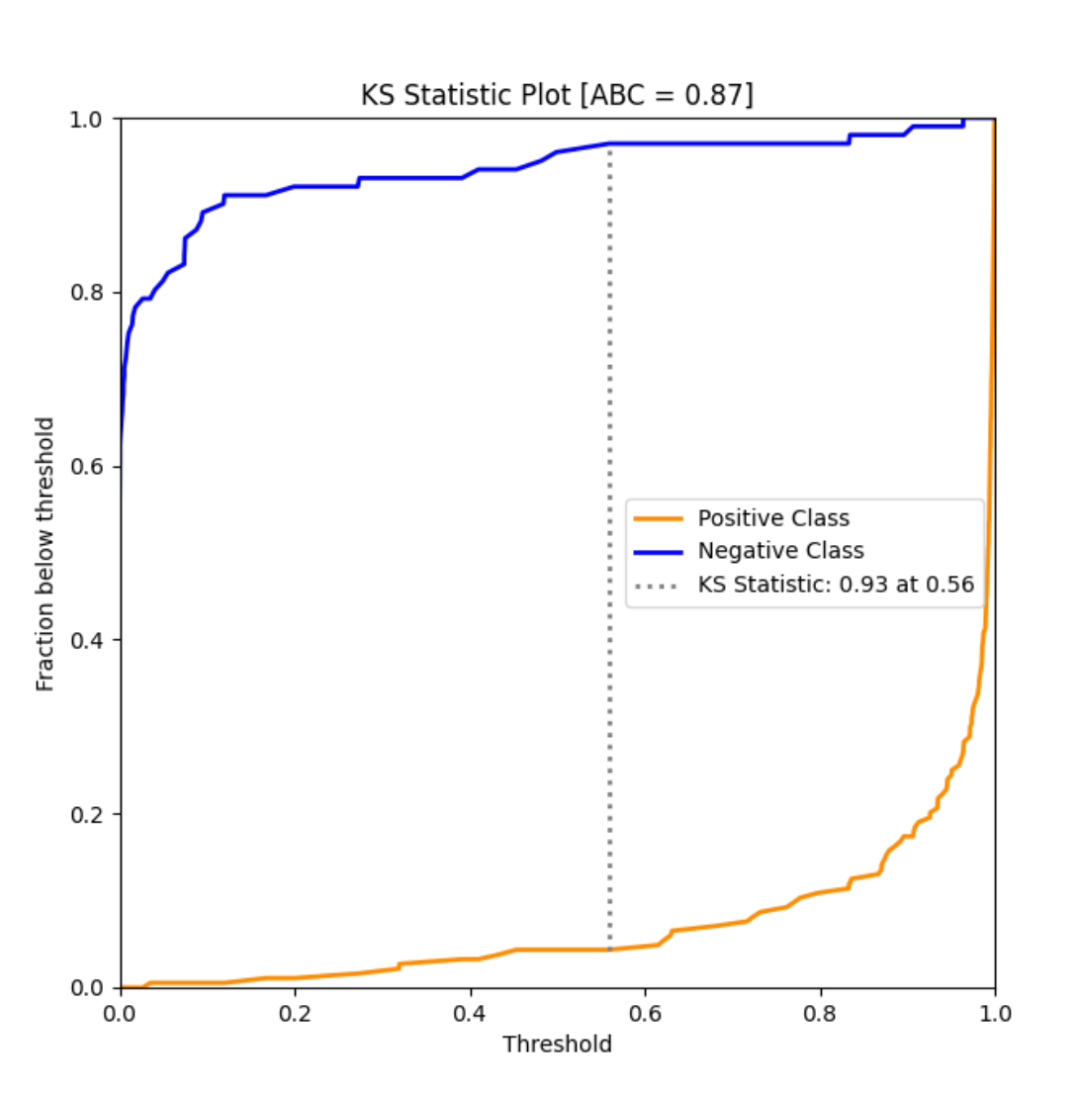
model_utils子模塊包含了諸多對(duì)機(jī)器學(xué)習(xí)模型進(jìn)行性能評(píng)估的工具,如ks_abc():
from sklearn import datasets
from sklearn.model_selection import train_test_split
from sklearn.linear_model import LogisticRegression
from dython.model_utils import ks_abc

# Load and split data
data = datasets.load_breast_cancer()
X_train, X_test, y_train, y_test = train_test_split(data.data, data.target, test_size=.5, random_state=0)

# Train model and predict
model = LogisticRegression(solver='liblinear')
model.fit(X_train, y_train)
y_pred = model.predict_proba(X_test)

# Perform KS test and compute area between curves
ks_abc(y_test, y_pred[:,1])
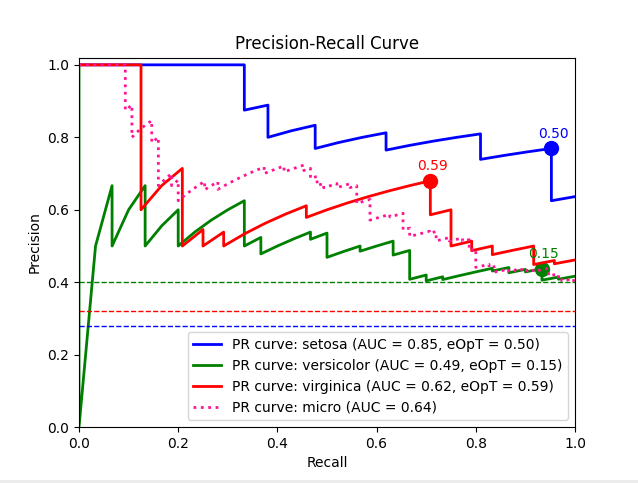
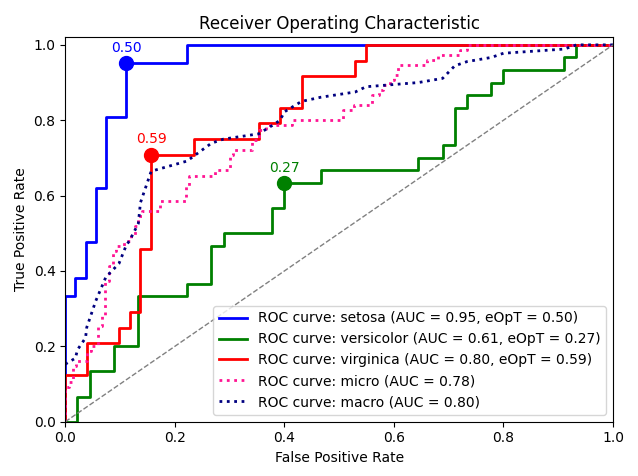
metric_graph():
import numpy as np
from sklearn import svm, datasets
from sklearn.model_selection import train_test_split
from sklearn.preprocessing import label_binarize
from sklearn.multiclass import OneVsRestClassifier
from dython.model_utils import metric_graph

# Load data
iris = datasets.load_iris()
X = iris.data
y = label_binarize(iris.target, classes=[0, 1, 2])

# Add noisy features
random_state = np.random.RandomState(4)
n_samples, n_features = X.shape
X = np.c_[X, random_state.randn(n_samples, 200 * n_features)]

# Train a model
X_train, X_test, y_train, y_test = train_test_split(X, y, test_size=.5, random_state=0)
classifier = OneVsRestClassifier(svm.SVC(kernel='linear', probability=True, random_state=0))

# Predict
y_score = classifier.fit(X_train, y_train).predict_proba(X_test)

# Plot ROC graphs
metric_graph(y_test, y_score, 'pr', class_names=iris.target_names)
import numpy as np
from sklearn import svm, datasets
from sklearn.model_selection import train_test_split
from sklearn.preprocessing import label_binarize
from sklearn.multiclass import OneVsRestClassifier
from dython.model_utils import metric_graph

# Load data
iris = datasets.load_iris()
X = iris.data
y = label_binarize(iris.target, classes=[0, 1, 2])

# Add noisy features
random_state = np.random.RandomState(4)
n_samples, n_features = X.shape
X = np.c_[X, random_state.randn(n_samples, 200 * n_features)]

# Train a model
X_train, X_test, y_train, y_test = train_test_split(X, y, test_size=.5, random_state=0)
classifier = OneVsRestClassifier(svm.SVC(kernel='linear', probability=True, random_state=0))

# Predict
y_score = classifier.fit(X_train, y_train).predict_proba(X_test)

# Plot ROC graphs
metric_graph(y_test, y_score, 'roc', class_names=iris.target_names)
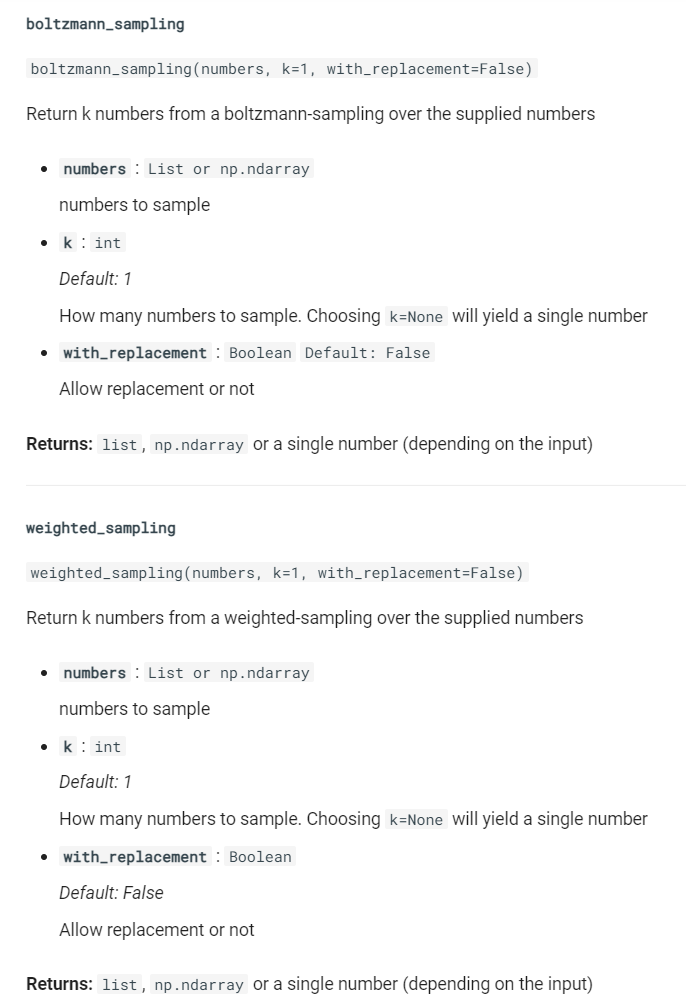
「sampling」
sampling子模塊則包含了boltzmann_sampling()和weighted_sampling()兩種數(shù)據(jù)采樣方法,簡(jiǎn)化數(shù)據(jù)建模流程。
dython作為一個(gè)處于快速開(kāi)發(fā)迭代過(guò)程的Python庫(kù),陸續(xù)會(huì)有更多的實(shí)用功能引入,感興趣的朋友們可以前往https://github.com/shakedzy/dython查看更多內(nèi)容或?qū)Υ隧?xiàng)目保持關(guān)注。
以上就是本文的全部?jī)?nèi)容,歡迎在評(píng)論區(qū)與我進(jìn)行討論~

加入知識(shí)星球【我們談?wù)摂?shù)據(jù)科學(xué)】
400+小伙伴一起學(xué)習(xí)!
· 推薦閱讀 ·
在Python中操縱json數(shù)據(jù)的最佳方式
Python中JSON結(jié)構(gòu)數(shù)據(jù)的高效增刪改操作